

1 Introduction
Tectonic deformation in the Levant is primarily related to the Dead Sea Fault (DSF), a ∼ 1000-km-long continental transform fault forming the tectonic boundary between the Arabian plate and the Sinai subplate in the eastern Mediterranean region (Fig. 1). The DSF is generally divided into 3 sections: the southern section spanning from the Gulf of Aqaba to the Jordan Valley, the central section that includes Mount Lebanon and the Anti-Lebanon ranges, and the northern section that runs parallel to the eastern side of the Syrian Coastal Mountains and joins with the East Anatolian Fault in southern Turkey. The main movement along the DSF is left-lateral, which results in a maximum total horizontal offset of ∼ 105 km across the southern part of the DSF according to several geological markers (Freund, 1970; Quennell, 1957, 1958). Bartov et al. (1980) and Garfunkel (1981) date the initiation of slip to the Early Miocene (∼ 20 Ma).

Large-scale tectonic map of the Dead Sea Fault. The rectangle underlines the area under study around the Wadi Arava fault and is detailed on Fig. 2.
Recent studies have characterized the first order geodetic velocity field around the DSF (Alchalbi et al., 2010; Al-Tarazi et al., 2011; Gomez et al., 2007; Le Béon et al., 2008; Reilinger et al., 2006; Sadeh et al., 2012; Wdowinski et al., 2004). The velocity is varying from a rate of ∼ 5 mm/yr along the southern and central segments to a rate of ∼ 2 mm/yr along the northern segment (north of 35°N). An average locking depth of 11 ± 9 km is proposed along the southernmost segment (Al-Tarazi et al., 2011; Le Béon et al., 2008; Sadeh et al., 2012) while this locking depth is very difficult to estimate along the northernmost segment (Alchalbi et al., 2010).
In this study, we focus on the Wadi Arava fault, which is located in the southern section of the DSF, between the Gulf of Aqaba and the Dead Sea (Fig. 2). The slip rate of about 5 mm/yr proposed by geodetic studies along the southern part of the DSF is consistent with paleoseimological and geomorphological studies (Klinger et al., 2000; Le Béon et al., 2010, 2012; Niemi et al., 2001). Historical records document the strong earthquake potential of the southern DSF, despite a general seismic quiescence over the past few centuries (Ambraseys et al., 1994). Large historical earthquakes occurred in the southern Arava in 1068 (M > 7), 1212, 1293 and 1458 (M 6.5–7) (Ambraseys et al., 1994; Guidoboni and Comastri, 2005). More recently, in 1927, the Jordan Valley and the northern Dead Sea experienced a moderate earthquake (ML 6.2) (Avni et al., 2002; Shapira et al., 1993). The MW 7.3 Nuweiba earthquake in the Gulf of Aqaba was the largest instrumental earthquake in the region (Klinger et al., 1999; Shamir et al., 2003). Recent moderate earthquakes, such as the 2004 (M ∼ 5.3) earthquake near the northern end of the Dead Sea basin (Al-Tarazi et al., 2006; Lazar et al., 2006) attest to the present-day activity of the fault. Marco et al., 1996 suggested that seismic activity near the Dead Sea basin is episodic with periods of relatively high activity and periods of relatively low activity that can last for several centuries, such as over the last 600 years.
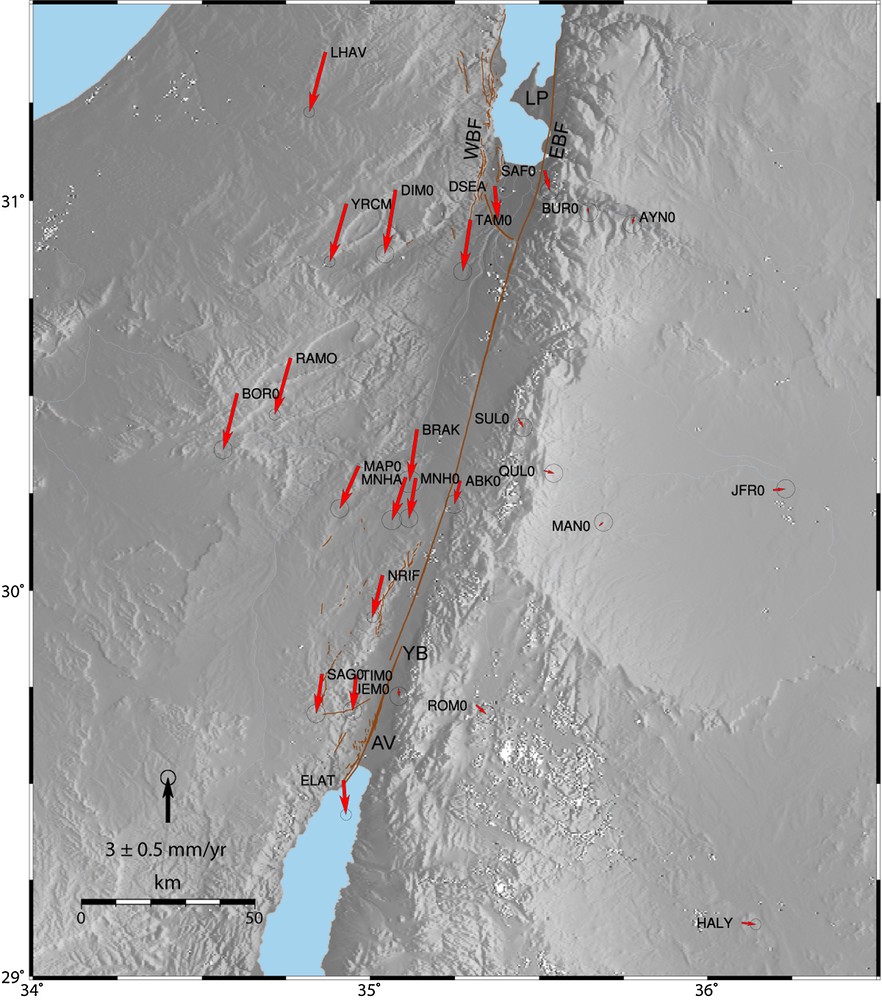
(Color online.) Map of the area under study and the obtained velocity field in an Arabia fixed reference frame. AV: Avrona; YB: Yotveta Basin; LP: Lisan Peninsula; EBF: Eastern Boundary Fault; WBF: Western Boundary Fault.
In this study, we propose a reassessment of the slip rate and locking depth along the southern DSF from the Dead Sea to the Aqaba Gulf. Thanks to a third measurement of a geodetic network installed in 1999 and covering both sides of the fault, we are able to propose a finer velocity description than proposed in the previous studies which indicates some complexities along the Wadi Arava fault not previously taken into account.
2 Data and processing
In this study, we have measured the three profiles perpendicular to the Wadi Arava fault for a third time, presented previously by Le Béon et al. (2008), thereby introducing five supplementary sites, three along the central profile and two along the northern profile. This GPS network was first surveyed in October 1999, again in March 2005, and most recently in November 2011 for the Israeli side and in March 2012 for the Jordan side. Profile locations have been chosen to take advantage of the simple linear geometry of the plate boundary (Freund, 1970; Garfunkel, 1981) (Fig. 2) and of the possibility to anchor benchmarks far enough from the fault, in the non-deforming part of the tectonic plate, on both sides of the fault. An elastic locked-fault model (Savage and Burford, 1973) is used to interpret the observed deformation in term of slip rate along the DSF.
We include ∼ 90 continuous GPS stations from the Israeli network (GIL) and the International GPS Service (IGS) in the processing. We select 11 reliable sites around the world for the stabilization of the network with respect to the ITRF2008 (GLSV GRAZ IISC JOZE KIT3 MAS1 ONSA POL2 RABT VILL ZIMM). We process the 12 years of data using the GAMIT/GLOBK software version 10.4 (King and Bock, 2010), leading to daily position time series and absolute velocity with respect to ITRF2008 for each station. For the continuous stations, in order to estimate accurate data uncertainties, we model the noise of the time series by the sum of white noise and flicker noise, as done by previous studies (Mao et al., 1999; Zhang et al., 1997). The CATS software (Williams, 2003, 2008) is used to compute the amplitude of the components for both noises. As expected, the velocity error decreases when the time-span of the observations increases. For the oldest stations, corresponding to 12 years of data acquisition, the errors on both the north and east components are ∼ 0.3 mm/yr (Table 1). Since a careful modelling of the time series of the campaign stations is not possible, we use the uncertainties given by GAMIT/GLOBK directly, based on the weighting of the phase data. These uncertainties are probably too optimistic.
Summary of the measurements and GPS east and north velocity components in ITRF2008 and relative to Arabia and their uncertainties () are given in mm yr−1. Latitude and longitude are given in degrees north and east, respectively.
| Site | Date of measurements | Longitude | Latitude | ITRF2008 | Fixed Arabia | ||||||||
| 1999 | 2002 | 2005 | 2008 | 2012 | V e | V n | V e | V n | |||||
| Sinai | |||||||||||||
| BOR0 | X | X | X | 34.605 | 30.507 | 23.37 | 19.15 | −0.9365 | −3.7796 | 0.12 | 0.12 | ||
| BRAK | X | X | X | 35.138 | 30.414 | 23.98 | 19.70 | −0.513 | −3.4973 | 0.32 | 0.30 | ||
| DIM0 | X | X | X | 35.075 | 31.027 | 23.24 | 18.88 | −0.7288 | −4.2857 | 0.12 | 0.12 | ||
| MAP0 | X | X | X | 34.965 | 30.321 | 23.27 | 20.24 | −1.2647 | −2.8705 | 0.09 | 0.09 | ||
| MNH0 | X | X | X | 35.134 | 30.289 | 24.14 | 20.50 | −0.4553 | −2.6951 | 0.16 | 0.16 | ||
| MNHA | X | X | X | 35.104 | 30.291 | 23.67 | 20.30 | −0.9176 | −2.8802 | 0.27 | 0.26 | ||
| SAG0 | X | X | X | 34.856 | 29.784 | 24.56 | 20.41 | −0.3981 | −2.6462 | 0.24 | 0.23 | ||
| TAM0 | X | X | X | 35.296 | 30.951 | 23.57 | 19.81 | −0.5083 | −3.466 | 0.13 | 0.12 | ||
| TIM0 | X | X | X | 34.958 | 29.781 | 24.74 | 20.73 | −0.2408 | −2.377 | 0.13 | 0.12 | ||
| LHAV | Continuous since 2000.985 | 34.866 | 31.378 | 22.55 | 19.05 | −1.0815 | −4.0111 | 0.02 | 0.02 | ||||
| YRCM | Continuous since 2005.412 | 34.928 | 30.992 | 22.86 | 19.21 | −1.108 | −3.8822 | 0.02 | 0.02 | ||||
| DSEA | Continuous since 2005.237 | 35.369 | 31.037 | 24.24 | 21.06 | 0.22 | −2.2524 | 0.02 | 0.02 | ||||
| RAMO | Continuous since 1998.162 | 34.763 | 30.598 | 23.19 | 19.20 | −1.073 | −3.8093 | 0.01 | 0.02 | ||||
| NRIF | Continuous since 2005.168 | 35.036 | 30.038 | 24.09 | 20.33 | −0.6933 | −2.8162 | 0.02 | 0.02 | ||||
| ELAT | Continuous since 1999.001 | 34.921 | 29.509 | 25.36 | 20.77 | 0.16 | −2.3184 | 0.01 | 0.01 | ||||
| Arabia | |||||||||||||
| ABK0 | X | X | X | 35.266 | 30.282 | 24.23 | 21.69 | −0.3984 | −1.5711 | 0.19 | 0.18 | ||
| AYN0 | X | X | X | 35.782 | 30.959 | 24.05 | 23.03 | −0.1239 | −0.4875 | 0.18 | 0.18 | ||
| BUR0 | X | X | X | 35.644 | 30.981 | 24.19 | 23.15 | 0.06 | −0.2992 | 0.24 | 0.26 | ||
| JEM0 | X | X | X | 35.083 | 29.746 | 25.07 | 22.67 | 0.04 | −0.4997 | 0.19 | 0.18 | ||
| JFR0 | X | X | X | 36.194 | 30.259 | 25.66 | 23.79 | 0.82 | 0.07 | 0.22 | 0.22 | ||
| KHB1 | X | 35.286 | 30.275 | ||||||||||
| KHB2 | X | 35.297 | 30.275 | ||||||||||
| KHB3 | X | 35.325 | 30.274 | ||||||||||
| MAN0 | X | X | X | 35.678 | 30.166 | 25.09 | 23.71 | 0.28 | 0.24 | 0.23 | 0.22 | ||
| QUL0 | X | X | X | 35.514 | 30.308 | 25.33 | 23.22 | 0.67 | −0.1645 | 0.09 | 0.09 | ||
| ROM0 | X | X | X | 35.313 | 29.704 | 25.79 | 22.67 | 0.67 | −0.6147 | 0.17 | 0.17 | ||
| SAB0 | X | 35.359 | 30.234 | ||||||||||
| SAF0 | X | X | X | 35.517 | 31.076 | 24.36 | 22.05 | 0.34 | −1.336 | 0.21 | 0.20 | ||
| SUL0 | X | X | X | 35.438 | 30.443 | 24.87 | 22.72 | 0.34 | −0.6269 | 0.24 | 0.24 | ||
| HALY | Continuous since 2002.231 | 36.100 | 29.139 | 26.69 | 23.57 | 0.95 | −0.1048 | 0.02 | 0.02 |
In order to study the relative motion between Arabia and Sinai, we choose to represent our data relative to stable Arabia. To do this, we use the Arabian pole defined by Altamimi et al. (2012). Some remarks regarding this velocity field, shown on Fig. 2, are called for. First, neighboring vectors are consistent with each other, in terms of direction and amplitude, showing a smooth decrease of the velocity going eastward toward the Arabian plate. This internal consistency of the velocity field led us to choose to analyze it alone, without combining it with other reported velocity fields. As a result, we can determine the mechanical properties of the DSF in the Arava Valley, better than previously reported. Second, on the Arabian plate, a small but significant eastward movement is observed for all the sites, indicating a small east–west extension along the Arava valley. This is consistent with the extension of 0.6 mm/yr proposed by Reilinger et al. (2006) and Al-Tarazi et al. (2011) along the fault.
3 Modelling
Due to the scale of the study, the movement of the Sinai block relative to the Arabian plate is not described as a rotation, but rather as horizontal displacement due only to elastic loading. Then, the slip rate and locking depth can be inferred using the dislocation model of Savage and Burford (1973). In this model, the fault plane is vertical, with an infinite length, embedded within a homogeneous elastic half-space and the slip vector is horizontal. Velocities are parallel to the fault and are a function of the distance from the fault plane. The velocity V is given by:
| (1) |
The estimate of the error bar of the slip rate and the locking depth is not straightforward. As the model distribution resembles an inclined ellipse, we apply the statistic laws of 2D normal distribution (Ventsel, 1969). We first rotate the distribution along its principal axes and compute the 2σ ellipse, containing 86% of the variance. We then draw this 2σ ellipse in the original V–D axes. The 86%-confidence ellipses are shown On Figs. 3b, 4b, 5b, c and d and 6b. In the text, the error bars given for V and D are the minimum and maximum values of this ellipse in the V–D plane, corresponding to the rectangle containing the ellipse. Therefore, the error bars are very conservative since they include areas beyond the 86% confidence ellipse.

(Color online.) a: fault-parallel velocities and fit to interseismic models. Red dots = velocities with 2σ error bar. Black line: interseismic velocity model; b: distribution of the 10,000 best models using all the data (only one model for the whole Wadi Arava fault). The red dot indicates the mean model considered as the final solution. The blue ellipse is the 86%-confidence ellipse. V = 4.9 ± 0.5 mm/yr. D = 14.5 ± 4.1 km.

(Color online.) Same as in Fig. 3 for the profile crossing the central part of the Wadi Arava fault. V = 4.7 ± 0.7 mm/yr. D = 11.6 ± 5.2 km.
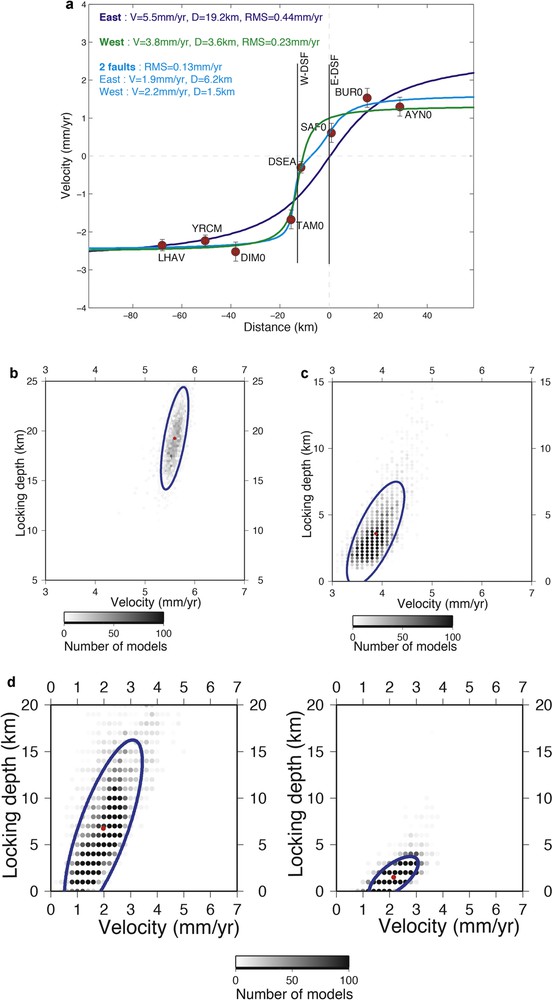
(Color online.) a: same as in Fig. 3a for the profile crossing the northern part of the Wadi Arava fault. Dark blue: the eastern branch of the Dead Sea Fault (DSF) accommodates the movement. V = 5.5 ± 0.3 mm/yr and D = 19.2 ± 5.1 km. Green: the western branch of the DSF accommodates the movement. V = 3.8 ± 0.6 mm/yr and D = 3.6 ± 3.9 km. Light blue: the movement is accommodated by two faults, the western and eastern branches of the DSF. VE = 1.9 ± 1.5 mm/yr, DE = 6.2 ± 9.5 km, VW = 2.2 ± 0.9 mm/yr, DW = 1.5 ± 2.2 km; b–d: same as on Fig. 3b; the eastern branch of the DSF accommodates the movement (b), the western branch of the DSF accommodates the movement (c), and both branches accommodate the movement (d).
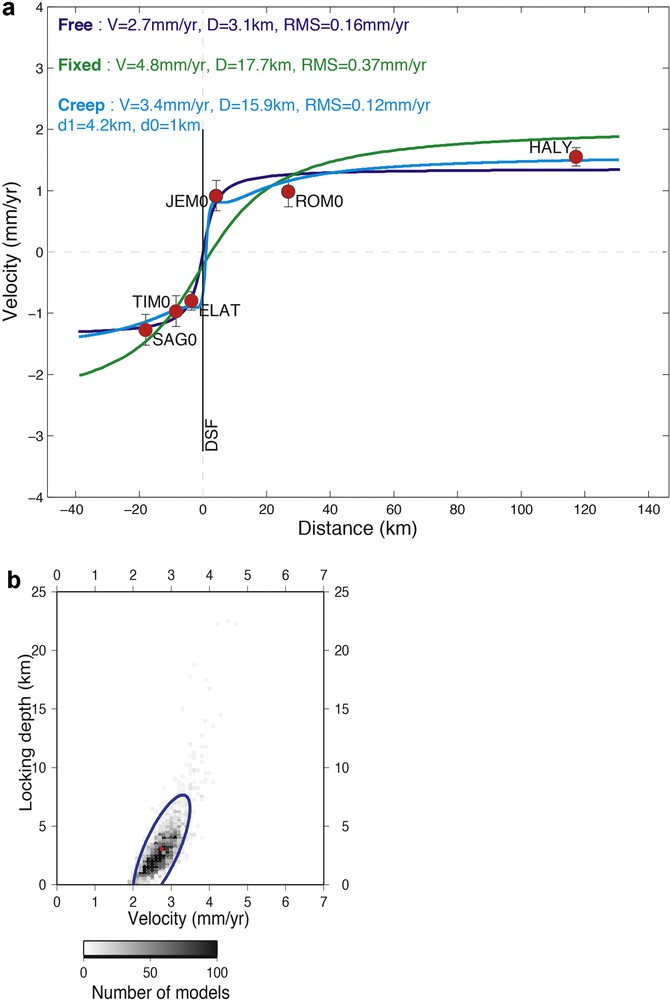
(Color online.) a: same as in Fig. 3a for the profile crossing the southern part of the Wadi Arava fault. Dark blue: velocity and locking depth are freely fixed. V = 2.7 ± 0.7 mm/yr and D = 3.1 ± 4.6 km. Green: velocity is fixed (4.8 mm/yr). D = 17.7 ± 4.8 km. Light blue: a creeping zone is introduced. The inverse problem looks for the velocity, the locking depth and the bottom of the creeping zone (the top is fixed at 1 km depth). V = 3.4 ± 0.4 mm/yr, D = 15.9 ± 5.2 km and d1 = 4.2 ± 1.8 km; b: same as on Fig. 3b for the case where the velocity and the locking depth are freely fixed.
As a first step, we model all the data together considering a mean slip rate and locking depth for the Wadi Arava fault. As a second step, we evaluate the slip rate and locking depth along three separate profiles, which allows us to take into account the complexity of the fault at small scale (Garfunkel et al., 1981; Klinger et al., 2000; van Eck and Hofstetter, 1990). The first one is located in the central part of the Wadi Arava fault, where the fault is localized to a single trace and pure strike-slip movement is observed. The second one is located in the northern part of the Wadi Arava fault, south of the Dead Sea basin. Here, the structure is more complicated and affected by the boundary faults of the Dead Sea basin (Fig. 2). Therefore, at least two parallel fault segments on both sides of the Dead Sea basin have to be taken into account. The third profile is located in the southern part of the Wadi Arava fault, north of Eilat. Here, the structure is probably less complex than that of the northern profile but more complex than that of the central profile. This complexity is underlined by the existence of seismic swarms at the northern end of the Aqaba gulf such as in 1983 (Abou Karaki et al., 1993). In the northern and southern profiles, the existence of creeping zones at small depth will also be investigated. The modelling procedure is not changed, introducing a second parallel fault and/or a creeping zone. The theoretical equation of the movement is modified to take into account the additional parameters, but the choice of the model and the evaluation of the error bars remain unchanged.
3.1 Mean velocity and locking depth of the Wadi Arava fault
To define the mean velocity and locking depth of the whole Wadi Arava fault, we use all stations velocities, presented on Fig. 2. We obtain a velocity of 4.9 ± 0.5 mm/yr and a locking depth of 14.5 ± 4.1 km (Fig. 3a and b), the RMS is 0.38 mm/yr. These results are indistinguishable from the results proposed earlier by Le Béon et al. (2008), Al-Tarazi et al. (2011) and Sadeh et al. (2012) who obtain a velocity of 4.9 ± 0.7 mm/yr, 4.9 ± 0.4 mm/yr and 5.1 mm/yr (4.7–5.4 mm/yr) respectively, and a locking depth of 11.5 ± 5.1 km, 15 ± 5 km and 15.5 km (12.1–23 km), respectively. The current study presents a reduction of the standard deviation of both the locking depth and slip rate compared to Le Béon et al. (2008). The decrease of the velocity errors is due to the large time-span from the first to the third measurement (12 years) and five additional stations (DSEA, YRCM, MNHA, BRAK, NRIF) in the western side of the fault.
3.2 Velocity and locking depth of the central part of the Wadi Arava fault
The central profile contains sites located between BOR0 (close to the Egyptian border, ∼ 70 km west of the fault) and JFR0 (∼ 90 km east of the fault) (Fig. 2). The large west-east extent of the profile ensures that we encompass the entire zone of deformation associated with the Wadi Arava fault, and possible secondary structure if they are at all active. Close to the fault the profile is denser than in Le Béon et al. (2008) due to the addition of NRIF, MNHA and BRAK. NRIF is a permanent station of the Israeli network. MNHA and BRAK are two campaign sites of the Geological Survey of Israel.
We obtain a velocity of 4.7 ± 0.7 mm/yr and a locking depth of 11.6 ± 5.2 km (Fig. 4a and b). The model appears to fit the velocity data very closely (Fig. 4a) with a RMS of 0.19 mm/yr. The velocity is close to the velocity obtained from the whole Wadi Arava fault. We thus propose that the velocity of the central part of the Wadi Arava fault is presently close to 4.7–4.8 mm/yr. This value is comparable to the values of 4.9 mm/yr and 5.0 mm/yr reported by Al-Tarazi et al. (2011) and Sadeh et al. (2012) for the central part of the Wadi Arava fault. This is also consistent with the large-scale block model of Reilinger et al. (2006) for the region (4.5 ± 0.3 mm/yr for the Wadi Arava fault).
3.3 Velocity and locking depth of the northern part of the Wadi Arava fault
This area is tectonically more complex than the central part of the Wadi Arava fault due to faults striking at different orientations and slipping in different directions (Garfunkel and Ben-Avraham, 1996). In a simplified sketch, we consider that the thick sedimentary basin of the Dead Sea is bordered by two main sub-parallel N5° faults, which are called the West Boundary Fault (WBF) and the East Boundary Fault (EBF) (Weber et al., 2009–2010). At the location of the profile, south of the Dead Sea, the more active segment is the eastern one (Bartov et al., 2006), which corresponds to the northward extension of the Wadi Arava fault observed from Eilat toward the north.
Our first step is to assume that the EBF accommodates all the movement between the Arabia and the Sinai plate. Results are shown on Fig. 5a and b. We obtain a velocity of 5.5 ± 0.3 mm/yr, a locking depth of 19.2 ± 5.1 km and a high RMS of 0.44 mm/yr. Both the velocity and the locking depth are significantly higher than along the central profile. The model is relatively well constrained. We cannot reasonably propose a model with a lower velocity and a lower locking depth (Fig. 5a).
As a second step, we assume that the movement is fully accommodated along the WBF. We obtain a velocity of 3.8 ± 0.6 mm/yr and a locking depth of 3.6 ± 3.9 km (Fig. 5a and c). As shown on Fig. 5a, the model fits the data well. This is confirmed by the low RMS of 0.23 mm/yr. The velocity is low but could be increased by a small displacement (∼ 1 mm/yr) along the EBF to rise up to 4.8 mm/yr and a velocity comparable to the central profile. An intriguing point is the very small locking depth, which is smaller than the thickness of the sedimentary basin. Geologic, seismic, gravity, and boreholes data close to the faults indicate that the thickness of the basin is greater than 4 km (Rybakov and Segev, 2004; Segev et al., 2006; Weber et al., 2009–2010; Zak and Freund, 1966). This underlines the fact that our model is oversimplified since lateral mechanical variations of the rocks are not taken into account. We consider a homogeneous structure with the same lithology on both sides of the fault while it is clear in our case that the rocks within the Dead Sea basin are different from the surrounding rocks. The Dead Sea basin consists of soft sediments with low seismic velocities, while outside the basin the rocks are more consolidated (e.g., Weber et al., 2009–2010). Although our model clearly fits the data, we still think that it would not stand to reason. Plenty of field observations attest that the EBF is more active than the WBF. For example, the only reported Holocene rupture of a strike-slip fault dissects on the East of the Lisan Peninsula (Fig. 2) (Bartov et al., 2006).
The third step consists of a model including the two parallel faults, representing the EBF and the WBF. Results are shown on Fig. 5a and d. The velocity is split between the two faults, with 1.9 ± 1.5 mm/yr and 2.2 ± 0.9 mm/yr on the EBF and WBF, respectively. The fit is excellent as shown by a RMS of 0.13 mm/yr. The velocities are relatively well constrained whereby significant variations are not excluded as long as the total velocity is close to 4 mm/yr. Fig. 5d undoubtedly indicates that the locking depth of the WBF is small (1.5 ± 2.2 km), and smaller than the locking depth of the EBF (6.2 ± 9.5 km). The very shallow locking depth of the WBF is most unrealistic and could indicate the existence of shallow creeping along this fault, in which the modelled locking depth is a combination of a dipper locking depth and a shallow creep.
3.4 Velocity and locking depth of the southern part of the Wadi Arava fault
The structure of the DSF along the southern profile is probably less complicated than the structure observed along the northern profile. It is generally proposed that there is only one main fault, as observed along the central profile. Nevertheless, we cannot exclude some complexities due to the proximity of the Red Sea and the complex behavior of the offshore basins in the Gulf of Aqaba (Ben-Avraham, 1985; Garfunkel, 2000; Klinger et al., 1999; Makovsky et al., 2008; Zilberman et al., 2005). Between the Gulf of Aqaba and the location of the profile, several onshore basins (the major ones being the Avrona and Yutveta) and fault step-over underline this possible complexity.
Here, the main difficulty comes from the lack of far field data to the west, due to the lack of measurements in the Sinai desert, reducing our capacity to determine the velocity of the fault. Fortunately, the existence of the far field site of HALY (∼ 120 km) east of the fault partially compensates for this weakness.
In the first model, we process the data following the exact same simple procedure as in the central profile. Results are shown on Fig. 6a and b. Both the velocity (V0 = 2.7 ± 0.7 mm/yr) and the locking depth (D = 3.1 ± 4.6 km) are very small compared to the central profile. The low velocity is difficult to reconcile with the relative velocity of the Sinai and Arabia plate. Five explanations can be proposed.
The first is a poor evaluation of the velocity due to the lack of western far field data. To check this assumption, we look for the best model while fixing the velocity to the value obtained for the central profile (4.8 mm/yr). Under this assumption, the locking depth was found to be 17.7 ± 4.8 km. Although the fit here is reasonable (RMS = 0.37 mm/yr), it actually fits the data significantly less than with the first model (RMS = 0.16 mm/yr). In fact, the main discrepancy is observed in JEM0. Le Béon et al. (2008) already had difficulties in modelling this site and they chose to eliminate it in their model. Then, fixing the velocity to the velocity obtained for the central profile, they get a satisfactory fit and conclude that the velocity from the South to the North of the Wadi Arava fault is homogeneous. Now, it is more difficult to exclude the site JEM0, due to the third measurement, 6 years later. If we consider that the velocity of JEM0 is reliable, which is supported by the time series (Fig. 7), the model obtained by fixing the velocity is no longer satisfactory and the first model is preferable. The lack of western far field data is not fully responsible of our results.
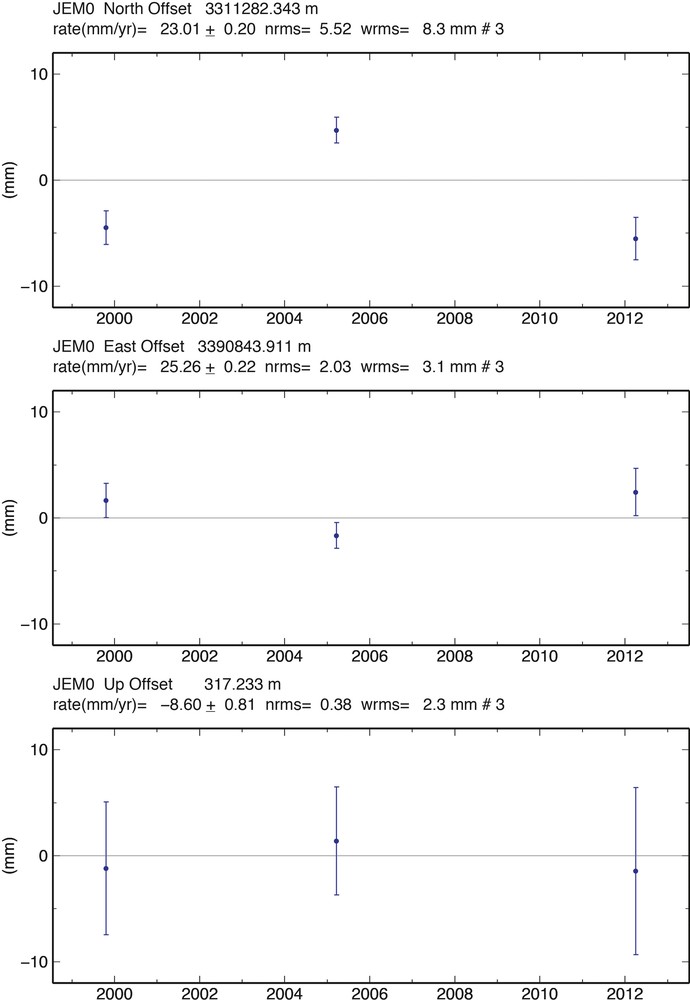
Time series of stations JEM0 after removing the best-fit straight line. The labels show the estimated rate in ITRF, its 1σ uncertainty, and the normalized (nrms) and weighted (wrms) root mean square scatters (in mm).
The second explanation is the existence of a shallow creeping zone. Due to the shallow locking depth and the jump of velocity between ELAT and JEM0, both of them very close to the fault, we have to check the possibility of a shallow creep along this segment. In our model we add a creeping zone between the depths d0 and d1 (Fig. 6a). Due to our sparse set of velocities it is not realistic to constrain both d0 and d1. We arbitrarily fix d0 = 1 km and look for the thickness of the creeping zone, which is equivalent to looking for d1 when d0 is fixed. Doing this, we get V = 3.3 ± 0.4 mm/yr, D = 15.9 ± 5.1 km and d1 = 4.2 ± 1.8 km and RMS = 0.12 mm/yr (Fig. 6a). Both the velocity and the locking depth are close to the values obtained for the central profile. Adding a small part of the velocity along a fault west of our profile, the velocity is roughly consistent with the block model of Reilinger et al. (2006). We also have to check the creeping model by fixing the velocity at 4.8 mm/yr. The thickness of the creeping zone and the locking depth (17 km) do not change significantly, but the quality of the fit decreases.
The third explanation comes from the existence of NS faults parallel to the DSF west of the westernmost site of our profile. Eyal et al. (1981) have identified a 30 km wide shear belt west of the Gulf of Aqaba. By measuring the offsets of contacts in the crystalline basement (as well as Early Miocene dikes) they were able to estimate the slip distributed across the belt, amounting to 24 km. Compared with the total slip of ∼ 100 km, a quarter of the relative plate velocity is distributed on the western margin. Garfunkel (1980) has calculated sinistral slip of 8 and 2.5 km respectively for the two secondary faults west of the Avrona fault (Fig. 2). Beyth et al. (2011) have recently reviewed reports by several authors who have shown that active faulting is distributed west of the northern edge of the Gulf of Aqaba and the southernmost Arava Valley (Fig. 2) (Ginat et al., 1994; Zilberman et al., 2001). All these works seem to suggest that 10–25% of the plate boundary shear might be distributed across the western margin. It is easy to find models that include two faults west of the main branch of the DSF and fit the data perfectly, due to the large number of parameters in regard to the number of data. These models are not constrained due to the lack of data west of our profile in the Sinai.
The fourth explanation is the existence of the geological structure, orientated perpendicular to the DSF, which accommodates the variation of velocity (2 mm/yr) from the central to the southern profile. To do this, we need an east-west structure in compression on the Israeli side or in extension on the Jordanian site (or a combination of both). None of these structures is yet known and no seismicity attests to the presence of such active structures. Moreover, this explanation is not in agreement with the large-scale relative movement of the Sinai and Arabia plates [4.5 mm/yr, Reilinger et al. (2006)]. Therefore, we conclude that this explanation is not realistic.
The last explanation could be the postseismic deformation of the Nuweiba earthquake (1995–Mw = 7.2). But the continuous GPS station of Eilat does not show any postseismic signal (no variation of the velocity observed on the time series). The postseismic deformation of the Neweiba earthquake was already very small in 1999, during the first survey, and has continued to decrease afterwards. Moreover, postseismic signal is generally spatially smoothed, which does not fit our observations.
To summarize, excluding JEM0, a model similar to the model proposed along the central segment of the Wadi Arava fault is consistent with our data set. However, no argument compels us to reject this site. If we do not exclude the JEM0, it is necessary to introduce a shallow creeping zone along the southern segment of the Wadi Arava fault to explain the observed velocity field and/or to propose that a small part of the relative movement from Sinai to Arabia is accommodated along faults west of our profile.
4 Discussion and conclusion
Based on a precise GPS velocity field computed from three sets of measurements in 1999, 2005 and 2011–2012, we are able to carefully model the velocity of the Wadi Arava fault, which is the southernmost sector of the DSF, between the Gulf of Aqaba and the Dead Sea. With this model, coupled with the high quality of the data, we point out some variability in the behavior of the fault along the Wadi Arava.
Taking all the Arava data together, we obtain a velocity of 4.9 ± 0.5 mm/yr and a locking depth of 14.5 ± 4.1 km, which is very similar to the results proposed earlier by Le Béon et al. (2008), Al-Tarazi et al. (2011) and Sadeh et al. (2012) who obtain a velocity of 4.9 ± 0.7 mm/yr, 4.9 ± 0.4 mm/yr and 5.1 mm/yr (4.7–5.4 mm/yr) respectively, and locking depths of 11.5 ± 5.1 km, 15 ± 5 km and 15.5 km (12.1–23 km). The consistency with Al-Tarazi et al. (2011) and Sadeh et al. (2012) not only for the velocity but also for the locking depth must be emphasized.
In its central part, data are easily and precisely fitted by a simple dislocation model with a velocity of 4.7 ± 0.7 mm/yr and a locking depth of 11.6 ± 5.2 km. Here, the DSF is relatively simple, formed by one localized segment, which seems to be fully locked in the upper part of the crust. This result is consistent with that of Le Béon et al. (2008), who proposed a velocity of 4.4 ± 1.9 mm/yr and a locking depth of 9.0 ± 15.5 km mm/yr when they kept the velocity free (i.e. no a priori velocity in the model). Unsurprisingly, the uncertainties are strongly reduced in our study thanks to the third measurement. This is also similar to the result of Reilinger et al. (2006), who propose based on a block model a velocity of 4.5 ± 0.3 mm/yr for this fault.
The differences in the results obtained using all the data or only the data of the central profile could be considered as negligible. But we think it is not the case for several reasons. The first is the agreement between all the models using all the data from the Red Sea to the Dead Sea but never the same data set (Al-Tarazi et al., 2011; Le Béon et al., 2008; Sadeh et al., 2012 and this study). Le Béon et al. (2008) made only two campaigns and did not visit all the sites of this study, and Al-Tarazi et al. (2011) used mainly data on the Jordan side. Conversely, Sadeh et al. (2012) use mainly data on the Israeli side. This leads us to conclude that the mean velocity of the Wadi Arava fault from the Rea Sea to the Dead Sea based on a simple dislocation model is 4.9 mm/yr. However, this mean velocity does not exactly correspond to the velocity obtained for the central part of the fault, which is strongly constrained in our model and also consistent with Le Béon et al. (2008). Therefore, variation of the behavior of the fault from the Red Sea to the Dead Sea is necessary to explain the difference between the mean velocity and the velocity of the central segment.
This variation is demonstrated along the northern profile. Here, the simple model proposed for the central profile does not fit the velocity field well. To fit the data, two faults have to be taken into account, on both sides of the sedimentary basin of the Dead Sea, each fault accommodating ∼ 2 mm/yr. Locking depths are small (less than 2 km on the western branch, ∼ 6 km on the eastern branch). These very small locking depths do not seem realistic, even if the Dead Sea Basin is a pull-apart, suggesting that some extension might take place there and accounts for a shallower locking depth. It could indicate the existence of shallow creeping along this fault. More data and a model that takes into account the rheology of the basin and possibly additional faults are necessary to solve the problem.
Along the southern profile, we are once again unable to fit the data using the simple model, as was the case with the central profile. Under whatever hypothesis for this profile (with or without the JEM0 site, introduction of shallow creep), it is very difficult to propose a velocity greater than 4 mm/yr, i.e. significantly smaller than along the central profile. We propose that a part of the relative movement from Sinai to Arabia is accommodated along faults located west of our profiles. To confirm this, dense GPS measurement should be performed west of the Dead Sea fault, in the Sinai Peninsula.
Acknowledgments
We would like to thank all the participants in the GPS measurements who helped during the fieldwork to make these experiments successful in Jordan and Israel, and especially Yaakov Mizrahi, Miki Golan and Eli Ram for the help in the field, Oksana Piatibratova for her technical assistance, and J.-J. Lévêque for help in providing a reliable estimate of the error bars. This project was sponsored by the French CNRS–INSU and the Israeli Steering Committee for Earthquake Preparedness.