

1 Introduction
The Central–Western Pyrenean seismicity reveals the occurrence of normal faulting on the northern part of this zone (Chevrot et al., 2011; Souriau et al., 2014). Because seismicity occurs in the upper crust down to a depth of 20 km, the origin of this tectonic activity has to be explained at the crustal scale. On the other hand, geodesy suggests a very low north–south extensional regime within the belt (Asensio et al., 2012; Rigo et al., 2015), even though no significant shortening or extension can be measured between Iberia and Western Europe (Nocquet, 2012). The Western Alps present a similar context with a moderate seismicity in the central range without significant present-day horizontal displacements (Sue et al., 2007). By consequence, a direct relationship between horizontal motion across the mountain and active faulting is unlikely.
At least three kinds of processes could play a role in the triggering of the Pyrenean normal faulting. An extensional deformation driven by the gravitational potential energy (GPE) of the thickened crust could be a possible mechanism as it has been suggested for the Alps (Sue et al., 2007). Another mechanism responsible for this extension could be the vertical motion and extension induced by the topographic denudation of the mountain range (Vernant et al., 2013). Recently, a third explanation has been suggested by Souriau et al., 2014. These authors argue that the dense bodies (density of ∼3000 kg·m−3) embedded in the northern Pyrenean crust (density of ∼2750 kg·m−3) could cause differential subsidence and a related seismicity. Our mechanical modelling aims at exploring the likelihood of the relation between these mechanisms and the present-day strain of the Pyrenees.
The Pyrenees forms an east–west linear barrier of 2000 m of mean elevation with its highest summit reaching up to 3400 m. This mountain, separating Spain and France, has a length of 450 km and a width of 100 to 140 km (Supplementary data, Fig. 1bis). A north–south dissymmetry of the topography is observed with steep northern slopes where the north Pyrenean fault is located (Fig. 1B). By contrast, the average topography of the southern Pyrenean slopes is gently decreasing towards the south. This topographical shape is the consequence of a doubly vergent orogenic prism created by the Iberia–Western Europe collision that started during the Upper Cretaceous and ended during the Paleogene (e.g., Beaumont et al., 2000). Moreover, geophysical data reveal an abrupt transition between the Iberian crust and the Eurasian plate, with a Moho depth offset of ∼20 km (Fig. 1C). Geophysical surveys reveal that an intracontinental subduction of the Iberian crust beneath Eurasia may have occurred under the Pyrenees (e.g., ECORS Pyrenees team, 1988) at a depth reaching 70 km (PYROPE studies e.g., Chevrot et al., 2015). These studies suggest that the base of the crust presents a Z-shape (Fig. 1C).
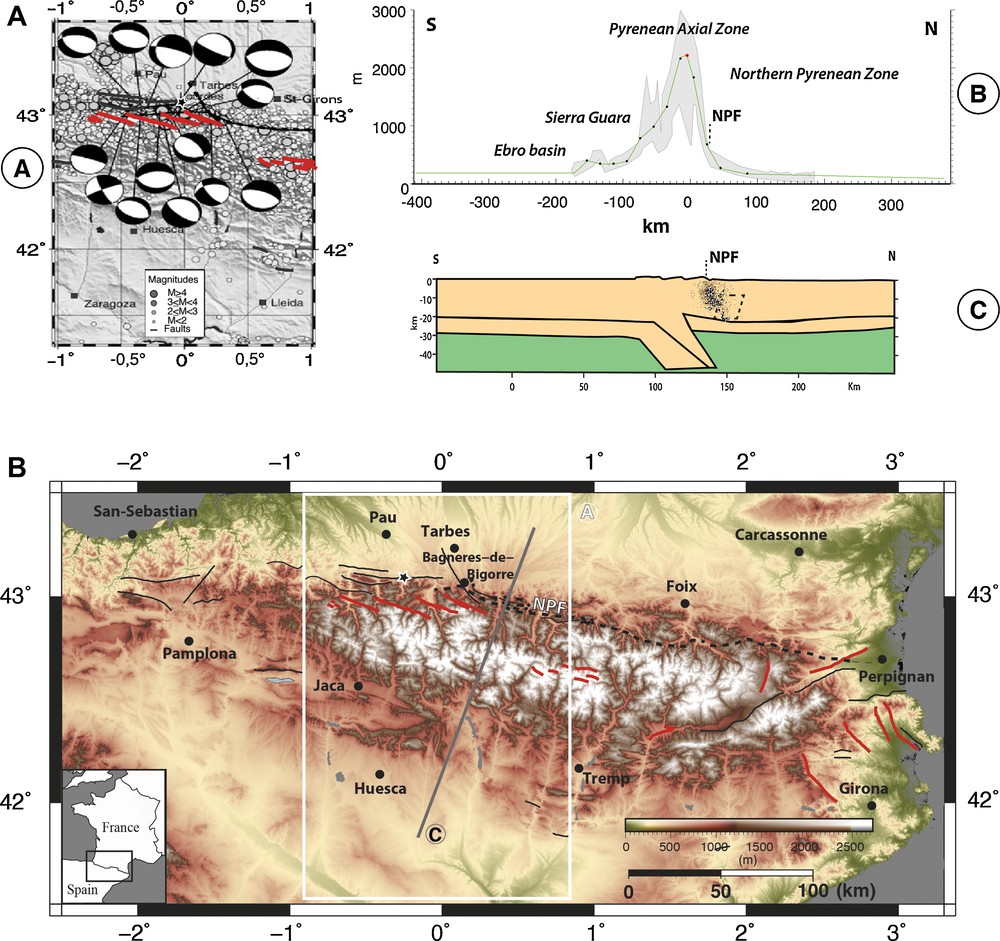
A. Close up on the Central–Western Pyrenean seismogenic zone (from Souriau et al., 2014). Solid lines are for faults with evidence of post-orogenic activity and red lines highlight normal faults (from Lacan & Ortuno, 2012). The dashed line is for the North Pyrenean Fault (NPF), which is not reported as an active fault. B. Mean Central–Western Pyrenean elevations, the green curve is the average topography used in the models. The red point is the reference point used for the position evolution versus time presented in Figs. 3–5. C. Cross-section interpretation of the gravity data for the profile along the grey line shown in A, the yellow and green zones correspond respectively to densities equal to 2750 and 3300 (kg·m−3); the dashed lozenge localizes the dense block, modified from Casas et al. (1997), and we report the seismicity of (A) that draws a north-dipping plane.
The present-day seismogenic pattern of the Pyrenees does not appear to be related to plate convergence and horizontal shortening since no significant present-day motion between Iberia and Western Europe can be estimated by GNSS (Global Navigation Satellite System) measurement (e.g., Nocquet, 2012). Campaign-mode GNSS measurements in the Pyrenees do not reveal internal horizontal displacements exceeding 1 mm/yr (Asensio et al., 2012; Rigo et al., 2015). Despite these extremely low geodetic motions, significant seismicity occurs in the Pyrenees as attested by one Mw > 5 event occurring statistically every 20 years (Dubos, 2003). The earthquakes are mostly located in the first 15 km of the upper crust. The Pyrenean seismicity is organized along a 10–15-km-wide linear band in the Western Pyrenees and a widespread seismicity in the eastern part (Souriau & Pauchet, 1998; Souriau et al., 2001). A relation between seismicity of the North-Western Pyrenees and the North Pyrenean fault (NPF, the suture between Iberian and Eurasian plates) has been proposed by Souriau et al. (2001). However, Rigo et al. (2005) showed that this seismicity is not closely associated with the NPF, but rather organized on short fault segments dipping to the north (55° to 75°). This area is the most seismically active and is associated with normal faulting mechanisms (Chevrot et al., 2011). The origin of this mostly extensional or strike-slip seismicity (Souriau et al., 2001) is puzzling as the overall geodynamical setting between Iberia and Western Europe is not associated with plate divergence. Therefore, only conjectural explanations can be made for the mechanisms driving the Pyrenean seismicity, they are gravitational collapse (e.g., Avouac and Burov, 1996, Jadamec et al., 2007; Molnar and Lyon-Caen, 1988), crustal block subsidence (Souriau et al., 2014) or lithospheric flexure associated with denudation (Vernant et al., 2013). Although these propositions relate to different driving processes, they share the idea that differential motion occurs in the crust in response to local forces associated with isostasy. Therefore, we pursue here the idea that body forces of the Pyrenean crust may result in moderate differential motions revealed by seismicity. Evidences suggesting that crustal root and topography are not isostatically balanced are provided by the comparison between the Bouguer anomaly and the topography (De Cabissole, 1990). In the highest part of Central Pyrenees, the Moho revealed by seismic tomography is significantly deeper than the isostatic Moho computed with a classic mantle–crust density contrast and the present-day topography. This induces a positive isostatic anomaly of 15 mGal (De Cabissole, 1990). This author concludes that the Iberian thickened crust corresponds to an overcompensation of the range. Therefore, the resulting body forces could induce a crustal uplift. On the other hand, dense bodies in the upper crust of the North Pyrenean zone could induce differential subsidence (Casas et al., 1997, Souriau et al., 2014). Another source of strain could be provided by the differential topography between the highest peaks and the foreland. This gravitational potential energy (GPE) could result in a stress state inducing normal faults in the axial part of the range and thrust faults at the mountain foot, as proposed by Molnar and Lyon-Caen (1988). In the northern Central Pyrenees, Lacan and Ortuño (2012) and Alasset and Meghraoui (2005) respectively propose normal and thrust faults (see their localization: red lines and star on a black line, respectively, in Fig. 1A). It is interesting to note that some active normal faults in the northern part are located near the front range (Fig. 1A) where thrust faulting would be expected following the GPE concept.
Surface processes (denudation and sedimentation) are another way to modify the body forces acting on a mountain (Avouac and Burov, 1996; Willett, 2010). The impact of mountain erosion submitted to a low horizontal shortening rate has been discussed by Vernant et al. (2013). To avoid confusion, we need to define erosion and denudation. Based on the definition of Gunn (2013), erosion (m3/km2/yr) is defined as the rock volume evolution due to chemical or physical processes, whereas surface lowering is induced by denudation (mm/yr). Because in our mechanical modelling, surface lowering induces a decrease in the size of the elements, and thus mass loss, denudation and erosion are equivalent for our purpose. We use the term denudation in the following. Coupling between denudation, sedimentation and body forces should also induce, respectively, uplift and subsidence. Vernant et al. (2013) showed, using a mechanical modelling approach, that 50–80% of denudation is converted into rock uplift. The flexure associated with this vertical motion induces horizontal extension of the eroded zone. Unfortunately, present-day surface processes rates of the Pyrenees are still poorly documented. For the last 40 Ma, average denudation rates of ∼0.3 mm/yr have been estimated in the Central Pyrenees using geological cross-sections and zircon fission track (Sinclair et al., 2005; Vergès et al., 1995). In the Eastern Pyrenees, valley incision rates of 0.1 mm/yr are provided by cosmogenic dating of fossil caves (Calvet et al., 2011). Based on these estimates, an isostatic rebound of 0.05–0.1 mm/yr of the Pyrenees could occur nowadays if 50% of the denudation rate were converted into rock uplift. To date, neither GPS measurements nor levelling surveys have been able to detect such a small motion.
In the following, we describe the numerical method used to study the impact of the gravity forces, the denudation process and the geometrical features of the Pyrenees on strain and normal faulting. We apply our model on a section located in the Central–Western Pyrenees. Finally, we discuss the relationships between the modelled uplift rates and crustal strain, the lithosphere rheology, and the present-day strain observations in the Pyrenees.
2 Methods
We postulated that present-day deformation and seismicity of the Pyrenees might occur as a consequence of three kinds of driving forces: (1) gravitational potential energy (GPE) associated with topography and crust-mantle density contrasts; (2) the presence of dense bodies inside the crust; (3) topographic denudation and basin sedimentation induced by erosion and transport processes. The resulting strain depends on the rheological stratification of the lithosphere as well as on the weakness of the inherited fault zones. We used the 2D finite-element code ADELI to account for all these processes (details are provided in Hassani et al., 1997 and in the Supplementary data) on a vertical cross-section. The lithospheric cross-section had a depth of 100 km and was based on the mean topographic profile presented in Fig. 1B. We increased the length of the cross-section to avoid edge effects. On the lateral sides, free vertical displacements were allowed, whereas horizontal displacements were prescribed, since we chose to have neither convergence, nor extension. All models are submitted to hydrostatic pressure on the bottom edge, representing the interaction with an asthenosphere having the same density as the lithospheric mantle.
The seismicity of the Northern Pyrenees has been interpreted at depth as following a 60° north-dipping plane (Fig. 2, Rigo et al., 2005, Souriau et al., 2014). We used this interpretation to define a frictional fault in the upper crust. While doing so, we assumed that active faulting corresponds to the reactivation of fault zones created during the past tectonic history of the Pyrenees. We set the friction to 0.6 (Byerlee, 1967) during the initial part of the experiment, and we changed the friction to 0.02 for the last Ma in order to model a weak fault.
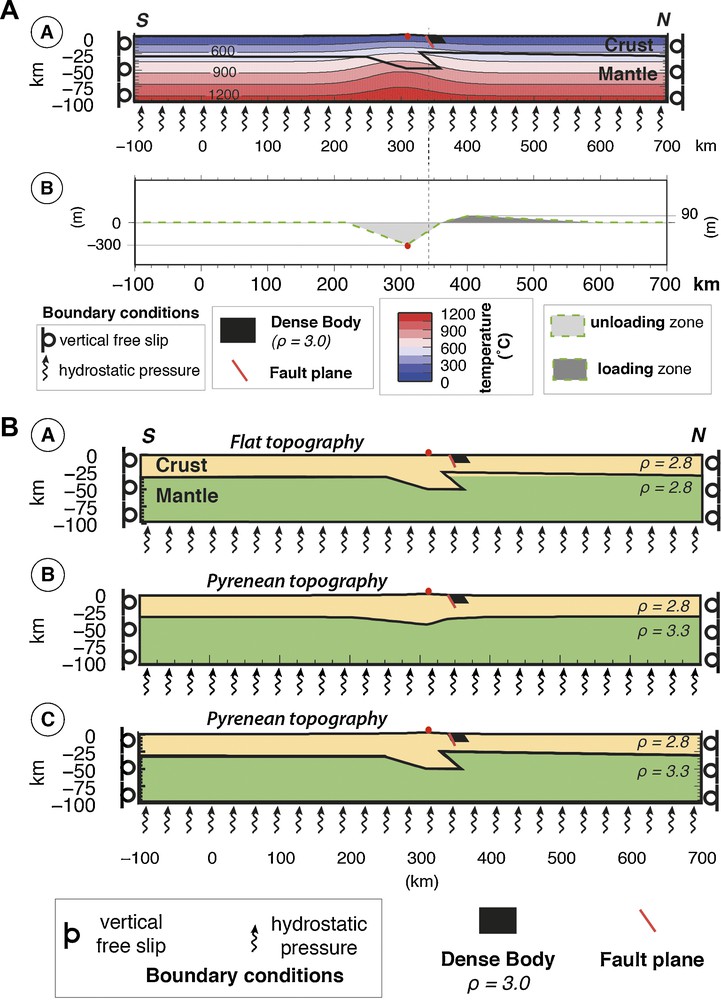
Model setting. A. Thermal field of the models, Moho depth based on the Casas results (Fig. 1C). B. Final denudation and sedimentation quantities for surface process rates applied to the models during the last million years. Horizontal boundary conditions are set to 0 mm/yr, but vertical motions are allowed, hydrostatic pressure is applied at the base of the model. The red point is the reference mark shown in Fig. 1 and used to extract the evolution of the position versus time in Fig. 3.
We divided the lithosphere into two layers: the crust and the upper mantle using the same generic elastoplastic-viscous rheology. Average values of the rheological parameters for the continental lithosphere were used (Supplementary data, Fig. 2bis). Because of the strong dependence of rheology upon temperature, the definition of the temperature field of the model has a large impact on the deformation model (Kirby and Kronenberg, 1987). Based on regional heat flow measurements (Lucazeau and Vasseur, 1989), we chose a temperature field surroundings of the Pyrenees associated with a surface heat flow of 60 mW/m2. We then assumed that the radiogenic heat production of 1 mW/m3 in the thickened Pyrenean crust should lead to a surface heat flow of 80 mW/m2. This heat flow anomaly of the Pyrenean root was modelled by imposing a thermal anomaly located in the crustal root (Fig. 2A). Because of the strong temperature dependence of the viscosity, the lithospheric strength should be weaker below the high topography region than in the foreland (Royden and Leigh, 1993).
2.1 Experiments
The Moho depth of the interpretative cross-section (Fig. 1C) does not compensate for the topography (Fig. 1B). A strong isostatic disequilibrium induces overcompensation in the vicinity of the Northern Pyrenean fault zone. There, a vertical Moho offset of 20 km is associated with a Z-shape feature inducing an overcompensated crustal root. The complexity of the Pyrenean structure makes it difficult to test separately the relative contribution of gravitational potential energy (GPE) and denudation onto the deformation. We anticipate that the non-local compensation of the Pyrenees, revealed by geophysical surveys, may influence GPE-induced deformation. Therefore, we design three geometrical configurations (Supplementary data) in order to decipher the role of the body forces on the present-day Pyrenean strain. After an initial stress building (during which body forces and boundary conditions try to reach an equilibrium, with a friction fault equal to 0.6), an additional loading (dense body and/or surface processes) is applied during 1 Ma and the friction fault is reduced to 0.02 (Table 1).
Experiments’ settings.
| Setting | Geometry | |||
| FLAT | ISO | PYR | ||
| Topography | No | Pyrenean | Pyrenean | |
| Moho geometry | Geophysical (Z-shape) | Compensating topo | Geophysical (Z-shape) | |
| Crust-mantle density contrast | No, same densities of 2800 kg/m3 for the crust and mantle | Yes, crust density = 2800 kg/m3; mantle density = 3300 kg/m3 | Yes, crust density = 2800 kg/m3; mantle density = 3300 kg/m3 | |
| Initial stress building duration | 2 Ma | 2 Ma | 20 Ma | |
| External solicitations | Experiment names | |||
| None | N | FLAT-N | ISO-N | PYR-N |
| Dense body | B | FLAT-B | ISO-B | PYR-B |
| Denudation | D | FLAT-D | ISO-D | PYR-D |
| D + sedimentation | S | FLAT-S | ISO-S | PYR-S |
All experiments (Table 1) are submitted to body forces computed for a gravity value of 10 m/s2. We test the impact of these body forces without external solicitations in models 1, 5, and 9.
2.2 Additional loading
2.2.1 Dense crustal body
Souriau et al. (2014) have pointed out that earthquakes in the Central–Western Pyrenees are mostly located on the southern border of the positive Bouguer anomaly associated with dense bodies. These authors propose that the subsidence of the dense upper crust blocks may induce earthquakes associated with normal faulting. In order to test this mechanism, we define a dense body proposed by Casas et al. (1997) close to the fault zone, and we prescribe a density of 3000 kg/m3 on the block north of the fault plane. The block size is large (10 km deep by 20 km wide, Fig. 2), therefore this density contrast of 200 kg/m3 induces significant initial disequilibrium in the model.
2.3 Surface processes
We apply a denudation rate profile proportional to the Pyrenean topographic elevation (Steer, 2010) and we set for the highest topographic point a denudation rate equal to 0.3 mm/yr. (Fig. 2B). We apply a surface process rate profile to each geometry model. The strain fields of FLAT-D and FLAT-S allow us to study the response to the surface processes without other mechanisms being involved. Elements affected by denudation or sedimentation are submitted to a surface change and are losing or accumulating mass with time. We take into account sedimentation processes following two methods. A first assumption is that sediments are exported far from the range (distal mode). For such a case, the sedimentation rate is set to zero and the mass of the model is continuously decaying (FLAT-, ISO- and PYR-D). We also consider a case for which denudation is balanced by sediments deposited in the foreland. In this case, we distribute the eroded mass of the northern catchment over a sedimentation profile shown in Fig. 2B (FLAT-, ISO- and PYR-S). The maximum sedimentation rate is set to 0.09 mm/yr 90 km north to the mountain crest.
3 Results
Figs. 4–6 show the surface vertical velocities computed at the end of the model runs (upper plots) and the velocities for the cross-section (lower plots).
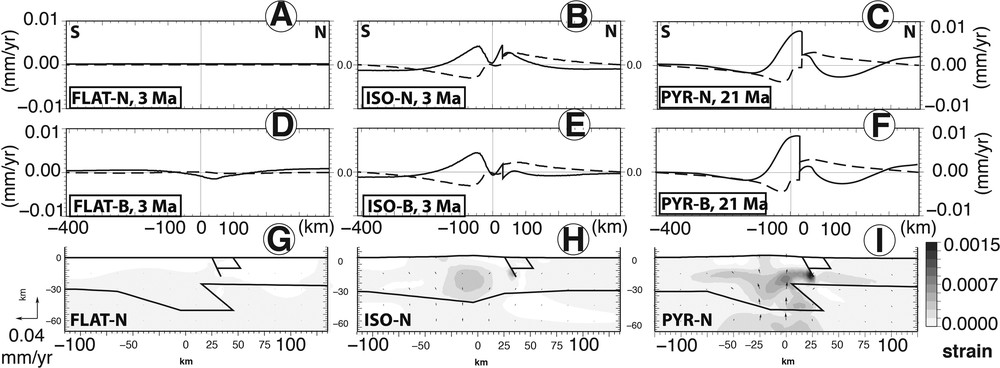
Strain and surface velocities induced by body forces. This figure can be read as a table; each column corresponds to a geometry model, from the left to the right: FLAT, ISO, PYR. The two first rows present final surface velocities profiles: solid and dashed lines correspond respectively to vertical and horizontal velocities. A, B, C. No external solicitation and no dense body (-N). D, E, F. Dense body but no external solicitation (-B). G, H, I. Strain (color palette) and velocity vectors for the experiments with no external solicitation and no dense body.
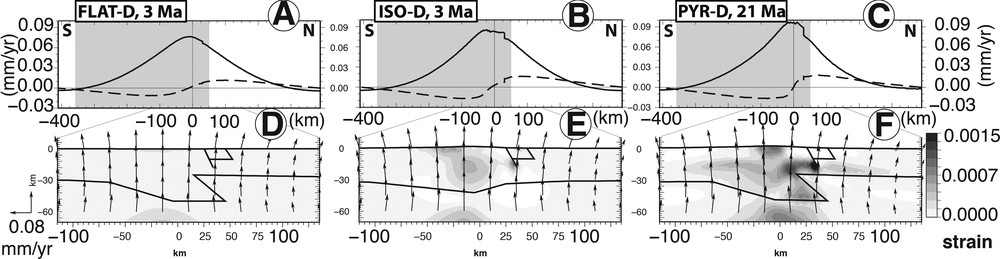
Strain and Surface velocities induced by isotactic rebound due to denudation. This figure can be read as a table, each column corresponds to a geometry model, from the left to the right: FLAT, ISO, PYR. A, B, C. Present final surface velocities profiles: solid and dashed lines correspond respectively to vertical and horizontal velocities due to surface processes, here denudation (-D) applied on the grey zone. D, E, F. Strain (color palette) and velocity vectors.
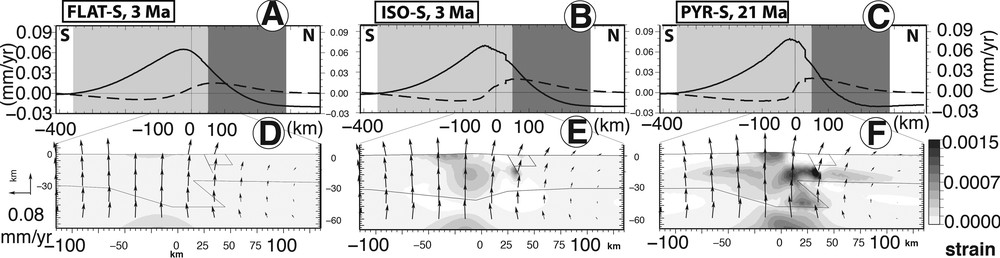
Strain and surface velocities induced by isostatic rebound due to denudation and northern foreland sedimentation. Same description as for Fig. 5. The grey zone delimits denudation and sedimentation; (-S) grey-black sedimentation.
3.1 Time evolution of the models
The upper plots in Fig. 3 present the vertical position change of a reference point located on the crest of the range (the red point in Figs. 1 and 2) versus time. As expected, for the model with a flat topography and no lithospheric density contrast (FLAT-N), the lack of dense body and denudation leads to a quasi-null deformation (Fig. 4G). Indeed, the absence of driving forces induces no significant changes during the whole experiment (flat red curve in Fig. 3A).
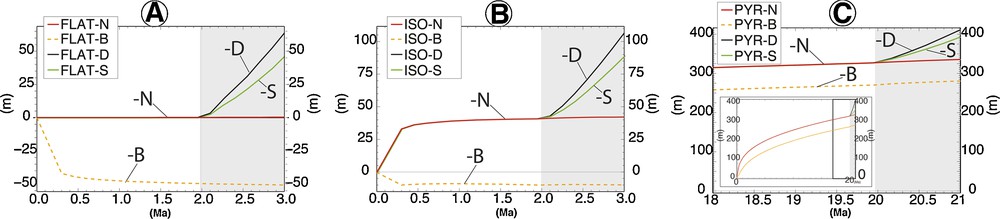
Reference point evolution and vertical surface velocities results for the FLAT model. Reference mark vertical position versus time, grey zone delimits surface processes application. Color curves indicate external solicitations: N = red: no denudation or sedimentation and no dense body; B = orange: dense body with density contrast of 0,2; D = black: denudation, no dense body; S = green: erosion and sedimentation, no dense body. A. FLAT. B. ISO. C. PYR geometries. The inset in (C) shows the total evolution, whereas the global presents the three last Ma.
For the isostatic Pyrenean model (ISO), for which the Moho depth equilibrates topography, the initial equilibrium is not numerically perfect because of a lateral topographic gradient. This induces a slow time-decaying upward motion of the summit point (beginning part of all curves in Fig. 3B). After an initial upward displacement of 40.7 m over the two first million years, the model reaches equilibrium (horizontal part of red curve in Fig. 3B).
For the Pyrenean model (PYR), the displacement of the benchmark on the crest is 140 m upward after 2 Ma (Fig. 3C). After 20 Ma, the model still presents a steady deformation with an upward displacement of 6.2 m/Ma (see inset in Fig. 3C) due to the disequilibrium induced by the crustal root geometry.
The addition of a dense body (-B curves in Fig. 3) leads, for all geometries, to an initial subsidence, which is a transient phase for the re-equilibration of the model. This is shown by the downward displacement during the first ∼0.5 Ma of the FLAT-B and ISO-B; this is also why PYR-B in Fig. 3C is beneath all the other curves. Once the model reaches equilibrium (approximately after 1.5 Ma) this transient deformation stops (e.g., the horizontal part of the FLAT-B curve in Fig. 3A).
We note another general behavior, for all geometries — adding surface processes increases significantly the vertical velocities —; therefore, we observe a roughly 50-m-upward displacement for the crest point. Denudation (with or without sedimentation) induces a steady deformation (linear upward evolution of -D and -S curves in Fig. 3) during the last million years (grey area in Fig. 3) leading to non-decaying vertical velocities.
3.2 Dense body effects
Adding a dense body as suggested by Souriau et al. (2014) induces the same effect on the three different models. A dense body embedded in the upper crust reduces initial displacements (-B curves in Fig. 3). It takes less than a million years for the models to reach an equilibrium corresponding to a stable dense body position. For all models, we observe that the crest point subsides of 40 m (difference between the high -N values compared to low -B values in Fig. 3), even though this point is located 30 km south of the dense body. The dense body creates a downward body force that is converted into a flexural subsidence. This subsidence has a width of 600 km and is centered over the dense body. The initial subsidence at the center is 237 m during the first kyr, but no more significant subsidence related to the dense body occurs after 1 Ma. The final surface velocities of external solicitations N and B differ by only 0.002 mm/yr (Fig. 4). Therefore, we conclude that the transient initial subsidence related to the dense block has no significant impact on the final surface velocities.
3.3 Denudation and sedimentation
The effect of denudation versus model geometries is presented in Fig. 5. The denudation rate profile applied to the models is maximal at the crest point (300 m/Ma) and decreases linearly to 0 m/Ma at the foot of the range (Fig. 2B). Topographic denudation induces a gravity unloading resulting into upward displacements that spread over a wider area than the erosion zone for all the modelled geometries (Fig. 5 upper plots). The highest vertical velocity is associated with the highest denudation rate located on the highest topography. The steady-state velocities (linear upward evolution of the reference point, Fig. 3) induced by denudation are similar for the three model geometries and the maximum vertical values are 76 m/Ma (FLAT-D), 85 m/Ma (ISO-D) and 96 m/Ma (PYR-D). However, surface vertical velocities profiles of PYR-D (Fig. 5C) and PYR-S (Fig. 6C) present a narrower central zone of uplift than the other models. This narrow central zone also displays a steeper central slope in the horizontal velocities profile. Fig. 5 lower plots shows divergent velocities in the upper crust that imply horizontal extension beneath the eroded topography as previously shown by Vernant et al. (2013). Below this extensional zone, the velocity field in the upper mantle displays horizontal compression. As illustrated by the strain pattern, the transition from compression below the crustal root to extension in the upper crust is smooth and widely distributed in the case of the FLAT model (Fig. 5D and strain tensors Fig. 7A) and more concentrated in the crust beneath the range for the ISO model (Fig. 5E), and even more concentrated at depth due to the horizontal density variations of the PYR model (Fig. 5F). Note that this strain concentration is also apparent in the surface horizontal velocity profiles (dashed curve in the upper plots in Fig. 5) and the extensional area is more concentrated in the PYR model (∼150 km wide) than in the FLAT model (∼300 km wide).
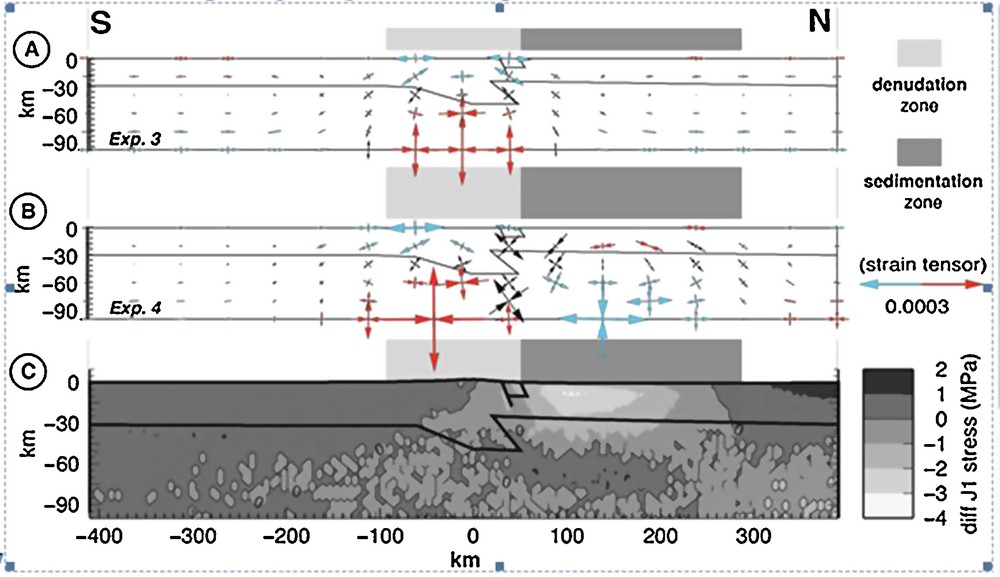
Sedimentation effect. We chose the FLAT model to show the sedimentation impact. A, B. Strain tensor field map for respectively denudation, and sedimentation added to denudation. The red and blue tensors correspond to compressional and extensional deformation. C. Differential stress map for FLAT-D–FLAT-S. Negative values show the compressional zone.
The effect of the deposition of the eroded material in the northern foreland is presented in Fig. 6. Although denudation rates remain the same as for the model involving only denudation, the associated velocity pattern is largely different. The denudation-induced uplift is counterbalanced by subsidence associated with sedimentation. The neutral point (i.e. corresponding to a null vertical velocity) for vertical motion (solid curves in Fig. 6C) is not located at the transition zone between erosion and sedimentation, but about 100 km north of it (i.e. in the northern foothills of the Pyrenees). At this neutral point, we note an important change of the velocity field at a depth associated with a clockwise rotation with a pole located at a depth of 45 km (Fig. 6F). In the strain tensor map (Fig. 7B), this same pole position (at X = 125 km) corresponds to the transition between extension and shortening at a depth of 45 km. Therefore, shortening occurs in the crust and extension develops in the mantle. Uplift rates are slower than those induced by denudation only, with a maximum rate of 80 (PYR-S) instead of 96 m/Ma (PYR-D). This fastest uplifting area is located 25 km south to the highest denudation area. PYR-S maximum subsidence rates reach 20 m/Ma 100 km north of the area where the sedimentation rate is the highest (90 m/Ma). The strain patterns (lower plots of Fig. 6) and strain tensors (Fig. 7B) are similar to those obtained for denudation alone (lower plots of Figs. 5, 7A), but with enhanced strain value. Also, it should be pointed out that the sedimentation enhances significantly the compression in the northern foreland (Fig. 7C).
3.4 Slip rates
Vertical and horizontal surface velocity profiles present a discontinuity 30 km north of the crest (upper plots in Figs. 4–6) due to the 60° north-dipping low friction fault plane included in the models. The slip rates computed for the final time step of the model are given in Table 2. The upward steady deformation observed in ISO-N and PYR-N (Fig. 3) induces a low slip rate on the fault smaller than 6 m/Ma (Table 2, row: N) to add at other cases. When a dense block is added to the upper crust, a low increase in the slip rates occurs with changes of 0.5 m/Ma for ISO-B and 3 m/Ma for PYR-B. Changing the fault plane friction for the last Ma of the experiment induces a slow dense body subsidence. If we allow an initial low friction on the fault plane in the stable model (FLAT-N and -B), no slip is observed after 3 Ma (cases with a star). The highest slip rates are obtained for the models with surface processes. Surprisingly, adding sedimentation in the northern foreland tends to decrease the Northern Pyrenean fault slip rate by about 1 m/Ma.
4 Discussion
Our modeling results show that both initial geometries (FLAT, ISO and PYR) and lithospheric loading (body forces, denudation and sedimentation) have an impact on the long-term strain. We first analyze the evolution of these models at the lithospheric scale in terms of flexural rebound. Then we discuss the relationship between the response of the models and the fault reactivation in the North Pyrenean Zone (NPZ).
4.1 Isostatic rebound and flexural response to body forces and erosion
The initial geometry of a mountain prior to its geological deformation is largely unknown. However, our modelling is restricted here to the post-orogenic evolution of the Pyrenees and we assume that horizontal motions have been slow (a few mm/yr at maximum) during the Quaternary. For this reason we have tested three model geometries that are relatively close to the present-day geometry of the Pyrenean root. For the ISO model a very low gravitational collapse takes place in the model, as attested to by a low vertical rate of –1.3 m/Ma in the central part of the range. In the other case, where the model evolution is only driven by body forces, PYR displays a significant deformation due to its uncompensated topography. First, it induces a steady low uplift across the whole mountain range; the final PYR-N vertical velocities profile (Fig. 4C) shows that this uplift persists during the experiment. Because of its over-thickened crust, this model produces a long-term uplift, the reference point reaching 335 m after 21 Ma. Also, the lateral density variation between the crust and the mantle beneath the NPZ induces strain development in the Pyrenean root (Fig. 4I). Body force effects are much smaller for FLAT and ISO cases. The FLAT geometry is associated with the same crust and mantle density, therefore preventing any differential body forces in the model. In fact, any strain is visible in the final FLAT-N lithospheric cross-section (Fig. 4G), whereas the ISO model displays some strain in the crustal root associated with the long-term equilibration (Fig. 4H). Strain induced only by the body forces is largely geometry dependent and it must be emphasized that the predicted present-day surface motions are very small (< 10 m/Ma). Adding a dense body in the North Pyrenean zone induces a short-term model subsidence due to an initial isostatic disequilibrium. However, this does not significantly modify the pattern of the present-day motions.
Contrary to experiments involving only body forces, denudation and sedimentation induce a flexural pattern shared by all our model geometries FLAT, ISO and PYR. This flexural response occurs on areas much wider than the zones where the surface processes are applied. Upward displacements are due to topography unloading and to its induced flexural response, whereas sedimentation induces downward displacements. The flexural width reaches a maximum value of 600 km when only erosion is applied over a width of 140 km. When sedimentation is applied on the northern side, the flexural width is reduced by 25–30% for the three geometries FLAT, ISO and PYR. Vertical rates of 80–100 m/Ma are associated with a maximum erosion rate of 300 m/Ma in the central part of the range. Considering this erosion rate and a density mantle-crust contrast equal to 0.8 in our models, we can calculate the theoretical unloading local isostatic response. Therefore, our modeled uplift rates (less than 100 m/Ma) are much smaller than the theoretical isostatic predictions of 240 m/Ma. This small uplift rate could be due to the decrease of the erosion profile from its highest point to its lowest point in the foothills. Also, this small and broad uplift rate is likely controlled by crustal and mantle rheology that directly affects effective elastic thickness (Watts and Burov, 2003). In our model, this elastic thickness is controlled by the heat flow chosen for the foreland areas (60 mW/m2) and for the Pyrenean mountains (80 mW/m2).
If we assume that the PYR geometry associated with erosion-sedimentation processes represents a realistic Pyrenean model, then its flexural wavelength and associated uplift could be tested against available data. Despite the lack of synthesis concerning recent flexural motions of the Pyrenees, a few studies allow us to put some bounds on vertical motions. The flexure of the Southern and Northern Pyrenean basins has been studied using topographic and stratigraphic markers along ECORS Pyrenean profile (Desegaulx et al., 1990; Gaspar-Escriban et al., 2001). Although this study refers to syn-orogenic compression, these authors propose an effective elastic thickness of around 17 km and 35 km in the Northern and Southern Pyrenees. Thanks to this flexural calculation, Desegaulx et al. (1990) propose a post-orogenic uplift in the northern central part of ∼3 km, which can be converted into a rate of approximately 150 m/Ma. This uplift rate is consistent with the results of our model, giving ∼100 m/Ma. The isostatic rebound for the Quaternary can be observed thanks to the fluvial terraces in the foreland basins (Bridgland, 2000). The foreland terrace staircase and the river profile of the Garonne and other North Pyrenean rivers indicate that the Northern Pyrenean foreland basin experienced uplift extent over 10 km (Stange et al., 2014). In the Southern Pyrenean foreland, the incision of the Ebro basin due to the lowering of the river base level induced by a general uplift might affect the Segre River Pleistocene terrace staircase (Stange et al., 2013). These suggestions are compatible with the wide isostatic rebound observed in our modelling. However, the end of the uplifted zone is further away than the Pyrenean foreland area. This large width of the uplift profile was already noticed by Vernant et al. (2013). We suspect that this wide flexural response is probably associated with a large (> 40 km) plate elastic thickness. The depth (around 40 km) of the vertical transition between extension and shortening (Fig. 7) gives an idea of the elastic thickness of the plate, which should be noticeably larger than 40 km. In order to understand the relation between topographic uplift and plate bending, it would be useful to compare our uplift profiles with those obtained by a simple elastic plate submitted to the same surface process profile.
4.2 Fault activity
Flexural rebound due to denudation induces fault reactivation with a slip rate reaching ∼13 m/Ma (Table 2). Because the pre-existing weak fault is located in the outer bulge of the flexure, this part of the upper crust is in extension and the fault plane acts as a normal fault. However, it is interesting to note that the position of the fault in our model is close to the piedmont at the transition between denudation and sedimentation, but not at the transition between the upward and downward flexural responses. This is likely to be the place where the denudation's impact is the smallest and therefore the place where slip rates will be relatively small. We have done some supplementary experiments with different fault locations, showing that the fault slip rate increases when the fault plane is located in the inner part of the flexure. For example, ISO-D with an inner fault plane presents a fault slip twice more than in the experiment with a foothill fault plane. Moreover, Table 2 reveals that the initial geometry and the kind of load applied to the lithosphere affect the fault slip rate. For any kind of load, the PYR model displays the largest slip rate. This is likely to be induced by an isostatic disequilibrium torque, due to the over-thickened root to the south and the uplifted mantle. This in turn induces a short central wavelength uplift (∼100 km), as shown by the final surface vertical velocities profiles in Fig. 4C, F and Figs. 5 and 6C. PYR-D and PYR-S surface velocities profiles present the smallest curvature radius and highest slip rates, whereas larger wavelengths present smaller slip rates (FLAT-D and FLAT-S). The curvature radius of the flexural response may be an explanation of the slip rates difference.
Sedimentation decreases the fault slip rates compared to denudation only. It is counterintuitive, since one would expect more normal fault slip when sedimentation is applied on the hanging wall block. Moreover, in models including both denudation and sedimentation, the gradients for the vertical surface velocities are higher than for the models associated with denudation alone. Therefore, the latter models should provide a higher slip rate. Indeed, sedimentation is going to increase the torque creating the flexure. To explore the relationship between sedimentation and fault slip rate, we use the simple model FLAT that provides the same slip rate decrease with respect to sedimentation. We calculate the mean stress change and the deviatoric stress (Fig. 7C) associated with the FLAT geometry with denudation only and with denudation and sedimentation. The downward flexure associated with sedimentation increases by 2.5 MPa the mean stress in the foreland basin (Fig. 7C). This effect spreads 100 km away from the deposition center and remains positive (0.5 MPa) in the fault zone. Therefore, this mean stress change is likely to increase fault normal stress and therefore decrease its slip rate. The mechanism revealed here is similar to those invoked in different contexts for modulating fault activity (e.g., Calais et al., 2010; Hetzel and Hampel, 2005). In addition to denudation and sedimentation, the weight of a dense body may also play a role in fault slip. After a rapid subsidence inducing a wide downward flexure, the dense block reaches its stable location (40 m deeper than its original position). Because crustal viscosity is likely to control block subsidence amplitude and duration, we can conjecture that a lower crustal viscosity beneath the dense block would lead to deeper subsidence. However, the chosen rheology is “freezing” the long-term deformation associated with dense block and is therefore minimizing the present-day deformation. In conclusion, the recent normal faulting-driven mechanism proposed by Souriau et al. (2014) may not be sufficient to explain long-term normal faulting.
Because the convergence associated with the Pyrenees ceased during the Middle Miocene, erosion could have been the main driving mechanism for extension and normal faulting since 20 Ma. Even though this faulting occurs with very low slip rates, this could lead to subtle but detectable scarps in the morphology. For example, Lacan and Ortuño (2012) propose that four N°110°E en-echelon normal fault scarps along the Central–Western Pyrenees accommodate the Axial Zone uplift (Fig. 1). Another example located near Lourdes, at the Pyrenees foothills, is a Quaternary 50-km-long reverse fault scarp proposed by Alasset and Meghraoui, (2005). However, these authors do not provide a seismo-tectonic model to explain this fault activity. In the Central–Western Pyrenees, river profiles, geomorphic markers and seismicity suggest a continuous normal fault activity since the Miocene (Lacan and Ortuño, 2012). In the Maladeta massif located in the Pyrenean Axial Zone, Gutiérrez-Santolalla et al. (2005) have reported recent normal faulting. Furthermore, Ortuño et al. (2008) propose that the Maladeta fault accommodates a differential uplift in the Axial Zone due to body forces. These observations are consistent with our results, suggesting that surface processes may play a primary role for explaining active deformation in the Pyrenees.
The seismicity analysis reveals normal faulting in the Central–Western Pyrenees, but no active structure has been defined yet. Given that our models predict slip rates ranging from 5 to 13 m/Ma, it is tempting to compute the fault slip rate associated with instrumental seismicity. Assuming that these normal faulting focal mechanisms are related to the uplift of the axial zone relative to the northern foreland, we can estimate the slip rate associated with a single fault based on Kostrov formulae (Kostrov, 1974). We use the 3D moments scalar summation of the most active seismic zone in the Central–Western Pyrenees (zone 5 in Rigo et al., 2015, this area is roughly a rectangle extending from W0°3′ to E0°3′ and from N42°40′ to N43°10′). The summation is reported on a single north-dipping east–west fault plane with a dip ranging between 55° to 75°. For this calculation, we sum 69 earthquakes recorded during 31 years in a block corresponding to a surface of 3670 km2 and extending to a depth of 16 km. This block presents a seismic strain tensor with a north–south direction consistent with our model results (Fig. 7 A and B). In this block there are several fault planes with an approximately east–west direction and with different kinematics. The en-echelon normal faulting scarps proposed by Lacan and Ortuño (2012) support the idea that they are the expression in surface of one crustal fault plane. Furthermore, the seismicity distribution at depth seems to outline a north-dipping plan. For the sake of simplicity, we chose to report the displacements induced by earthquakes on a single fault, but the displacement could be reported on several faults. Our summation predicts a slip rate on a single fault between 10 to 20 m/Ma, depending on the dip angle. These rates are consistent with our model results, suggesting that isostatic rebound due to surface processes could induce fault slip rate activity compatible with its present-day seismicity.
5 Conclusions
Thanks to 2D numerical modelling constrained by geophysical data, we have investigated three possible driving mechanisms for activating normal faulting in the Central–Western Pyrenees Zone. We conclude that:
- • the present-day Moho geometry induces a long-term uplift rate of the mountain range and its forelands due to an overcompensation of the crustal root with respect to the present-day topography elevation in the North Pyrenean Zone;
- • the flexural rebound induced by denudation may result into normal fault-plane reactivation at a rate of 5–13 m/Ma;
- • sedimentation in the northern foreland limits the slip rate of the normal fault due to a mean stress increase on the fault plane. This also brings the compression zone closer to the mountain range, which could explain thrusting in Pyrenean foothills;
- • a dense body embedded in the North Pyrenean crust induces significant initial model subsidence effect, but has a minor impact on the long-term fault slip rate;
- • summation of earthquakes moments in this area following Kostrov's method gives a slip rate around 15 m/Ma compatible with our modeled slip rates.
It must be emphasized that our results are associated with a synthetic 2D cross-section that cannot account for the structural variation of the Pyrenean crust from east to west. Although our models FLAT, PYR and ISO do not intend to represent these variations, their comparison reveals the impact of mountain structure on the long-term isostatic rebound. In the future, realistic crustal geometries and inherited structures could be taken into account in a 3D model. With the help of gravity and seismological studies, these models will allow a better understanding of the relation between surface processes and present-day strain pattern and seismicity.
Acknowledgments
This work has been supported by the 2014 ALEA program of INSU-CNRS and Languedoc-Roussillon Regional Authority (“Chercheurs d’avenir”). We want to thank Jean-Daniel Champagnac, Margarete Jadamec, and Marguerite Godard for their thorough and constructive reviews, which helped us to improve this work.