

1 Introduction
The southwest lagoon of New Caledonia is a large semi-open coral reef lagoon. Its southwest facing side is composed of a long, narrow, and shallow barrier reef intersected by several deep reef channels (Fig. 1; reefs are in blue). The eastern side of the lagoon is the shoreline of Grande Terre, the main island of New Caledonia. The lagoon includes several sandy islets that are important seabird-nesting sites and/or are used for recreational purposes due to their proximity to Nouméa, the territory's capital city (Gonson et al., 2016, 2017).
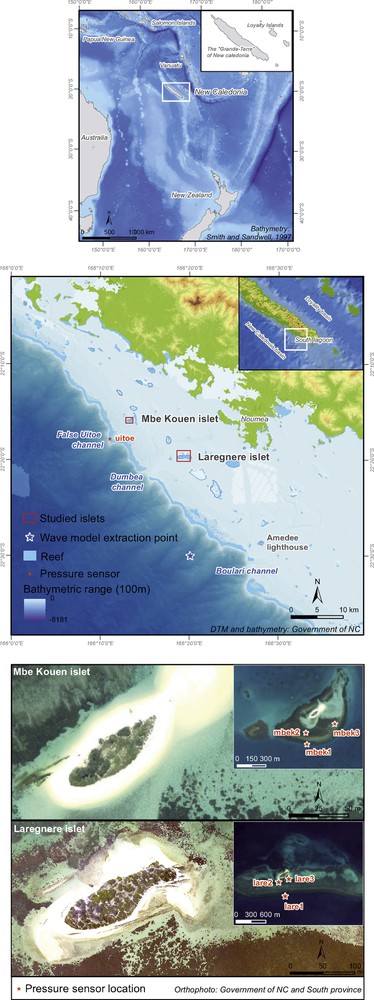
Location map.
Significant geomorphological changes (due to both erosion and accretion) of the lagoon islets have been documented (Garcin et al., 2016). Garcin et al. (2016) hypothesized that the intensity of seas and swell waves on the islets depends on their distance to the channels cutting through the barrier reef. However, no data is available to quantify this relation. In addition, the impacts of waves breaking on the barrier reef are strongly dependent on the tidal level, and it is unclear how these impacts will evolve in the context of global and regional sea level rise.
Our research was designed to identify the physical drivers of the geomorphological changes of 2 sandy islets within the southwest lagoon of New Caledonia (Fig. 1), while quantifying these changes. The work was conducted in the framework of the project “Évolution morphologique des îlots du lagon” (EMIL or Morphological Evolution of the Lagoon Islets), dedicated to providing useful guidelines for the management of the lagoon islets. This lagoon is exposed to both distant swells and locally generated wind seas. The influx of oceanic water due to distant swell waves breaking on the barrier reef was first parametrized by Bonneton et al. (2007), following the Symonds et al. (1995) parametrization, and included in the hydrodynamical model of Douillet et al. (2001) to demonstrate the role of waves on the lagoon circulation (Ouillon et al., 2010). Waves have also been shown to be important drivers of other smaller lagoons around New Caledonia (Chevalier et al., 2015; Locatelli et al., 2017). Yet, except Jouon et al. (2009), who investigated the locally generated wind seas, few studies have focused on the wave conditions within the lagoon, despite the fact that waves, locally or distantly generated, are important drivers of coral reef hydrodynamics (Lowe and Falter, 2015).
In particular, to our knowledge, no studies have so far investigated the amount and role of infragravity waves (period > 30 s) within the New Caledonia southwest lagoon. Infragravity waves are long-period waves associated with wind-generated waves. In the open ocean, infragravity waves can either be bound to wind-generated wave groups (Longuet-Higgins, 1962), or travel freely (Ardhuin et al., 2014; Aucan and Ardhuin, 2013). At the coast, they can either be due to the shoaling of the incoming bound infragravity waves (Longuet-Higgins, 1962), or be generated during the breaking of wind-generated waves (Symonds et al., 1982). Over steep bed slopes, typical of reef environments, breakpoint-generated infragravity waves are dominant (Battjes et al., 2004). Infragravity waves have been shown to be energetic over fringing coral reef platforms (Becker et al., 2016; Cheriton et al., 2016; Péquignet et al., 2009, 2014) or rocky shelves (Winter et al., 2017), but they have rarely been documented within wide lagoons behind a barrier reef (Pomeroy et al., 2012).
This paper presents the preliminary results of field measurements that we have conducted to characterize the wave conditions at two islets. Instruments were deployed during almost one year, to capture the different seasonal wave characteristics. This measurement series represents to date the longest and most comprehensive dataset of wave conditions in the southwest lagoon of New Caledonia. In addition to the wave measurements, we conducted repeated coastal topographic surveys across the islets.
After describing the datasets and methods used, we present and discuss the overall results of our observations. We also identify and analyze two notable and contrasting events to illustrate our results before offering some conclusions.
2 Datasets and methods
We conducted a field experiment between July 2016 and May 2017. We deployed six pressure sensors within the lagoon, three near each one of the islets of interest (Larégnère Islet, hereafter “lare” and Mbe Kouen Islet, hereafter “mbek”; site location on Fig. 1 and instrument depths in Table 1). One pressure sensor was deployed on the reef slope outside the barrier reef (False Uitoe channel, hereafter “uitoe”, Fig. 1). To facilitate the successive deployments and recoveries of the instrument, we chose to locate the uitoe site in a “bay-like” area of the reef, where wave energy is lower due to refraction, and we therefore expect this site to underestimate overall wave conditions on the barrier reef. Each islet lies entirely within the lagoon, and each islet is composed of a forereef, a reef flat and a sandy beach. The lare site is located just inshore of the deep Dumbea passe barrier reef channel (depth > 30 m), while the mbek site sits behind a long uninterrupted stretch of barrier reef. On each one of the islets, one pressure sensor was deployed on the forereef exposed to the trade winds (sites lare1 and mbek1), and two were deployed on the reef flats (sites lare2, lare3, mbek2, and mbek3).
Site depths and positions.
| Site | Location | Depth | Latitude | Longitude |
| mbek1 | Mbe Kouen Islet forereef | 6.4 m | 22.2677S | 166.2214E |
| mbek2 | Mbe Kouen Islet reef flat | 0.79 m | 22.2666S | 166.2213E |
| mbek3 | Mbe Kouen Islet reef flat | 0.55 m | 22.2658S | 166.2242E |
| lare1 | Larégnère Islet forereef | 8.2 m | 22.3311S | 166.3198E |
| lare2 | Larégnère Islet reef flat | 1.1 m | 22.3286S | 166.3185E |
| lare3 | Larégnère Islet reef flat | 1.0 m | 22.3280S | 166.3205E |
| uitoe | False Uitoe Channel, outside barrier reef | 19.2 m | 22.2859S | 166.1832E |
All the instruments sampled the water pressure continuously (no burst sampling), at 1 Hz. From these continuous measurements, we calculated the mean hourly water level, the wave spectra, and the significant wave heights over different frequency bands. The hourly water level observed at the uitoe site, outside the barrier reef, ranges from 0 to 1.71 m (a constant offset was removed so that the lowest water level is zero), and includes astronomical tide and mesoscale variability. To investigate the role of water level, we decomposed this hourly water level time series into five categories, each containing an equal number of samples (Fig. 2c). Water level categories are 0–0.54 m, 0.54–0.75 m, 0.75–0.96 m, 0.96–1.17 m and 1.17–1.71 m. The continuous 1 Hz pressure record was divided into 1-h-long bursts, and each burst was subjected to a Fourier analysis to obtain pressure spectra in the 3–25 s band. A constant atmospheric pressure value was removed to the observed in situ pressure data. The pressure spectra were converted into sea surface elevation spectra using linear wave theory. The 1-Hz record was then divided into 2-h-long segments to obtain spectra in the 25–500 s band (Fig. 3). The spectra of the sea surface elevation were averaged for each category of observed water level (Fig. 3). We chose to display the spectra as [f × S as a function of ln(f)] where S(m2 × Hz−1) is the sea surface elevation spectra at frequency f(Hz), so that the area under each curve is directly proportional to the square of the significant wave height in each band. We then calculated significant wave height [Hsig(m)] for the high-frequency (hf or “swell”), low-frequency (lf or “seas”), and infragravity (IG) frequency bands by integrating these spectra between 0.125 to 0.333 Hz, 0.04 to 0.125 Hz, and 0.002 to 0.04 Hz, respectively (Figs. 4–8). These frequency bands correspond to wave periods bands of 3 to 8 s, 8 to 25 s, and 25 to 500 s, respectively.
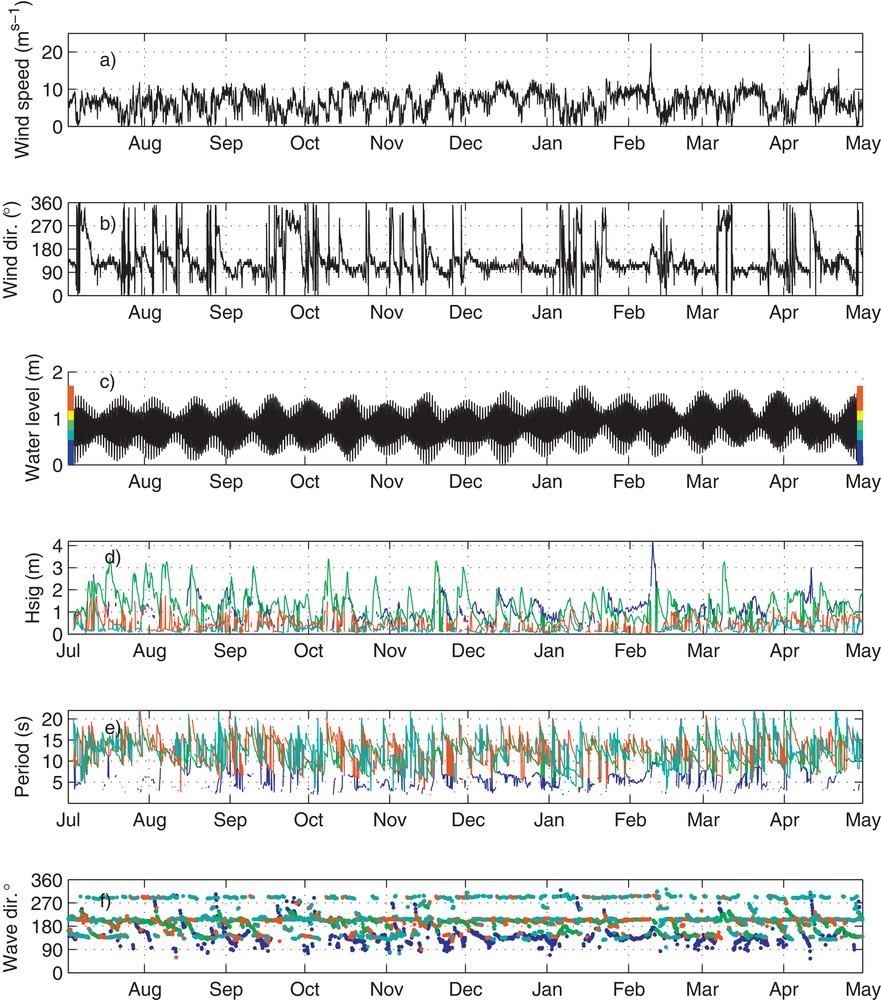
From top to bottom: measured wind speed and wind direction at Amédée Lighthouse, measured tidal level at offshore station Uitoe (colors on the axes indicate the different water level categories used throughout the paper: 0–0.54 m, 0.54–0.75 m, 0.75–0.96 m, 0.96–1.17 m and 1.17–1.71 m), modeled significant wave heights, periods and directions of main sea and swell components from a regional wave model at a point 2 nautical miles offshore of the reef's edge, at a water depth of 900 m. The colors in the three bottom panels indicate different wave partitions.
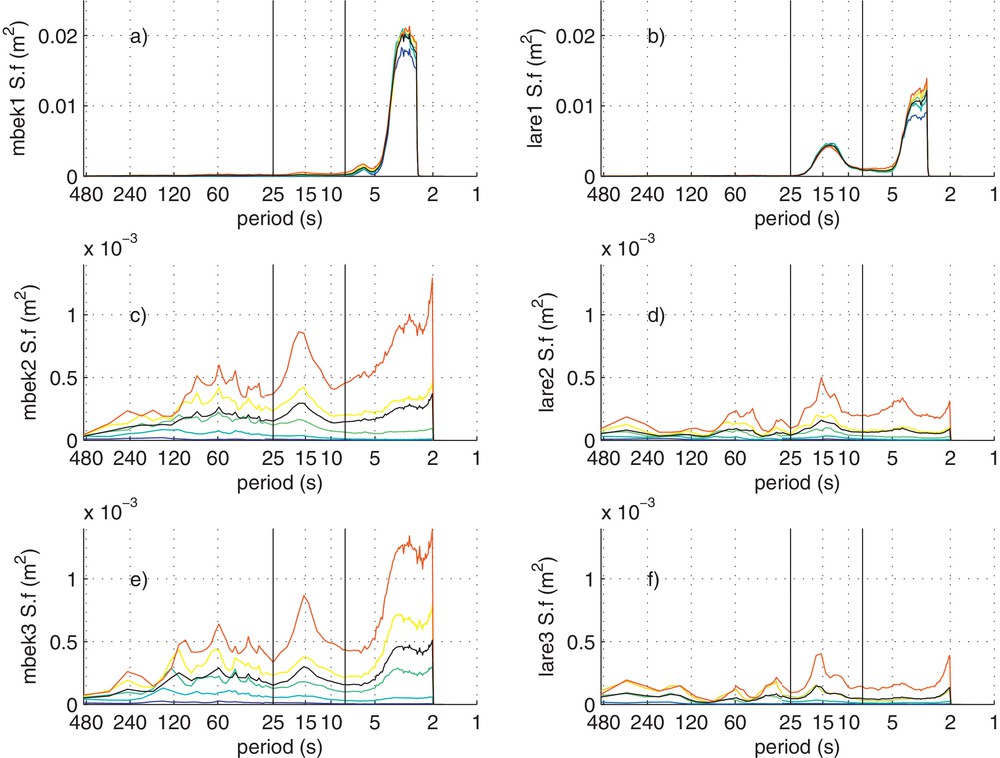
Sea surface elevation averaged spectra, at the mbek sites (left) and lare sites (right), plotted so that the areas under the curves represent the wave height in each band. The colors indicate the tidal height level used to group the spectra before averaging (from highest water level in red to lowest in blue, as on Fig. 2). The black curves are the overall average. The vertical lines remark the different frequency/period domains (high-frequency, low-frequency, and infragravity bands).

Daily maximum of wave height time series, for the high-frequency (blue), low-frequency (green) and infragravity bands (red), at the mbek sites (left) and lare sites (right).

Top: low-frequency significant wave height at mbek1 (left) and lare1 (right), as a function of low-frequency significant wave height at uitoe. The colors indicate the tidal height level (from highest in red to lowest in blue). Bottom: ratio of low-frequency significant wave height at mbek1 (left) and lare1 (right) over low-frequency significant wave height at uitoe as a function of water level. The colors indicate water level categories as on Fig. 2.
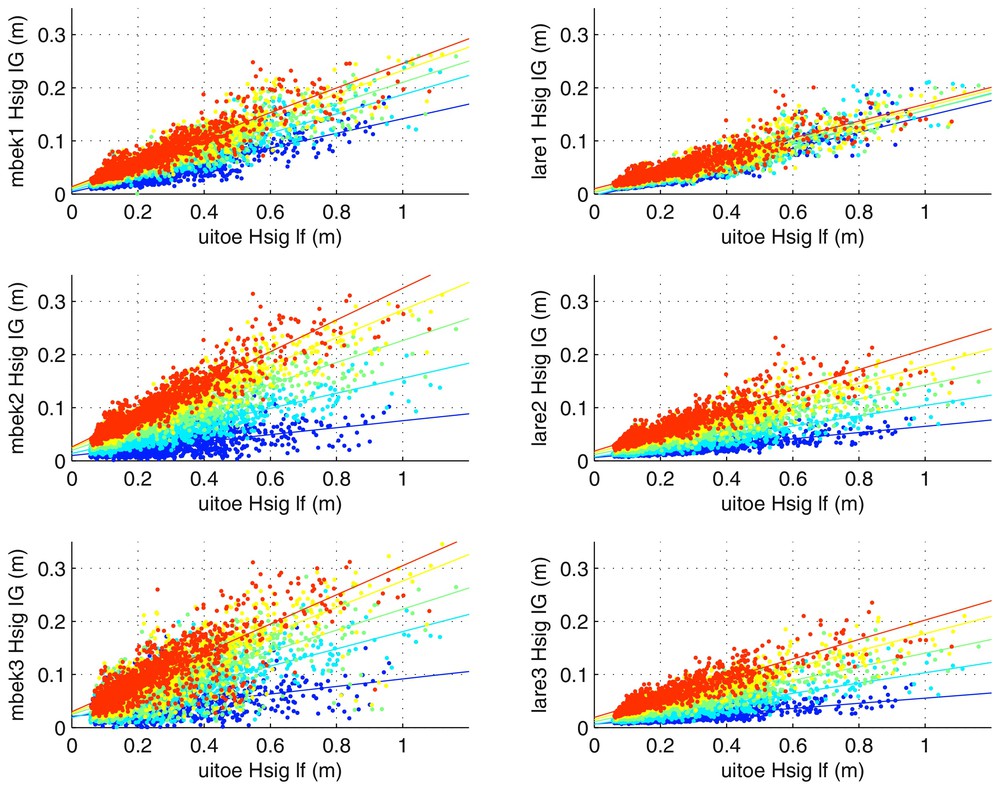
Infragravity wave heights at the mbek sites (left) and lare sites (right) as a function of low-frequency wave heights measured outside the barrier reef at the uitoe site.
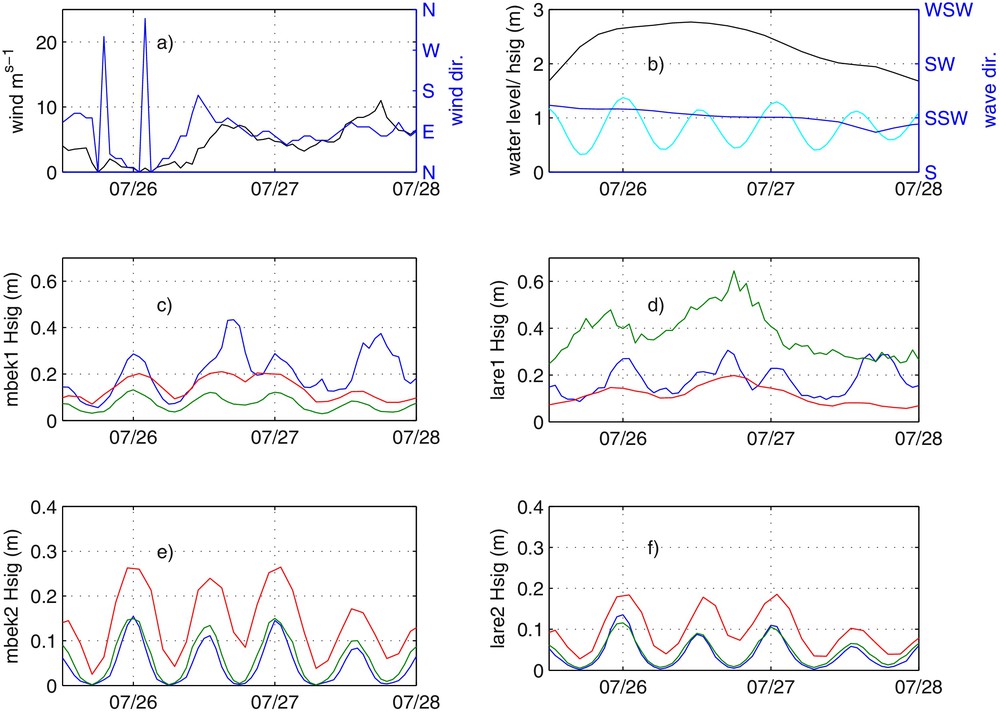
Top panels, right, hourly-averaged wind speed and direction at Amédée Lighthouse, and left, modeled offshore wave height (black) and direction (blue), and observed water level (cyan). Middle and bottom panels, time series, for the high-frequency (blue), low-frequency (green), and infragravity bands (red), at the mbek sites (left) and lare sites (right).

Top panels, right, hourly-averaged wind speed and direction at Amédée Lighthouse, and left, modeled offshore wave height (black) and direction (blue), and observed water level (cyan). Middle and bottom panels, time series, for the high-frequency (blue), low-frequency (green), and infragravity bands (red), at the mbek sites (left) and lare sites (right).
Wind data was obtained from the Météo France station at the Amédée Lighthouse (Fig. 2a, b). In the absence of any deep water in situ wave measurements, complete offshore sea and swell conditions were obtained from the Previmer regional implementation of the WaveWatch III wave model, forced by winds from the European Centre for Medium-Range Weather Forecasts (ECMWF), and extracted at a nearby point (22.5S, 166.33E), 2 nautical miles from the reef's edge, at a water depth of 900 m. To properly represent the multi-modal nature of the sea and swell conditions, the first four partitions of the sea state are extracted (Fig. 2d–f).
In addition to hydro-meteorological data, topographic data were acquired by Differential Global Positioning System (DGPS), for accurate centimeter positioning, by the “Direction du foncier et de l’aménagement” (South Province, New Caledonia) on the Larégnère islet at three dates: 18 March 2016, 25 October 2016, and 13 April 2017 (Fig. 9). Topographic measurements were carried out every 10 m where possible, being restricted by the tidal range. The measurements margin of error is estimated at 0.03 m (Fig. 9). Topographic measurements were also collected by the rangers of the South Province along two Larégnère beach profiles, using the Emery board technique, on five successive dates during the investigation period (Fig. 10). The resulting points generated three Digital Elevation Models (DEMs), with a spatial resolution of 5 m, which can be used to evaluate gains or losses of sediment during the austral winter 2016 (March/October 2016), and during the austral summer (October 2016/April 2017).

Changes in elevation from Digital Terrain Models (DTMs) of the Larégnère (lare) islet between March and October 2016 (top), and between October 2016 and April 2017 (bottom).

Beach profiles on the Larégnère (lare) islet, see Fig. 9 for profiles locations. Altitude is with respect to the New Caledonia Geodetic Zero (NGNC).
3 Results and discussion
3.1 Wind and offshore wave conditions
The area is mainly subject to trade winds throughout the year. Wind speed varies most of the time between 5 and 10 m·s−1, with a mean of 6.6 m·s−1, and a pronounced diurnal cycle (with a mean of 5.9 m·s−1 at 5 am and a mean of 7.5 m·s−1 at 5 pm). Wind direction is predominantly from the southeast throughout the year (62% of the time between 90 and 180 with a mean of 135), with occasional events from the southwest (Fig. 2a, b). Two different tropical depressions affected the area during the data collection period: an unnamed tropical storm around 9 February 2017 produced strong southerly winds (up to 22 m·s−1 hourly-averaged wind speed) and Tropical Cyclone Cook on 10 April 2017, produced strong easterly winds (up to 22 m·s−1 hourly-averaged wind speed).
Offshore wave conditions are a mix of distant swell and locally generated seas (Fig. 2d–f). Long-period swells generated by extratropical storms in the Tasman Sea impact the study site from ∼ 205 (Fig. 2f). Throughout the period, there were several high southwesterly long-period swells larger than 3 m, and they are expected to be more frequent during the Southern Hemisphere winter. Locally generated shorter period seas impact the study site from 150 (Fig. 2f). Some additional energy is noticeable from 290 (Fig. 2f) and is attributed to swells generated in the northern hemisphere that propagated along the SW coast of the New Caledonia mainland. The maximum modeled wave heights attained during the field collection was 4.2 m (during the 9 February 2017 storm), and the mean wave height during the entire period is 1.6 m (Fig. 2d).
3.2 High-frequency/short-period waves (3–8 s)
The high-frequency waves (3–8 s period), corresponding to locally wind-generated waves, are dominant at the forereef sites lare1 and mbek1, with a peak around 3–4 s (Fig. 3a, b). These high-frequency waves can be attributed directly to the prevailing southeast winds. Indeed, during these southeast winds conditions, the correlation between hourly wind speeds and high-frequency waves at the forereef sites lare1 and mbek1 is 0.80 and 0.82, respectively (with no lag). At these exposed sites, the high-frequency waves undergo little variability with the tide (Fig. 3a, b). On the contrary, on the reef flats (sites lare2, lare3, mbek2 and mbek3), where the water depth is shallower, the high-frequency energy is strongly affected by the tide (Fig. 3c–f). We observe a higher energy level for high-frequency waves at all the mbek sites (Fig. 3a, c, e) compared to the lare sites (Fig. 3b, d, f). We attribute this difference to other nearby islets, that provide a lesser sheltering from the predominant southeast trade winds seas at the mbek sites compared to the lare sites (Fig. 1). On the mbek and lare sites, the highest waves we measured were during the unnamed tropical storm in February 2017.
3.3 Low-frequency/long-period waves (8–25 s)
For the low-frequency waves (8 to 25 s period), which correspond typically to distantly generated southwest swells hitting the barrier reef, a peak at ∼ 15 s is identified at all sites (Fig. 3). On average, the energy in this 15 s peak is substantially higher at the lare1 forereef site (Fig. 3b) compared to the mbek1 forereef site (Fig. 3a). Furthermore, the low-frequency waves are strongly modulated by the tide at the mbek1 site, while no tidal modulation is observed at the lare1 site. We calculated the transmission of low-frequency waves between the offshore uitoe site and the lare1 and mbek1 sites (Fig. 5c, d). The low-frequency waves at the lare1 site are highly correlated (0.94) with the low-frequency waves at the uitoe site, regardless of the water level, and the transmission coefficient between uitoe and lare1 is constant with the water level of 0.6 (Fig. 5d). At the mbek1 site, the transmission coefficient is highly dependent on the water level (Fig. 5a, c), and low-frequency waves at the mbek1 site are highly correlated with the low-frequency waves at the uitoe site, only when the correlation is calculated within each water level category (correlation between 0.79 and 0.89). This indicates that the low-frequency waves that impact the barrier reef can travel directly to the lare site through the barrier reef channel. Conversely, to reach the mbek1 site, the low-frequency waves first need to cross the barrier reef where they undergo dissipation through depth-induced breaking and bottom friction. These phenomena are furthermore dependent on the tidal level. These observations are consistent with those of Garcin et al. (2016) that the islet's wave exposure is dependent on the islet position relative to a nearby barrier reef channel. However, the low-frequency energy on the reef flat at mbek2 and mbek3 is higher than at lare2 and lare3 (Fig. 3c–f). This indicates that the islet reef flat morphology controls the amount of low-frequency wave energy that eventually reaches the islet's sandy beach. At all the reef flats sites (lare2, lare3, mbek2 and mbek3), the low-frequency waves are strongly modulated by the tide (Fig. 3c–f), consistently with their attenuation through depth-induced breaking and friction on the reef flat.
3.4 Infragravity waves (24–500 s)
Infragravity waves (25 to 500 s) are associated with the shoaling and/or breaking of the high and/or the low-frequency waves described above (Battjes et al., 2004). At the target islet sites, infragravity waves might be generated by:
- • offshore waves breaking on the barrier reef that then propagate within the lagoon to the islet;
- • waves within the lagoon, breaking on the islet forereef and reef flat.
On both islets, the infragravity wave heights are comparable at the forereef sites (lare1 and mbek1) and at the reef flat sites (Figs. 3 and 4). Infragravity waves heights on reef flat are uncorrelated with the high-frequency lagoon waves heights measured on the islet forereefs (< 0.2 for all sites and all water levels), but they are correlated with low-frequency waves measured outside the barrier reef at the uitoe site (Fig. 6). This suggests that the origin of the infragravity waves measured around the islets is the breaking of low-frequency waves on the barrier reef. While we cannot separate classes of standing/propagating infragravity waves as was done by Gawehn et al. (2016) and Locatelli et al. (2017), we infer that the infragravity waves propagated to the islets from the barrier reef where they were generated. At the reef flat sites (sites lare2, lare3, mbek2 and mbek3), infragravity waves carry amounts of energy comparable to those carried by high- and low-frequency waves (Figs. 3 and 4). Therefore, they may play a role in shoreline changes comparable to those of the high and low-frequency waves discussed above.
4 Notable events
4.1 SSW swell event
Around 26 July 2016, the wave model predicted that the sites were impacted by a long-period (15 s) swell coming from the SSW, with heights around 3 m (Fig. 7b). This type of event is typical during the austral winter. During this event, the low-frequency waves dominate at the lare1 site in front of the reef channel, and are correlated to the offshore wave height, with little influence from the water level (Fig. 7d). At the mbek1 site (Fig. 7c), the low-frequency waves are lower than at the lare1 site, and are strongly correlated with the water level. Near the peak of the event in the afternoon of 26 July, we observe a corresponding peak of high-frequency waves at mbek1 occurring even when the tidal level was low (Fig. 7c). The origin of these high-frequency waves could be the secondary bores generated by the low-frequency waves breaking on the barrier reef, as observed previously on this site by Bonneton et al. (2007), or on a barred beach by Masselink (1998). These undulatory high-frequency bores could then propagate into the lagoon to the islet. On the reef flat at both sites, infragravity waves are the dominant signal during the events (lower panels on Fig. 7e, f), and all wave components are strongly modulated by the tide.
Therefore, during these types of SSW swell events, the dominant wave forcing on the islet seems to be a combination of infragravity and low-frequency waves. Low-frequency waves originate far offshore under a storm, then, propagate in the open ocean to the island's main barrier reef. On the barrier reef, they partially break and propagate over the barrier reef into the lagoon, or penetrate directly through a reef channel. During the breaking of the low-frequency waves, infragravity waves are also generated and can then travel freely through the lagoon. Near the islets, waves undergo additional attenuation over the islet's reef flat, before reaching the sandy beach.
4.2 Strong wind event
Around 9 February 2017, New Caledonia was under the influence of an unnamed tropical storm located east of the Mainland. As a result, the two target sites experienced strong south to SSE winds (Fig. 8a). The wave model predicted significant wave height offshore larger than 4 m with periods of ∼ 10 s, originating from the SSE (for a point located two nautical miles offshore of the reef's edge, at a water depth of 900 m, Fig. 1). Given the island configuration that stretches southeast to northwest (Fig. 1), the waves propagated parallel to the island and barrier reef, in effect producing a lesser amount of energy directly incident on the barrier reef. This might explain the relative absence of low-frequency waves at the sites.
During this strong wind event, energetic high-frequency waves at both forereef sites were observed (Fig. 8c, d), and the absence of any visual modulation of these waves by the water level indicate that they were most likely generated locally within the lagoon fetch. On the reef flat sites, high-frequency waves were the dominant signal (Fig. 8e, f), and all waves components were strongly modulated by the tide. Therefore, for these types of strong southeast wind events, the dominant forcing on the islet is the high-frequency waves generated by the wind within the lagoon, undergoing attenuation on the reef flat through depth-induced breaking and friction. During these strong southeast wind events, the relative amount of infragravity wave energy is much smaller that during swell events.
5 Morphological changes of the islets
Differential DTMs (Fig. 9) between March and October 2016 (austral winter) and between October 2016 and April 2017 (austral summer), and the time series of topographic beach profiles (Fig. 10) reveal a mobility and a seasonal variability of the eastern and western sectors (sectors S1, S2 and S3) of the Larégnère (lare) islet. A loss of sedimentary material is observed during the austral winter in sectors S1 and S3. The reverse trend is observed during the austral summer, with an accumulation of sand in the same two sectors. Sector S2 shows an opposite evolution: sediment accretion is observed in the winter and erosion in the summer. The sedimentary budget for the period from March 2016 to April 2017 is in equilibrium on the three sectors.
The topographic beach profile P4, located on sector S2 (Fig. 10), shows a recess of the permanent vegetation line (PVL) in summer and its advance in winter. This attests to the seasonal variability of this sector. The exposure of the beach to southwest low-frequency swells, more frequent during the austral winter, may explain the erosive mechanisms observed during this season in sectors S1, and S3. Sector S2 is more exposed to the high-frequency waves generated within the lagoon and attributed to southeast trade winds. The influence on sector S2 of the 9 February storm, characterized by south to SSE winds, can be seen in profile P4 (Fig. 10), in the form of an erosion scarp of about 40 cm high at the permanent vegetation line.
Unfortunately, the wave instruments were not ideally located to directly measure the waves on that area of the islet. The future installation of instruments on the northeast and northwest corners of the islet would make it possible to better identify and characterize the processes acting on geomorphological and coastlines evolutions of these three sectors of the islet (Fig. 1).
The sector S4, located on the SE corner of the islet, proves to be affected throughout the year by active erosion. On the beach profiles P1-b measured between April 2016 and July 2017 (Fig. 10), an erosion scarp located at the upper limit of the foreshore, and having a mean height of more than one meter, attests to this continuous erosion. The dynamic on this sector is not detectable on differential DTMs because of their insufficient resolution (5 m) (Fig. 9). This sector S4 is exposed to trade winds (direction southeast) throughout the year and more occasionally to austral swells (direction southwest), but we cannot conclude which wave pattern is responsible for the observed erosion. Given our limited timespan of data (∼ 1 yr), we cannot conclude either on whether the erosion pattern is due to the internal variation of the austral swells (Hemer et al., 2010).
6 Conclusion
The data collected in the southwest lagoon of New Caledonia allowed us to identify and characterize the main wave components that impact the Larégnère and Mbe Kouen islets within the lagoon and drive their topographic and geomorphological changes. The waves in this lagoon are low-frequency swell waves (8–25 s) generated offshore, originating from the SSW, and then impacting the barrier reef, and high-frequency seas (3–8 s), generated within the lagoon by the prevailing southeast trade winds. We show that the Larégnère (lare) islet, located near a deep channel across the barrier reef, directly receives low-frequency wave energy through that channel, regardless of the tidal level. In contrast, the Mbe Kouen (mbek) islet, protected by the barrier reef, is impacted by the low-frequency waves only after their breaking and propagation across the barrier reef, with a strong modulation by the tidal water level. On both islets, and for high- and low-frequency waves, the amount of energy that ultimately reaches the islet's sandy beach is then dependent on secondary depth-induced breaking and dissipation on the islet's reef flat. As a result, the amount of wave energy available for islet morphological changes depends not only on the islet position relative to the barrier reef and on the water level, but also on the size and depth of its surrounding reef flat.
We also provide here the first evidence of the significant contribution of infragravity waves (25–500 s) in the southwestern lagoon of New Caledonia and on its islets within. We show that these infragravity waves are ubiquitous within the lagoon and can be as energetic as high- and low-frequency waves on the islet's reef flat. Our data suggest that these infragravity waves originate when the low-frequency swell waves break on the barrier reef, and they can then propagate freely within the lagoon. Our results thus show that infragravity waves will need to be considered, together with low-frequency swell waves and high-frequency seas, in further studies examining the factors of the islet morphological changes.
Topographic surveys have shown geomorphological changes at the islets, with some areas showing seasonal mobility and others exposed to longer-term accretion or erosion patterns. So far, we have not been able to link these patterns directly to the action of the different wave types. Improved positioning of wave instruments and additional topographic data will allow us in the future to describe the link and study longer-term patterns in geomorphological evolution.
Acknowledgements
The “Évolution morphologique des îlots du lagon” (EMIL or Morphological Evolution of the Lagoon Islets) project was funded in part by a grant from the French Ministry for Overseas Territories. Additional instruments were provided by the Reeftemps network project (http://www.observatoire-gops.org/fr/reeftemps1) The data collection was made possible by the captain of the IRD coastal vessel “Archamia”, the staff from the technical unit IMAGO, and the divers of the IRD service for underwater operations (SEOH). The topographic data ware acquired by the technical services of South Province. We thank the editors (Isabelle Manighetti and Rutger De Wit) and three anonymous reviewers who greatly contributed to improve the clarity of the manuscript.