

1 Introduction
Monitoring shoreline evolution is essential to understand and anticipate coastal risks under global change (climate and human-induced stresses) (Howard and Birkemeier, 1987; Lee and Birkemeier, 1993; Rieb and Walker, 2001; Ruggiero et al., 2000). Uncertainties are high concerning the future coastal trajectories in tropical regions in response to the effects of global change, including rise in ocean temperatures and sea levels, potential increases of storm frequency and intensity, growth of human pressure, and decline of coral reefs in response to ocean acidification and pollution (IPCC, 2014).
In this context, continuous, long-lasting scientific surveys provide critical information to support decision-making and coastal planning (Leatherman, 2003; Louisse and Van der Meulen, 1991; Solomon and Forbes, 1999). Among the coastal features significantly impacted by the global change, broad sense, is their morphology. This includes their topography and bathymetry, the extent or retreat of the shoreline, the modification of the hydrography and vegetation cover, etc. We focus here of this issue, i.e. the morphological changes of the coastal areas. Coastal sites where geomorphological data have been acquired regularly and repeatedly over long periods of time, i.e. decades (e.g., Masselink et al., 2016), remain rare; shoreline surveys are more commonly conducted over the few years’ time of a specific project (Duvat et al., 2016; Okal et al., 2006). In this context, the development of coastal observatories would provide an appropriate structured framework to sustain long-term monitoring and data acquisition (Suanez et al., 2012). Such observatories would offer the opportunity to identify and quantify the variety of processes that occur at different spatial and temporal scales in the coastal area. In particular, they would allow monitoring morphological parameters such as beach topographic profiles and shoreline proxies, which are key parameters to assess the shoreface and the shoreline variability. As a first step, these observatories would aim to provide a synoptic view of the coastal processes by focusing efforts on small areas chosen as pilot sites representing well the behaviour of a larger zone. The monitoring would operate through the acquisition of high resolution, interoperable, repeatable, and low-cost data (Larson and Kraus, 1994).
In La Reunion Island, a French overseas department in the Indian Ocean, morphological surveys have been carried out since 2012 on the back-reef beach of the Ermitage site (21° 06′S, 55° 14′E). Ermitage is one of the rare sites on carbonate beaches which has been continuously monitored to study the coastline dynamics (mainly through the French National Observation Service DYNALIT; http://www.dynalit.fr). For this reason, it is a reference site for the Indian Ocean Commission (IOC).
In tropical environments, carbonate beaches are fronted by coral reefs, which are an integral part of a hydro-sedimentary littoral cell in that their state and function act as boundary conditions for back-reef shoreline response (Kench, 2011). The architectural complexity of reef systems leads to specific physical driving factors and shoreline evolution mechanisms that differ significantly from those in temperate environments. These specificities of the reef systems and of their back-reef beaches call for the need for specific studies to better understand their evolution, in particular their morphological evolution. The latter can be described and quantified using topographic data. We discuss here which type of data would be more appropriate.
More precisely, we aim to provide a methodological framework for setting up a coastal observatory of shoreline dynamics in back-reef carbonate beaches, using very high spatial resolution and low-cost methods. We start synthesizing the hydro-morpho-sedimentary characteristics of back-reef carbonate beaches that, thus, need to be monitored. Then, we describe the methodologies a permanent observatory should use to acquire the topographic data, which are key to quantify the above characteristics. All the techniques we present here have been tested and validated on the pilot site of Ermitage in La Reunion Island (Fig. 1). Finally, we discuss how complementary shallow bathymetric data could be acquired to provide an integrated monitoring of the beach and the nearshore system.
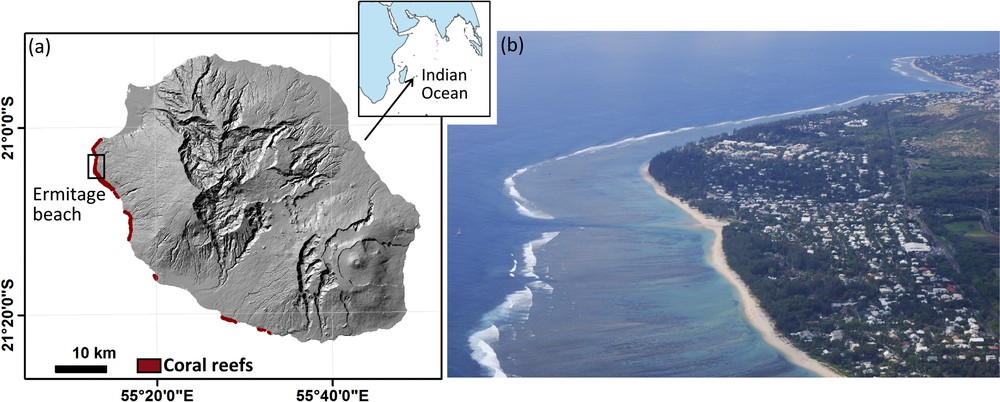
Location map of the study area: a: Ermitage beach on Reunion Island; b: Aerial view illustrating fringing coral reef, carbonate beach and back-beach situation (photo courtesy: Anne Lemahieu).
2 Hydrodynamic and morphodynamic conditions in back-reef zones and carbonate beaches
When considering the hydrodynamics and morphodynamics of back-reef beach systems, one must consider many specificities associated with forcing arising both from the tropical ocean–atmosphere system and from the reef setting (Kench, 2011). The physical factors driving beach dynamics can indeed be divided into factors that occur at a regional scale and those that apply at the reef scale. At a regional scale, back-reef beach dynamics can result from episodic, seasonal or cyclic climatic phenomena that induce variations in primary driving phenomena (i.e. wind and wave magnitude and direction) (Flood, 1986). In tropical settings, episodic events are commonly large swell events associated with tropical cyclones (Mahabot et al., 2017; Maragos et al., 1973; McIntire and Walker, 1964; Ogg and Koslow, 1978; Risk et al., 2007; Woodroffe, 1983) and/or long-period swells originating from extra-tropical depressions (Cooper et al., 2013; Hoeke et al., 2013; Rooney and Fletcher, 2005), or, more rarely, generated by tsunamis (Kench et al., 2006b; Okal et al., 2006; Vitousek, 1963). All these phenomena can cause substantial damage to coral reefs and induce significant geomorphic changes of the beaches. The effect of cyclic phenomena such as PDO (Pacific Decadal Oscillation) and ENSO (El Nino Southern Oscillation) on beach dynamics in the Pacific Ocean has been noted (Solomon and Forbes, 1999). In the Indian Ocean, the seasonal inversion of monsoon winds in the tropical zone has been shown responsible for beach rotation in Mayotte (Jeanson et al., 2013) and reef island shape adjustment in the Maldives (Kench and Brander, 2006).
At the reef scale, hydrodynamic forcing differs from the situation in open ocean because it is dominated by the interaction of waves, tides and winds with the complex reef platform architecture (see Lowe and Falter, 2015 for a review). The relative importance of each factor varies greatly from one reef to another in relation to local and regional characteristics such as tidal range, wind regime or regional currents, and depending on the reef type and geometry (fringing, barrier, atoll and variants). Overall, hydrodynamic conditions inside the back-reef zone can be summarized as follows:
- • water circulation inside the reef zone is mainly driven by wave-breaking. The rapid decrease of water depth at the fore-reef forces the shoaling and breaking of the offshore waves that approach the reef. The resulting wave setup drives the overall water circulation (Monismith, 2007);
- • the reef acts as a buffer zone of the wave energy. The whole reef reduces the incoming wave energy by 97% on average, and the wave height by about 84% (Ferrario et al., 2014). Such attenuation is due to the wave shoaling and breaking and to the turbulence resulting in the surf zone, and is furthermore enhanced by the bottom roughness over the reef crest and the reef flat;
- • infragravity waves (lower-frequency and longer-period than other common waves) generated at breaking points onto the reef become dominant as waves propagate towards the beach (Cheriton et al., 2016).
The energy induced by the wave transformation over the reef is responsible for significant geomorphic changes in the sedimentary landform (Kench et al., 2006a). However, it is not clear yet how the waves interact with the beach foreshore. Cheriton et al. (2016) have highlighted the importance of infragravity waves and of their resonance on the process of wave run-up on the beach face.
Another specificity in coral reef settings is that biological and human factors can also directly or indirectly control the hydro-sedimentary processes that impact the beach dynamics (Kench, 2011). The coral reef is the one to provide the sediment supply that forms and shapes the sedimentary landforms such as beaches and reef islands. The efficiency of a coral reef to attenuate the wave energy depends on the coral reef cover, more specifically of its roughness (Alvarez-Filip et al., 2009); the higher that roughness, the more efficient is the reef to act as a protective buffer zone. Thus, any phenomenon impacting the health state of a coral reef can compromise its protective capacities (Sheppard et al., 2005). These phenomena can be natural or human-induced; they include rises in sea temperatures and CO2 concentrations, pollution, anthropization, etc. According to the last report on the global status of coral reefs worldwide, 15% are seriously threatened with their possible loss within the next 10 to 20 years, and 20% are under threat of loss in the 20 to 40 next years (Wilkinson, 2008). This global decline in coral reef health threatens the back-reef beach persistence.
3 Available shoreline monitoring in back-reef context
There exist few available studies that document the state or evolution of back-reef beaches worldwide. One reason is that these back-reef beaches occur in a wide range of geomorphological settings due to the different fronted reef types (i.e. fringing, barrier and atoll) and sedimentary landforms. Two principal configurations dominate however. The first consists of small, sandy, low-lying islands (< 5 m elevation) of variable shape commonly found in mid-ocean atolls (Stoddart and Steers, 1977). The second consists of linear beaches backed by rocky coast associated with high volcanic islands or continental margin (Forbes et al., 2013). This is the case of La Reunion Island (Fig. 1). Reef islands in the first configuration have attracted the attention of the scientific community for their vulnerability to sea-level rise (Leatherman and Beller-Simms, 1997; Woodroffe, 2008). By contrast, studies on linear beaches remain very few.
The few available studies have commonly analysed the beach response with two main approaches: (i) quantifying the morphological adjustment of the beach at a very short time scale, almost instantaneous, as that concerned with paroxysmal seasonal events; or (ii) analysing the shoreline changes at a long-term scale encompassing a few years to a few decades (from five to fifty years). Short-term morphological surveys have enabled the analysis of the immediate beach response to the impact of a large swell consecutive to a tropical cyclone (Duvat et al., 2016; Mahabot et al., 2017; McIntire and Walker, 1964) or of seasonal beach variations (Jeanson et al., 2013; Kench et al., 2009). While the immediate impact of long-period swells, earthquakes and tsunamis has not been thoroughly investigated, some studies suggest their great potential to induce major geomorphic changes (Cooper et al., 2013; Kench et al., 2006b; Smithers and Hoeke, 2014).
The long-term beach response has essentially been assessed from historical shoreline changes, particularly in atoll settings (Ford, 2013; Rankey, 2011; Webb and Kench, 2010; Yates et al., 2013). A few works have been conducted in high tropical volcanic islands such as in Hawaii (Romine and Fletcher, 2013) and Mauritius (Bheeroo et al., 2016), where shoreline retreat has been identified.
Our present knowledge of back-reef beaches evolution is thus limited, which hampers our understanding of these critical coastal zones.
4 The objectives of a permanent Observatory of the shoreline zone
The objective of a permanent “observatory” is to permit the collection of data appropriate to document a given phenomenon, continuously over a long period of time, and at high resolution so that the phenomena can be documented at different scales. Generally, the data must also be dense spatially. The observatory is thus assigned the missions of (i) collecting observations of parameters that well describe the phenomena under concern, and making this collection continuous over the long term (at least several years to decades), (ii) developing and using appropriate tools and methods to best perform the data collection, and (iii) sharing the collected data and knowledge with the scientific and public communities. Applied to the coastal context and the monitoring of the shoreline hydro and morphodynamics, an observatory should thus provide data meeting the following requirements:
- • some of the data are proxies that well represent the shoreline and allow its mapping in any or most conditions;
- • the data acquisitions can be repeated, with a frequency starting from a few hours (immediate event) to a few days;
- • the data can be acquired in long time-series, lasting several years to decades, key to discriminate temporal patterns;
- • some of the data are of high spatial resolution, so that the phenomena can be studied at different scales, down to a few centimetres or decimetres (for instance to accurately assess the sedimentary budgets or to measure the shoreline position at a decimetre scale);
- • the data acquisition is fairly simple, so that surveys can be conducted at any time they are needed (following tides, storms, etc.) and in any weather conditions;
- • the data acquisition is easily operated (transportability, etc.);
- • the data acquisition respects and preserves the sites and is compatible with the possible concurrent use of the sites by the public, etc.;
- • the acquisition instruments are resistant to coastal environmental conditions (salt, wind, spray, etc.).
It has to be noted that no consensus has yet been reached concerning the most appropriate proxy(ies) to use for the shoreline identification and mapping at local scale (Boak and Turner, 2005). In France a national proxy has been implemented by Cerema that relies on the vegetation limit in macrotidal beaches, and on the high-water line in microtidal beaches (Hédou et al., 2015). Nevertheless, certain specificities related to tropical environments must be considered. For example, while the high-water line is the most widely used proxy for the shoreline (Boak and Turner, 2005) highly reflective white carbonate sand typical of back-reef beaches makes it indiscernible on satellite and aerial images because of the saturation of the sensor (Leatherman, 2002). An alternative is to approach the shoreline by the toe of the beach (ToB) or the vegetation line. Adnan et al. (2016) have compared both in the North Keeling Island (Cocos Islands, Indian Ocean), more specifically the ToB and the seaward edge of the vegetation line. They obtained different results from the two methods, which emphasizes that the definition of an appropriate proxy for the shoreline is not yet clear.
5 Lessons from La Reunion Island to conceptualize an observatory of the shoreline
Note that the following recommendations have been tested and validated at the pilot site of Ermitage beach located on the western coast of La Reunion Island (Fig. 1).
5.1 Monitoring the shoreline changes from the vegetation limit
The shoreline changes in tropical environments have been monitored so far by mapping the vegetation limit as it can be seen on series of historical aerial or satellite images (Bulteau et al., 2015; Ford, 2013; Kench and Brander, 2006; Webb and Kench, 2010; Yates et al., 2013). However, most of these studies have mapped the vegetation line without considering the vegetation type. In tropical environments, the dominant vegetation on beaches generally consists in bushes, shrubs or trees (Casuarina equisetifolia, known as Beach Sheoak, Australian Pine, or Filaos in La Reunion Island). These different types of vegetation behave differently in context of erosion (Adnan et al., 2016), so that the beach width or volume may change without causing any displacement of the vegetation limit (Ford, 2011).
In particular, Australian Pine trees show very low sensitivity to the shoreline retreat. Indeed, they are salt-tolerant and they possess vertical and horizontal roots that follow the initial ground topography. Our observations in La Reunion Island show that their roots can be long exposed following erosion and loss of sand without any dramatic consequence on the tree; it can persist for many years. Thus, in this case, the actual shoreline retreat cannot be measured from the vegetation line (Fig. 2a). By contrast, the excavation height of the tree roots can be used as a proxy for the vertical shoreline retreat, thereby providing useful information on the shoreline evolution. At Ermitage beach, the vertical erosion is significant and it can be quantified using the measurement of the vertical root excavation. We have performed these measurements at high resolution using DGPS (Fig. 2b). The measurements reveal a south to north gradient in the exposure height of the tree roots (Casuarina equisetifolia forest planted as the first vegetation line along the beach before the 1950s; Fig. 2c).
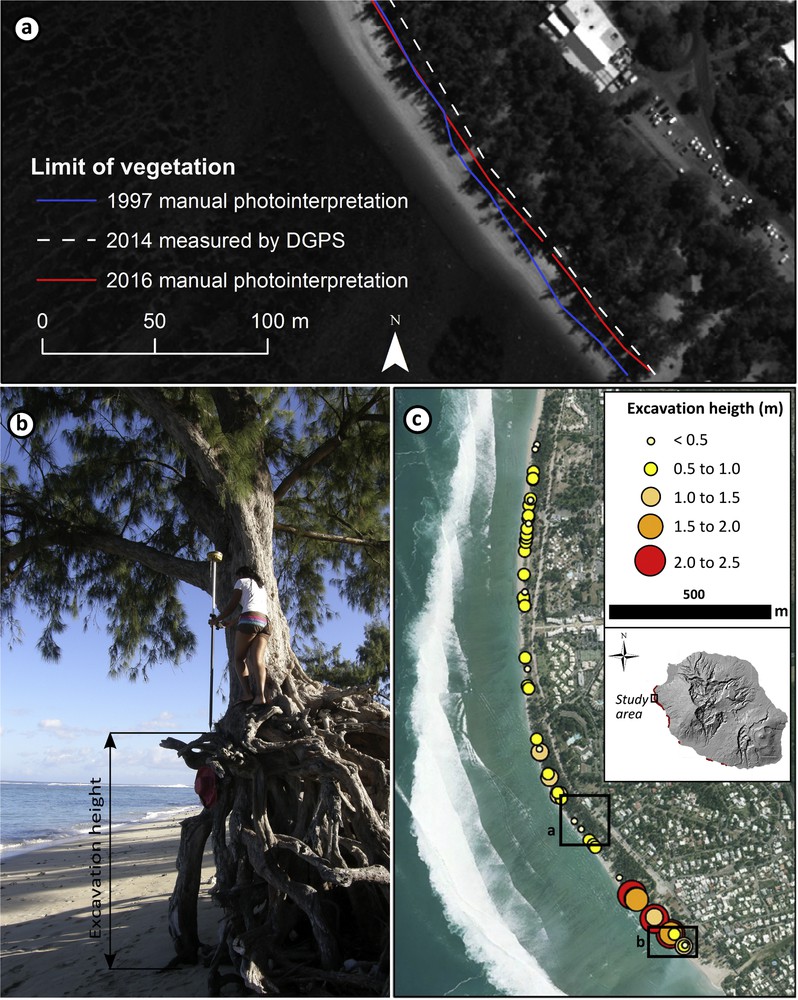
Horizontal versus vertical evolution of shoreline at the limit of tree vegetation: a: Comparison of horizontal position of vegetation limit obtained from manual photointerpretation of orthoimage (1997), provided by the Institut Géographique National [IGN] and Pléiades© satellite image (2016) and field DGPS measurement (2014). The horizontal accuracy is ±10 m for manual interpretation and ±2 m for DGPS; b: Sketch for excavation height measurement by DGPS. For scale, the DGPS pole on the photos is 2 metres high; c: South-to-north gradient of erosion at Ermitage beach shown by excavated root of Casuarina equisetifolia trees. The dark boxes correspond to the localization of the photos shown on a et b.
5.2 Monitoring the 3D-subaerial beach topography
Repeated topographic surveys over beaches allow the qualitative and quantitative description of their morphological changes, especially their volume changes over time. At the Ermitage beach, we have used three different methods to survey the subaerial beach topography repeatedly since 2012. A performance comparison of the different methods is given in Table 1.
Performance comparison of 3D topomorphological survey tools used in the Reunion Island coastal observatory.
| DGPS | TLS | UAV photogrammetry |
|
| Type of data | Point-wise measurements/cross-shore profiles | Point cloud + DEM | Point cloud + DEM + orthomosaic |
| Survey duration | ≈ 20′/beach profile station | ≈ 45′/TLS station (including laying out and measurement of the targets | ≈ 1–1.5 h for the flight (including laying out and measurement of the GCPs) |
| Surveyed surface area | 5 profiles of 60 to 90 m length | ≈ 10,000 m2/TLS station | ≈ 50,000 m2/flight |
| Adaptability to environmental constraints | Flexibility of use | No rain Low wind |
No rain Low wind |
| User convenience/requirements | 1 operator | Difficult to transport depending on access to site 2–3 operators |
1 licenced pilot required 2–3 operators |
| Type of processing | Post-processing using the permanent GNSS network | Point cloud filtering | SfM (Structure from Motion)-MVS (Multi-View Stereo) photogrammetry |
| Data quality | Accuracy: ≈ 2–4 cm | Resolution: ≈ 10 cm Accuracy: ≈ 5 cm |
Resolution: ≈ 2 cm Accuracy: ≈ 5 cm |
| Data volume | < 5 MB/profile | ≈ 1 Go/TLS station (point cloud + DEM) | ≈ 900 Mo (collected photos) ≈ 250 MB (DEM) ≈ 550 MB (orthomosaic) |
| Cost | ≈ 40,000 € | ≈ 100,000 € (in addition to DGPS) | ≈ 10,000 € (in addition to DGPS) |
| Survey frequency | 1/month | 1/year | 1/year |
A key technique common to the three methods is the differential post-processed GPS (DGPS) based on the global navigation satellite system. Indeed, the DGPS is mandatory to measure Ground Control Points (GCPs) in complement to any other (3D) mapping technique (Suanez et al., 2010); the GCPs provide the absolute positioning referencing of any other types of measurements (Delacourt et al., 2009; Jaud et al., 2017). DGPS profiling is the most convenient of all the 3 approaches, as it enables easy repeatability (Mahabot et al., 2017). However, DGPS is a point-wise approach that has a low spatial resolution, and the data acquisition is time-consuming. A surface survey conducted by DGPS gives a poor performance of 700 m2 surveyed per hour. Thus, the use of DGPS in back-reef beach settings is limited to beach topographic profiling, as reported in studies in Mayotte (Jeanson et al., 2013), Hawaii (Norcross et al., 2002), and Maldives (Kench and Brander, 2006).
Other methods, especially TLS (Terrestrial Laser Scanner) and UAV (Unmanned Aerial Vehicle) photogrammetry, are much more efficient in terms of surface coverage.
TLS is an active optical remote sensing technology in which the position of a point relative to the device is measured using the flight time of laser pulses reflected by the surface of the point to be measured. During data acquisition, the position of an object that has reflected the laser beam is first defined relative to the laser-source position. Thousands to millions of points are so measured. Generally, the resulting point cloud is registered in a global coordinate system, defined using a set of reflective targets that are distributed over the study site with their location measured with GCPs. After the georeferencing step, the operator merges the point clouds, manually filters the non-ground points (such as points on ground vegetation or walls), and interpolates the overall cleaned point cloud onto a regular grid. The grid provides a Digital Elevation Model of the zone, a DEM. In a TLS scan, the distribution and the density of the measured points vary with the distance to the TLS instrument and with the angle of incidence of the laser beam (Jaud, 2011). On flat areas, the spatial distribution of points is heterogeneous, and the resolution decreases rapidly away from the TLS. Besides, the spatial extent of the acquisition is limited by the theoretical range of measurements of the Lidar instrument. These problems can be resolved by multiplying the scan positions, but this increases the duration of the measurements and the complexity of the post-processing. For the surveys we have conducted on La Reunion beaches, we used a Riegl® VZ-400 TSL, whose specifications are described in Jaud et al. (2017). The theoretical range of measurements can reach up to 600 m. In the emerged areas, we could build DEMs having a 10-cm resolution.
Topographic data derived from aerial imagery is also now widely used thanks to the recent developments of both UAV platforms and specific pieces of software for what is called “Structure-from-Motion photogrammetry” (Colomina and Molina, 2014; Fonstad et al., 2013; Mancini et al., 2013; Smith and Vericat, 2015). The principle is to acquire overlapping pictures of the studied area using a camera mounted on an UAV, and then combine (alignment procedure) the images to compute by stereoscopy a DEM. An orthoimage, i.e. a planimetric image of the site, georeferenced and geometrically corrected, can be superimposed onto the DEM. On the beaches of the west coast of La Reunion, we have collected such photogrammetric data using a DRELIO UAV (Jaud et al., 2016), and processed these data using PhotoScan Pro®. Ground Control Points (GCPs) were then used to georeference the DEM. An appropriate distribution of the GCPs also allows reducing the distortions in the DEM reconstruction (Jaud et al., 2016; Tonkin and Midgley, 2016). This approach offered a synoptic vision of the beaches we surveyed (Delacourt et al., 2009; Wheaton et al., 2009).
The topographic data acquisitions described above are made to be repeated in time. The objective is to measure the topographic, hence morphological difference between two or several diachronic DEMs (Difference of DEM called DoD). A DoD is a gridded representation of the changes in elevation that have occurred between two acquisition dates. These measurements allow, for instance, to quantify the sediment volumetric changes, as shown in Fig. 3. Of the two methods described above, UAV photogrammetry offers more flexibility in the field and generates DEMs with better resolution at a lower cost (Letortu et al., 2017, under review). Regulations on UAV flights, which are country-dependant, can limit or prevent the use of UAVs however.
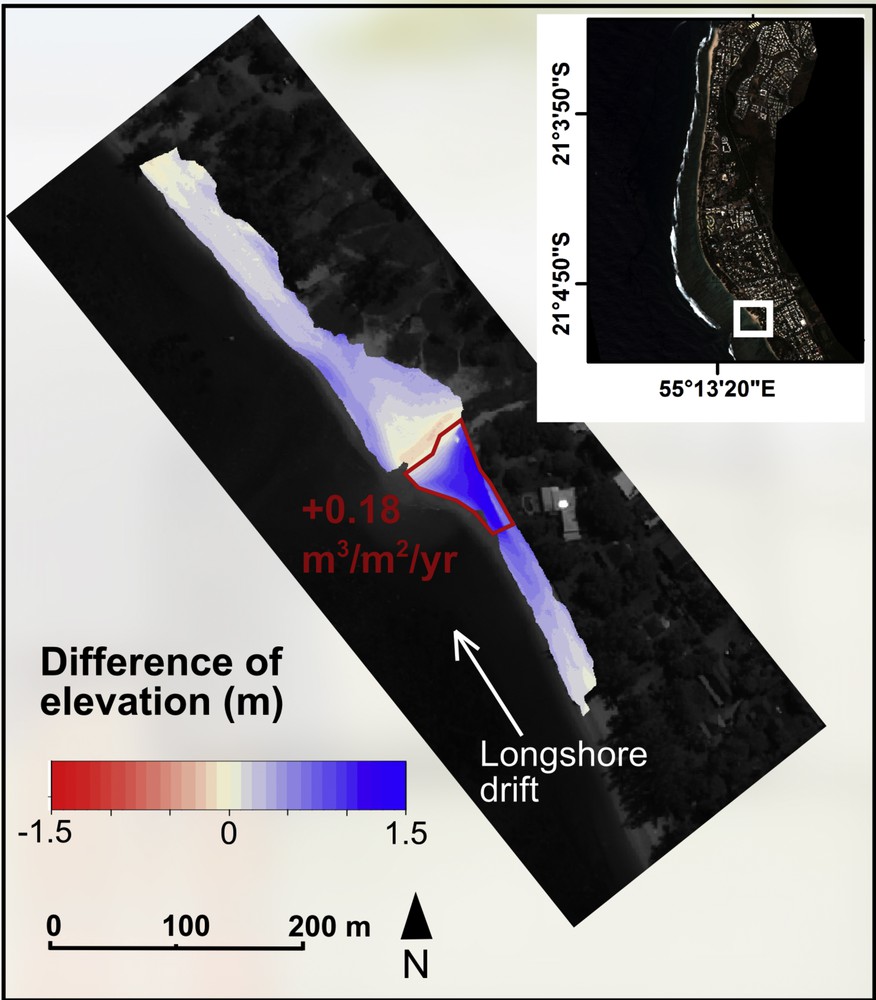
Differential TLS-DEM between 2016/05/10 and 2011/05/30. Spatial resolution is 10 cm. The DoD shows an accreted area (in red) with a calculated rate of +0.18 m3/m2/yr.
5.3 Monitoring the ToB using remote bathymetric measurements in shallow water
ToB is defined as the intersection of the beach sediments with the reef surface. It is usually characterized by a distinct break in the slope of the beach profile (Kench and Brander, 2006) and a sharp contrast (light versus dark) on remote sensing data (Mann and Westphal, 2014). Therefore, the measurement of the ToB in tropical environments has so far been done on optical aerial or satellite images.
In fringing reef settings, the beach terminates right at the contact with the reef flat (reef bank and platform). In the advanced fringing reef stage, the beach extends into a boat channel (also called the back-reef depression), making the ToB indiscernible at visible wavelengths (Fig. 4).
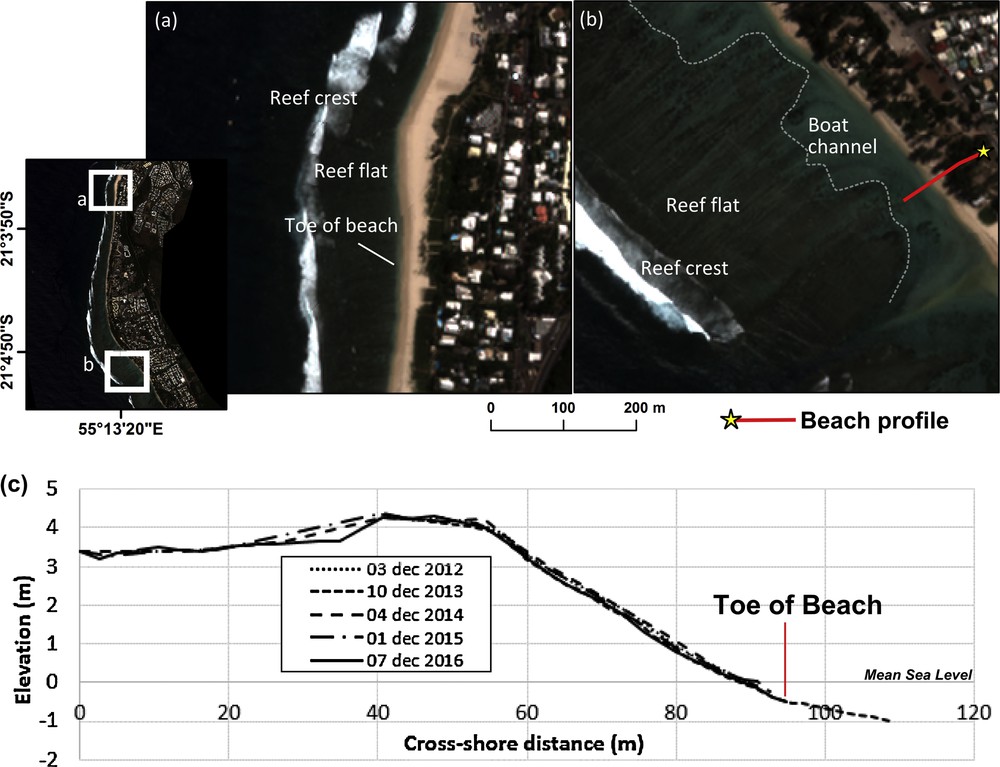
Illustration of ToB proxy. Identification of toe of beach (ToB) on vertical images realized in the case of a reef bank (a), indiscernible in the case of a fringing reef with a boat channel on vertical images (b) but materialized by a distinct break in the slope of the beach profile (c). The background is an extract from Pléiades© satellites, 2016/04/07.
Mapping shallow-water bathymetry would thus be efficient to identify and map the ToB. The TLS and UAV photogrammetry techniques described above are dedicated to the subaerial part of the beaches since the near infrared wavelengths of the laser beam is absorbed by water whereas the dynamics of waves prevents the use of photogrammetry. Bathymetric surveys using traditional echo sounder techniques are rarely conducted in fringing reef context because of their very shallow waters (< 2 m) that impede navigation and limit the spatial coverage of data acquisition. Airborne bathymetric Lidar is in current progress (Le Roux, 2009; see Litto3D® data from SHOM/IGN). This technique could reveal appropriate to monitor the bathymetry of the nearshore zone, but at present, it is very expensive and hence does not allow repeatability (Costa et al., 2009). Its spatial resolution is 1 m and its accuracy 50 cm vertically and 20 cm horizontally.
New methods for fine-scale bathymetry measurements using Structure-from-Motion (SfM) photogrammetry are in current development, from underwater imagery (Storlazzi et al., 2016) and UAV imagery (Casella et al., 2017). However, at present, these new methods apply only in very restrictive survey conditions (no sunglint, no ripple) that rarely occur. Another promising method, based on inversion of hyperspectral remote data, might offer soon new perspectives for reef bathymetry monitoring (Petit et al., 2017). Indeed, as it recovers information above a large portion of the electromagnetic spectrum with high spectral resolution, the hyperspectral imagery allows us to recover the shallow water bathymetry (up to 10 m deep in clear waters). At present, the method is still complex and expensive to implement, but the development of hyperspectral UAVs and the improvements in the inversion methods are promising.
Bathymetric data on the reef platform are also needed since the complex structure of the reef influences the hydrodynamic conditions, which, in turn, controls the beach geomorphic dynamics.
6 Discussion: a multi-tool approach
The techniques presented in Section 4 are efficient to meet many of the requirements listed in section 3, particularly concerning the spatial resolution and the flexibility of use. However, the relevance of the dataset can be enhanced by the complementarity of the different survey methods. As an example, cross-shore profiling enables rapid and frequent surveys. However, reports on two-dimensional topographic surveys rarely discuss the relevance of beach profile location and spacing, while they are crucial for achieving an adequate representation of the longshore morphological variability of the beach (Silveira et al., 2013; Theuerkauf and Rodriguez, 2012). Recent studies conducted in the fringing reef beach of La Saline (west coast of La Reunion Island) (Cordier, 2007; Mahabot, 2012) have highlighted the existence of hydro-sedimentary cells operating over small scales (500 metres wide) along a single linear beach, which suggests that transect spacing needs to be carefully determined in accordance with the size of the small-scale hydro-sedimentary cells when they exist.
Furthermore, many external constraints related to beach configuration and instruments can affect the performance of certain methods. The Ermitage beach is a challenging environment because of its typical back-beach configuration where urbanization and tree vegetation are dense and generate constraints for data acquisition by masking part of the beach topography, particularly in the upper and back-beach zones. On dunes, the canopy can also be a constraint. Indeed, topographic mapping using TLS is highly limited by these elements, which create shaded zones in the point cloud. Beach length also poses a challenge when mapping is done with TLS, as the spatial extent of the acquisition (maximum of 600 m) can be smaller than the size of the hydro-sedimentary cells mentioned above. These issues, length of surveyed area and shielding from obstacles, can be overcome with UAV photogrammetry, where coverage is not as limited and flights with oblique orientation of the camera may allow mapping through the canopy. With UAV photogrammetry, the distortions that can affect the DEMs (such as those resulting from the linearity of the surveys) may be corrected using a relevant distribution of absolute GCPs measurements.
In La Reunion Island, the combined topographic surveys that we performed provide an efficient set of data to monitor the shoreline dynamics. However, for an integrated comprehension of the coastal zone morphodynamics, additional parameters (hydrodynamics, anthropization, etc.) will be needed.
7 Conclusion
This study aims at providing a methodological framework to monitor the shoreline dynamics in back-reef beach systems. Shoreline changes measured from typical photointerpretation methods must be supplemented by field investigations to map the actual shoreline kinematics, considering the morphodynamic processes and the beach morphological adjustments that can be affected by local patterns and processes. The complementarity of very high resolution, flexible and moderate to low-cost platforms such as TLS and UAVs offers the opportunity to achieve this goal as they provide a 3D synoptic vision and measure of the surveyed sites. Digital Elevation Models (DEM) derived using these tools have a spatial resolution of up to 3 cm for Structure-from-Motion photogrammetry from UAV aerial images and 10 cm for interpolation of TLS 3D point clouds. In the perspective of an integrative approach of coastal zone mapping, hyperspectral imagery from UAV is a promising approach to overcome the physical constraints that are induced by shallow water depth in reef environments. This panel of techniques appears to be promising for long-term coastal observation in back-reef beach environments. In the future, beyond the measurement of geomorphic and physical parameters, multidisciplinary approaches need to be considered, as these spaces are complex eco-morphodynamic systems with significant effects arising from interactions between biological and physical components.
Acknowledgements
This work is financially supported by DEAL Réunion, OSU Réunion, SNO Dynalit and AllEnvi.