

1 Introduction
Confluences are a common feature of riverine systems, where are located converging flow streamlines and potential mixing of separate flows. As the flows from two tributaries merge and adjust to the confluences planform geometry, substantial changes to the flow hydrodynamics and bed morphology occur within and immediately downstream of the confluence (Mosley, 1976). Within a confluence the region where the local hydrodynamics are influenced by the convergence and realignment of the combining flows at the confluence is known as the Confluence Hydrodynamic Zone (CHZ) (Kentworthy and Rhoads, 1995).
The fluid dynamics about confluences have a highly complex three-dimensional flow structure, which generally includes a zone of flow stagnation near upstream junction corner, an area of flow deflection as tributary flows enter confluence a shear layer and/or a mixing interface between the two converging flows; a possible zone of separated flow about the downstream junction corner(s); flow acceleration within the downstream channel; and flow recovery at the downstream end of the CHZ as illustrated in Fig. 1 (Best, 1987; Trevethan et al., 2015a).
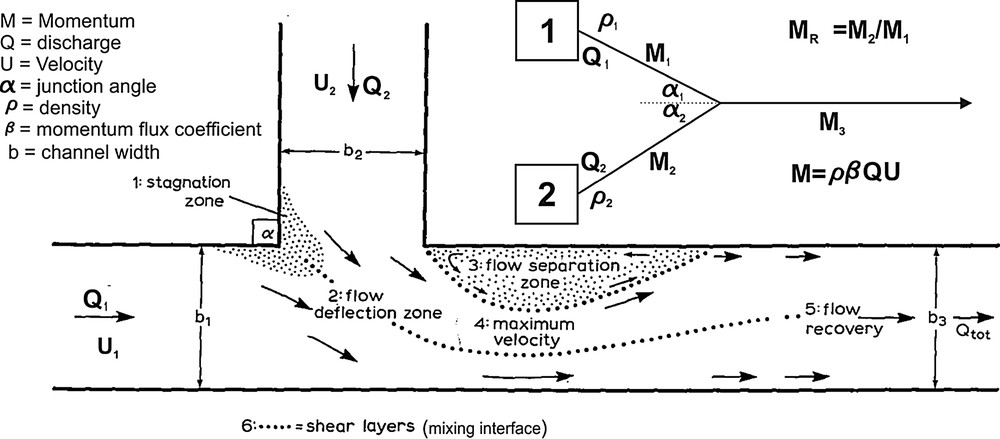
Descriptive model of flow dynamics and key hydrodynamic features about a confluence, slightly modified from Best (1987) (Trevethan et al., 2015a).
It is generally acknowledged that the hydrodynamics and morphodynamics (i.e. patterns of erosion and deposition) within the CHZ are influenced by (1) the planform of the confluence; the junction angle of confluence, (2) the momentum flux ratio of merging streams (MR) and (3) the level of concordance between channel beds at the confluence entrance (Best, 1987; Mosley, 1976). Further, any differences in the water characteristics (e.g., temperature, conductivity, suspended sediment concentration) between the incoming tributary flows and subsequent possible stratification lead to the development of a mixing interface and may also impact the local processes about the confluence (Biron and Lane, 2008; Rhoads and Kentworthy, 1998). Within the near-field of the confluence, the shear layer and the mixing interface are typically coincident, but in some cases the mixing interface may extend further downstream than the shear layer (Rhoads and Sukhodolov, 2008). Depending on the angles between the two incoming rivers with the downstream channel, and their momentum flux ratio, the mixing interface may display Kelvin–Helmholtz or wake mode type flow characteristics (Rhoads and Sukhodolov, 2008). Helical flow cells are also often observed about confluences, however, the presence and characteristics of these helical cells at confluences remains controversial.
The confluence bed morphology can generally be related to the different hydrodynamics zones presented in Fig. 1 (Best, 1987, 1988). Common morphological features often observed about confluences include: a scour hole normally orientated along the region of maximum velocity where both flows begin to converge; avalanche faces at the mouth of each tributary; sediment deposition within the stagnation zone; and bars formed within possible flow separation zones or mid-stream in downstream channel (Szupiany et al., 2009). Another morphological feature sometimes observed at a confluence is a bed discordance (i.e. one tributary bed is deeper than the other), which can be formed through differences in channel discharges and bed geology (Gaudet and Roy, 1995). More generally, the patterns of erosion and deposition within the CHZ reflect the spatial variations in bed shear stress (Rhoads et al., 2009). Ultimately, the bed shear stress and sediment transport can be related to the localized turbulent fluctuations in flow velocity generated through the interaction of the flow with both vertical and horizontal variations in channel bathymetry, causing the flow to accelerate or decelerate (Best and Rhoads, 2008).
The paper presents some key results from two field surveys (FS−CNS1 and FS−CNS2) conducted about the confluence of the Negro and Solimões Rivers, in the Amazon basin, which is one of the largest confluences on Earth. The goals of this paper are: (1) to gain a comprehensive characterization of the basic hydrodynamics parameters about the confluence as well as of those affecting sediments transport, (2) to compare the basic hydrodynamics features with those commonly observed in previous confluence studies, and (3) to highlight some differences between low and relatively high-flow conditions about the transfer of momentum from the Solimões to the Negro side of the Amazon Channel.
2 Field site and instrumentation
The confluence of the Negro and Solimões Rivers is located near Manaus, in northern Brazil, where these rivers merge to form the Amazon River approximately 1600 km upstream from its mouth on the Atlantic Ocean. This confluence is famous for the meeting of the black and white waters of the two rivers, which may be visually observed not mixing for more than 50 to 100 km downstream. The distinct waters of these two rivers are related to the locations of the two catchments within the Amazon Basin described above.
As part of the CLIM–Amazon Project, which was a joint European and Brazilian Research Project funded by the EU about climate and sedimentary processes of the Amazon River Basin, two field surveys were conducted about that confluence in both low (October 2014, FS−CNS1 survey) and relatively high-flow conditions (April/May 2015, FS−CNS2 survey) (Gualtieri et al., 2015, 2018; this issue; Trevethan et al., 2015a, 2015b, 2016). In these field campaigns, acoustic Doppler velocity profiling (ADCP) and high-resolution seismic methods, such as echo-sounding and sub-bottom profiling, were used as well as water sampling for the measurement of several water chemistry parameters (temperature, conductivity, pH, turbidity, dissolved oxygen, oxygen isotopes) and suspended sediments concentration. These data were collected to investigate key features about hydrodynamics, mixing, sediment transport and morphodynamics about this confluence. This study aims also to provide some general insights into large confluence dynamics and processes.
During both FS−CNS1 and FS−CNS2, a Teledyne RDI 600 kHz Rio Grande acoustic Doppler current profiler (ADCP) was used to collect cross-sectional measurements at key locations about the confluence, as indicated by lines in Fig. 2. In total, 98 cross-sectional transects were collected, namely 50 in FS−CNS1 in 28 different locations, and 48 in FS−CNS2 in 26 different locations. In addition to the cross-sectional measurements, two and three longitudinal profiles along both sides of the Amazon River were collected in field surveys FS−CNS1 and FS−CNS2, respectively. The total number of ADCP profiles was 52 and 51 in FS−CNS1 and FS−CNS2, respectively. The ADCP was used to measure three-dimensional water velocities over the water depth along the transect, as well as water temperature near the surface and backscatter intensity, which after a proper calibration could be related to suspended sediment concentration (Szupiany et al., 2009). Due to the extreme sampling conditions (i.e. flow velocities up to 3 m/s, turbulent eddies larger than 40 m), an almost constant boat speed of approximately 2 m/s was used while collecting these transects to ensure minimal lateral variations about the transect line.
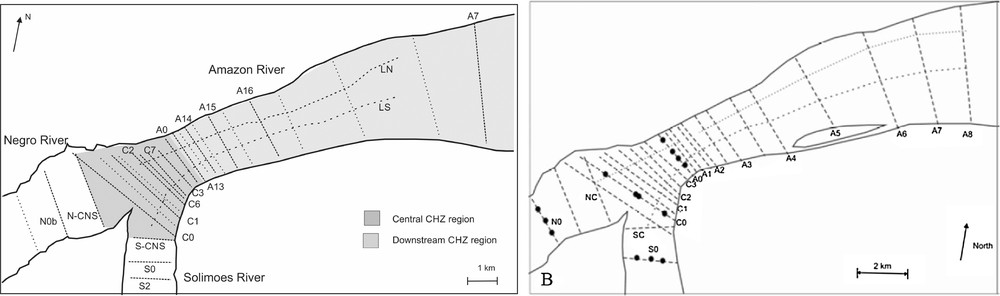
Map of confluence for Negro and Solimões Rivers, with sampling positions during field campaigns FS−CNS1 (left) and FS−CNS2 (right) are highlighted. The dots show the locations where vertical profiles were collected in FS−CNS2 (Trevethan et al., 2015a, 2016).
During FS−CNS1 water samples at surface, 10 m, and 20 m depths at twelve locations about confluence were collected. These water samples were used to understand the characteristics of the two tributary rivers (temperature, pH, conductivity) and measure the local total suspended-sediment (TSS) concentration and oxygen isotope values. During FS−CNS2 vertical physicochemical profiles were collected with a YSI EXO2 multi-parameter probe. The locations are indicated by black points in Fig. 2(right). At each station, the probe collected temperature, pH, conductivity, turbidity, chlorophyll, and dissolved oxygen concentration profiles with depth. Further water samples were collected at sites S0 and N0 to measure the local TSS concentration on the Solimões and Negro Rivers respectively.
3 Key observations on hydrodynamics
Table 1 lists the measured median main flow properties of Negro and Solimões Rivers at the ADCP transects just upstream of the confluence (N–CNS and S–CNS, three for each river and each field survey) during both field campaigns. It can be seen that large differences in discharge and flow velocities were observed in the Solimões River between field studies FS−CNS1 and FS−CNS2, whereas for the Negro River these differences were smaller.
Main flow properties of the Negro and Solimões Rivers during FS−CNS1/FS−CNS2.
| Field trip | Q (m3/s) | A (m2) | W (m) | hmed (m) | W/hrect (–) | Vavg (m/s) | Vdepth−avg (m/s) | Dir (°) | Vmax (m/s) | |
| Negro | FS−CNS1 | 24,510 | 65,839 | 3134 | 24.4 | 115 | 0.37 | 0.41 | 59 | 0.69 |
| FS−CNS2 | 33,501 | 90,533 | 3189 | 31.2 | 91 | 0.38 | 0.44 | 58 | 0.67 | |
| Solimões | FS−CNS1 | 63,380 | 45,560 | 2618 | 27.2 | 56 | 1.42 | 1.35 | 289 | 2.20 |
| FS−CNS2 | 105,205 | 63,937 | 2347 | 28.6 | 58 | 1.65 | 1.56 | 255 | 2.59 |
From FS−CNS1 to FS−CNS2, the maximum depth-averaged velocity remained almost constant in the Negro River, but in the Solimões increased from 2.2 to 2.6 m/s. Furthermore, from low-flow to high-flow conditions, the Negro channel increased in depth, from 24 to 31 m, but not in width, whereas in the Solimões the width increased from 1.6 to 1.9 km and the depth from 27 to 28 m. Thus, from FS−CNS1 to FS−CNS2, the channel aspect ratio decreased in the Negro River and was almost constant in the Solimões River. Finally, from FS−CNS1 to FS−CNS2, the median of flow direction in the Negro River remained unchanged, whereas in the Solimões River a significant change in direction occurred.
Table 2 lists the measured median water characteristics of Negro and Solimões Rivers at the ADCP transects just upstream of the confluence (N–CNS and S–CNS) on both field trips.
Main water characteristics of the Negro and Solimões Rivers during FS−CNS1/FS−CNS2.
| Field trip | Basin area (km2) | Q (m3/s) | T (°C) | ρ (Kg/m3) | Cond. (μS/cm) | pH | TSS (mg/L) | M (MN) | |
| Negro | FS−CNS1 | 687,000 | 24,510 | 30.3 | 995.49 | 7 | 5.6 | 8.3 | 9.1 |
| FS−CNS2 | 33,501 | 29.0 | 995.90 | 13 | 5.0 | 4.1 | 12.3 | ||
| Solimões | FS−CNS1 | 2,150,000 | 63,380 | 29.6 | 995.70 | 79 | 6.9 | 185.3 | 89.3 |
| FS−CNS2 | 105,205 | 28.0 | 996.19 | 80 | 6.7 | 108.6 | 172.4 |
In Table 2, one can see that significant differences in the water characteristics of the two rivers were observed, in agreement with previous studies about the confluence (Laraque et al., 2009). It is reasoned that the differences in water characteristics and more importantly in density between the confluent flows are more likely in large, lowland, river junctions than in smaller rivers, since the probability that the rivers will source areas of differing lithology and hydrological regime is greater (Best et al., 2007). In particular, in this case, water density was higher in the Solimões River with a slightly larger difference observed during FS−CNS2. This created a lateral stratification about the confluence with an associated mixing interface. Again, the water conductivity, pH and turbidity were larger in the Solimões River. Finally, the range of the suspended-sediment concentration/total suspended solids (TSS) observed during both field surveys was 0.1 > TSS > 0.2 g/L and TSS < 0.01 g/L in the Solimões and Negro waters respectively. These observed TSS values on the Solimões River are similar to those observed by Richey et al. (1986) under similar low-flow conditions. The small values observed on the Negro River reflect the amount of suspended organic matter, as this river is not generally known for carrying suspended sediments (Laraque et al., 2009).
Previous confluence studies have largely acknowledged that the momentum flux (MR = ρN QN Vavg−N/ρS QS Vavg−S), discharge (QR = QN/QS) and velocity (VR = Vavg−N/Vavg−S) ratios can be related to the observed hydrodynamic and morphodynamic features about the confluence, where the subscripts S and N represent the Solimões and Negro Rivers, respectively. These ratios for field studies FS−CNS1 and FS−CNS2 are listed in Table 3.
Discharge, velocity and momentum flux ratios FS−CNS1/FS−CNS2.
| Field trip | Q R | V R | M R |
| FS−CNS1 | 0.39 | 0.26 | 0.10 |
| FS−CNS2 | 0.32 | 0.22 | 0.07 |
The relatively high values of these ratios are indicative of the large difference in the flow properties of the two merging rivers. It is worth noting that there is a large junction angle of approximately 65° between the Negro and Solimões Rivers, while the junction angle between the Solimões and Amazon Rivers are approximately 110° (Fig. 2). These large junction angles of the Solimões with the Negro and Amazon Rivers mean that the Solimões River effectively enters the confluence almost perpendicular to the main flow direction of the Amazon and Negro Rivers, and therefore the waters of the Solimões must undergo a large change in flow direction (60–70°) as it becomes the Amazon River, while the Negro waters do not.
At the beginning of the central confluence region, the channel width was approximately 5.0 and 5.5 km in FS−CNS1 and FS−CNS2, respectively. Downstream it narrowed to approximately 2.0 km about the transects CNS3 and A0, close to the beginning of the Amazon River, with the channel width gradually expanding to over 5 km about 16 km downstream. In the last 2 km upstream of the confluence, the Solimões River had a channel width of approximately 1.6 and 2.0 km in field studies FS−CNS1 and FS−CNS2, respectively, while the channel width of the Negro River varied from approximately from 2.5 to 2.9 km, with no significant changes between FS−CNS1 and FS−CNS2.
Fig. 3 shows the depth-averaged velocity data (magnitude and direction) collected at each transect about the confluence of the Negro and Solimões Rivers on 30 and 31 October 2014 (FS−CNS1) and on 29–30 April 2015 (FS−CNS2) (Trevethan et al., 2016). Figures were plotted using the Velocity Mapping Tool software (Parsons et al., 2013).

Depth-averaged velocities of ADCP transects collected about the confluence of Negro and Solimões Rivers on 30–31 October 2014 (left) and on 29–30 April 2015 (right) during FS−CNS1 and FS−CNS2, respectively (Trevethan et al., 2016).
Fig. 4 shows the map of the interpolated depth-averaged velocities about the confluence of the Negro and Solimões Rivers on October 2014 (left) and on April/May 2015 (right), whereas Fig. 5 plots the depth-averaged velocity magnitude of the flow vs. distance downstream of the junction corner. Fig. 4(left) and (right) were prepared with the data collected on 30 and 31 October 2014 and 29 and 30 April 2015, respectively. The maps were obtained by kriging of the ADCP data. Finally, Fig. 6 presents the difference in velocity magnitude (left) and flow direction (right) between the Negro and Solimões Rivers portions on 30 October 2014, 31 October 2014, and on 30 April 2015.
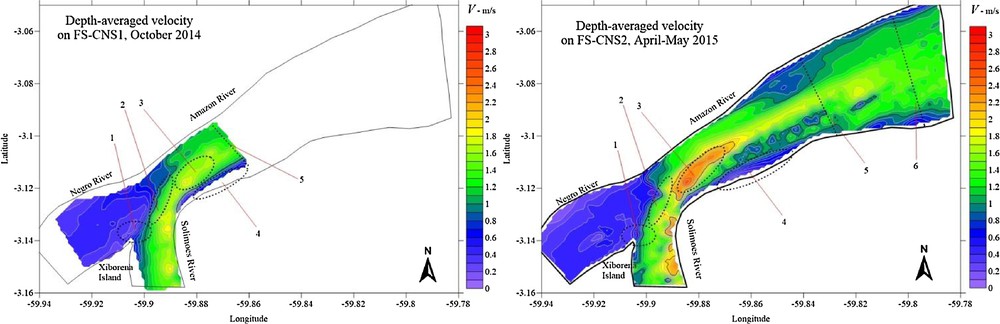
Map of depth-averaged velocities about the confluence of Negro and Solimões Rivers in October 2014 (left) and in April/May 2015 (right), with the location of the hydrodynamics features (Gualtieri et al., 2018, this issue). (1) stagnation zone; (2) region of deflection; (3) region of maximum velocity; (4) downstream separation zone; (5) beginning of region of flow recovery; and (6) end of the confluence hydrodynamic zone.
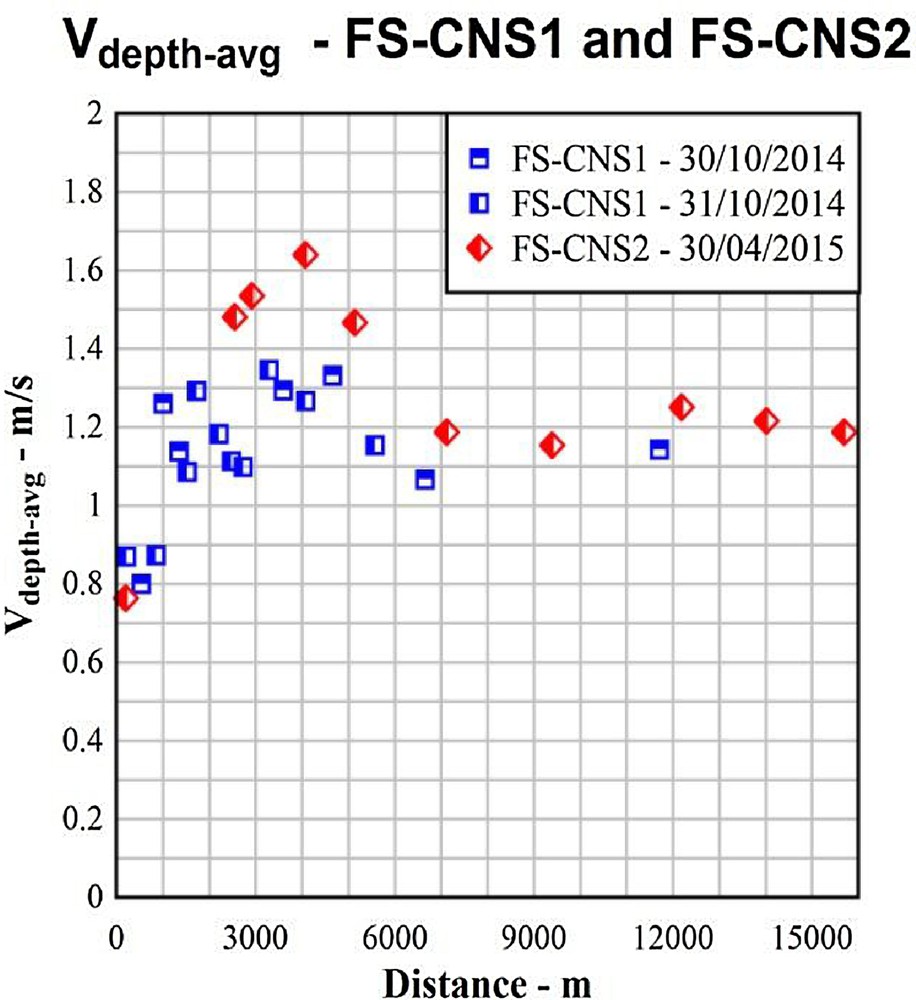
Depth-averaged velocity magnitude on 30 October 2014, 31 October 2014, and 30 April 2015.
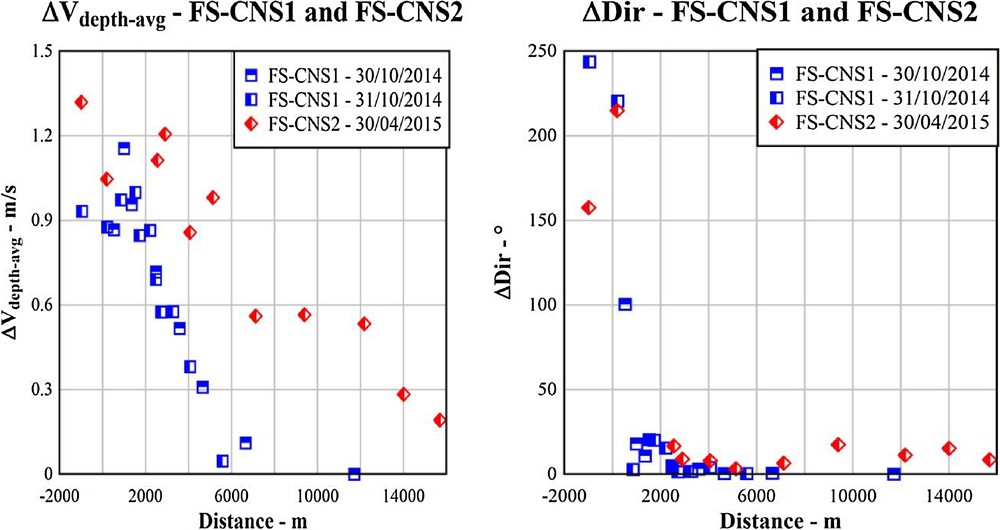
Difference in depth-averaged velocity magnitude (left) and in flow direction (right) between the Negro and Solimões Rivers portions on 30 October 2014, 31 October 2014, and 30 April 2015.
Table 4 lists the median water characteristics within the central confluence region and Amazon River on 31 October 2014. The depth-averaged velocity magnitude and the flow direction for the Negro and Solimões portions of the confluence and channel are presented.
Main flow properties about the confluence and the Amazon River on 31 October 2014.
| Negro | Solimões | |||||||||
| Transect | Distance (m) | Q (m3/s) | W (m) | hmed (m) | W/hrect (–) | Vdepth−avg (m/s) | Vdepth−avg (m/s) | Dir (°) | Vdepth−avg (m/s) | Dir (°) |
| CNS0 | 220 | 87,078 | 4697 | 29.2 | 167 | 0.87 | 0.30 | 61 | 1.18 | 282 |
| CNS1 | 530 | 91,230 | 3257 | 33.1 | 90 | 0.87 | 0.35 | 63 | 1.33 | 66 |
| CNS6 | 1530 | 91,329 | 2161 | 45.0 | 48 | 1.09 | 0.50 | 52 | 1.50 | 31 |
| CNS7 | 1730 | 89,828 | 2008 | 44.5 | 46 | 1.29 | 0.61 | 48 | 1.46 | 28 |
| CNS3 | 2210 | 87,266 | 1719 | 46.6 | 37 | 1.18 | 0.75 | 43 | 1.61 | 28 |
| A0 | 2480 | 93,117 | 1944 | 42.7 | 45 | 1.11 | 0.82 | 43 | 1.51 | 40 |
| A13 | 2730 | 90,508 | 1942 | 45.7 | 43 | 1.10 | 0.81 | 45 | 1.39 | 46 |
| A14 | 3290 | 92,080 | 1915 | 36.9 | 51 | 1.35 | 1.03 | 50 | 1.60 | 51 |
| A15 | 4070 | 94,588 | 2104 | 34.7 | 60 | 1.27 | 1.08 | 51 | 1.46 | 55 |
| A16 | 5580 | 91,173 | 2187 | 33.9 | 70 | 1.15 | 1.12 | 60 | 1.17 | 60 |
The 15 ADCP transects collected on 31/10/2014 during the FS−CNS1 within a 10.2-km study region about the Negro/Solimões confluence, included two transects on the Negro River, three transects on the Solimões River, five transects in the central CHZ region of the confluence, and five in the downstream CHZ region on the Amazon River. Fig. 3(left) shows that on the Negro River, at both transects N0 and N–CNS, the flow velocity was relatively uniform over the channel width, with a median value of 0.4 m/s. Conversely in the Solimões, the depth-averaged velocity distribution varied over the channel width, from approximately 2 m/s in the main channel near the right bank, decreasing almost linearly towards the left bank, to a minimum of approximately 1 m/s observed at the left side of the three Solimões transects (S2, S0 and S–CNS).
As the two rivers entered the confluence, the channel width was almost 5 km, with the two waters merging about a strong and easily visible mixing interface. For the low-flow conditions observed during FS−CNS1, the mixing interface begun approximately 100 m upstream on the Solimões side of the central spit between the two rivers, with evidence of a stagnation zone between the two waters on either side of the spit. Further, the upstream extent of the stagnation zone seems to end before the location of transect CNS0, with two waters being deflected and locally aligned about the mixing interface downstream this transect (Trevethan et al., 2015a).
Through the central confluence region, as the waters of the Negro and Solimões merged and realigned with the downstream channel of the Amazon River the flow in all portions of the confluence accelerated as channel width narrowed. Within this central confluence region, a maximum depth-averaged velocity magnitude of almost 2.5 m/s was observed near the right bank around transect CNS1 (Fig. 3[left] and Fig. 4[left]). After transect CNS1, which was located about 0.5 km downstream the confluence apex, the flow direction of the Solimões waters changed as it realigned with the flow direction of the Amazon River around transects A0 and A13 (Fig. 4[right]).
In Fig. 5, one can see that the median cross-sectional velocity magnitudes increased throughout the central confluence region until transect CNS7, located 1.7 km downstream the junction, just before the beginning of the Amazon River. As the waters of the Negro and Solimões converged into the channel of the Amazon River, the cross-sectional averaged velocities decreased between transects CNS7 and A0/A13, which would indicate the end of the flow acceleration generated by the reduction in channel width through this central region.
Approximately downstream transect CNS3, a flow separation zone with recirculation was observed just downstream of the junction corner of the Solimões and Amazon Rivers (Fig. 4(left). The recirculation cell within the separation zone extended from transects CNS3 to A13 and had a width of about 300 m and a length of approximately 1.0 km (Trevethan et al., 2015a). As part of this recirculation cell, an upstream velocity magnitude of approximately 0.3 to 0.6 m/s was observed near the right bank at sites A0 and A13 (Trevethan et al., 2015a). The separation region ended upstream transect A16, accounting for a length of approximately 2.5 km. Furthermore, in this region, there seemed to be a significant lateral deflection of Solimões, as the flows realign with the Amazon channel, which may be related to the observed flow separation zone.
From transect A13 the median cross-sectional averaged velocities increased with distance downstream until reaching a maximum around transect A14, after which the velocities decreased as the channel width expands (Fig. 5). Under the flow conditions observed on 31 October 2014, complete realignment of the Negro and Solimões waters with the Amazon River channel occurred about the transect A13, which was located about 2.7 km downstream of the junction apex (Fig. 6[right]).
In CNS0, the difference in the depth-averaged velocity magnitude in the Negro and Solimões rivers, i.e. ΔVdepth−avg, was greater than about 0.88 m/s. From transect A14 (approximately 3.3 km downstream the junction) the median depth-averaged velocities of the Solimões portion decreased, while that of the Negro portion increased, so ΔVdepth−avg decreased (Fig. 6[left]). This would seem to indicate the transfer of momentum from the Solimões to the Negro side of the Amazon Channel due to velocity shear. At transect A16 ΔVdepth−avg between the Solimões and Negro portions were approximately 0.05 m/s (Fig. 6(left)). Notably, on 30/10/2014, ΔVdepth−avg was negligible in A6, which was located 11.7 km downstream the junction apex (Fig. 6[left]).
The 12 ADCP transects collected on 30 April 2015 during the FS−CNS2 within a 17 km study region about the Negro/Solimões confluence, included one transect on the Negro River, one transect on the Solimões River, two transects in the central CHZ region of the confluence and eight in the downstream CHZ region on the Amazon River. Note that in Fig. 3(right) are plotted even five transects collected on 29 April 2015. Table 5 shows the median water characteristics within the central confluence region and the Amazon River on 30 April 2015.
Main flow properties about the confluence and the Amazon River on 30 April 2015.
| Negro | Solimões | |||||||||
| Transect | Distance (m) | Q (m3/s) | W (m) | hmed (m) | W/hrect (–) | Vdepth−avg (m/s) | Vdepth−avg (m/s) | Dir (°) | Vdepth−avg (m/s) | Dir (°) |
| CNS8 | 200 | 141,814 | 5257.28 | 33.0 | 164.6 | 0.76 | 0.34 | 56 | 1.39 | 271 |
| CNS3 | 2550 | 142,768 | 2190.05 | 48.4 | 50 | 1.48 | 0.79 | 46 | 1.90 | 29 |
| A0 | 2920 | 151,268 | 2080.67 | 47.2 | 44 | 1.53 | 0.99 | 45 | 2.20 | 36 |
| A2 | 4070 | 147,211 | 2244.42 | 41.7 | 57 | 1.64 | 1.22 | 46 | 2.08 | 54 |
| A3 | 5140 | 143,495 | 2559.04 | 39.0 | 73.9 | 1.47 | 1.36 | 55 | 2.34 | 58 |
| A4 | 7130 | 145,330 | 2992.54 | 38.8 | 84.9 | 1.19 | 1.27 | 63 | 1.83 | 70 |
| A5 | 9400 | 136,821 | 3272.39 | 35.2 | 94.9 | 1.15 | 0.85 | 54 | 1.42 | 72 |
| A6 | 12,190 | 141,431 | 4162.18 | 27.0 | 158.8 | 1.25 | 1.10 | 65 | 1.63 | 76 |
| A7 | 14,020 | 142,087 | 4609.01 | 26.3 | 182.9 | 1.22 | 1.14 | 66 | 1.42 | 81 |
| A8 | 15,700 | 143,977 | 4968.03 | 24.7 | 197.7 | 1.19 | 1.07 | 74 | 1.26 | 83 |
For the relatively high-flow conditions observed during the field survey FS−CNS2, the depth-averaged velocities observed on the Solimões side of the confluence were up to 3.0 m/s and were significantly larger than those observed on the Negro side of the confluence, which ranged between 0.35 and 1.1 m/s at the beginning and end of the CHZ respectively (Fig. 3[right] and Fig. 4[right]). It can be generally seen that, in the Amazon channel, the Solimões side velocities decreased and the Negro side velocities increased with distance downstream of the confluence until the depth-averaged velocities became relatively uniform around transect A8, indicating the approximate end to the CHZ (Fig. 4[right]). Also on 30 April 2015 the flow direction of the Solimões changed mostly to realign with the flow direction of the Amazon River around transect A0 (Fig. 6[right]).
In Fig. 5, one can see that the median cross-sectional velocity magnitude increased throughout the central confluence region until the transect A2, located approximately 4.0 km downstream the junction's apex. After this transect, the velocity magnitude decreased and from transect A4, which is located about 7.1 km downstream the junction apex, it was almost constant. The depth-averaged velocity was larger than on 31 October 2014. Also, on 30 April 2015, a complete realignment of the Negro and Solimões waters with the Amazon River channel occurred approximately 2.9 km downstream of the junction apex (Fig. 6[right]).
On 30 April 2015, the difference in the depth-averaged velocity magnitude in the Negro and Solimões rivers, i.e. ΔVdepth−avg, was more than 1 m/s. From A0, which was located 2.9 km downstream the junction, ΔVdepth−avg started to decrease. At the end of the considered reach, in A8, which was located 15.7 km downstream the junction apex, the difference was about 0.19 m/s (Fig. 6[left]). Comparing low-flow and high-flow conditions, one can see that ΔVdepth−avg was larger in the latter, both immediately upstream and downstream of the junction apex (Fig. 6[left]).
Further on 30 April 2015, the above separation region with recirculation downstream transect CNS3 seemed to have a larger size, as it ended approximately at transect A4, which would indicate that this zone had a length of more than 4.0 km (Fig. 4(right)).
Fig. 7 presents the distribution of the Vdepth−avg as well as of the temperature on the water surface in CNS0 on 31 October 2014 and CNS8 on 30 April 2015. In both flow conditions, ΔVdepth−avg tended to decrease downstream, but the data indicated that the transfer of momentum from the Solimões to the Negro side of the Amazon Channel was comparatively weaker in high-flow conditions than in low-flow conditions (Fig. 6[left]), while the realignment rate was similar (Fig. 6[right]). These findings are confirmed by the data collected on 30/10/2014, i.e. again in low-flow conditions, included in Fig. 6.

Depth-averaged velocity magnitude and surface temperature in CNS0 on 31 October 2014 (left) and CNS8 on 30 April 2015 (right).
This is possibly related to the differences in lateral stratification between low and relatively high-flow conditions, but very likely the effect of the lateral forces from converging flows, friction and change in channel width should be considered. Furthermore, the effects of flow structures visually observed about the confluence, such as Kelvin–Helmholtz waves with rolling and bursting, turbulent boils, etc., should be considered (Trevethan et al., 2015a, 2016). However, a detailed investigation on this is still ongoing.
The analysis of the velocity field about the confluence and in the initial part of the Amazon River aimed to verify whether the common hydrodynamic features identified in the conceptual model of Best (Fig. 1) and already observed in past confluence studies were present also about the Negro/Solimões confluence. The approximate locations of those features observed during FS−CNS1 and FS−CNS2 are presented in Fig. 4, namely: (1) stagnation zone, (2) region of deflection, (3) region of maximum velocity, (4) downstream separation zone, (5) beginning of region of flow recovery, and (6) end of the confluence hydrodynamic zone.
Comparing the locations, one can see that the region of maximum velocity seemed displaced downstream in relatively high-flow conditions, where also the end of the CHZ can be more easily identified. Moreover, on 31 October 2014, flow recovery region was starting downstream transect A15, while in A16 the influence of the confluence on the flow seemed to be significantly lower. Transects collected further downstream on 29 October 2014 indicated that in low-flow conditions, an almost constant velocity across cross-section was observed between transects A6 and A7 (11.7 and 13.5 km downstream the junction apex). Finally, regarding the level of concordance between the channel beds at the confluence entrance, it should be pointed out that this varied significantly from site to site.
Fig. 8 shows the distribution of the depth-averaged values of Vstreamwise and Vtransverse in CNS0 on 31 October 2014 and CNS8 on 30 April 2015. Large values of Vtransverse up to 1.0 m/s and to 1.4 m/s were observed on the Solimões side of the confluence in low-flow and relatively high-flow conditions, respectively. They were directed towards the Negro bank, while the point of zero velocity was around the location of the mixing interface.
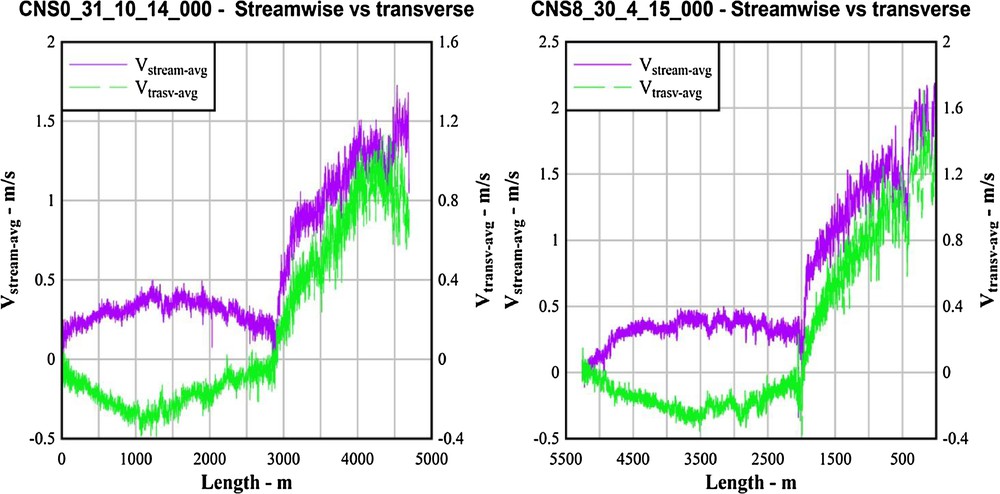
Streamwise and transverse velocity in CNS0 on 31 October 2014 (left) and CNS8 on 30 April 2015 (right).
4 Key observations on sediment transport
One of the objectives of the field campaigns was to study the interaction between hydrodynamics and sediment transport as well as morphodynamics about the Negro/Solimões confluence. Some preliminary observations about morphodynamics were presented in Trevethan et al. (2015b). From the analysis of the seismic profiles, Trevethan et al. (2015b) identified a rocky bed with fine sand cover on the Negro side of confluence, a mid-channel peak/bar of apparent sedimentary origin about the mixing interface and a bed consisting predominantly of coarser materials sediments on the Solimões side of confluence. In the central part of the confluence, Ianniruberto et al. (2018) showed outcrops of rocky terraces of the Alter do Chão Formation, indicative of sediment flushing, while large bed-forms indicating bed-load transport and downstream accretion were observed past a sharp cliff corresponding almost to the beginning of the hydrodynamic flow recovery region.
Fig. 9 presents the distribution with depth of the concentration of total suspended solids (TSS), in mg/L, on 30/10/2014 during FS−CNS1 at transect A0 (left) and A6 (right), that are 2.5 km and 11.7 km downstream of the confluence junction, respectively. Three depths were considered, i.e. at the water surface, −10 m and −20 m below the water surface.
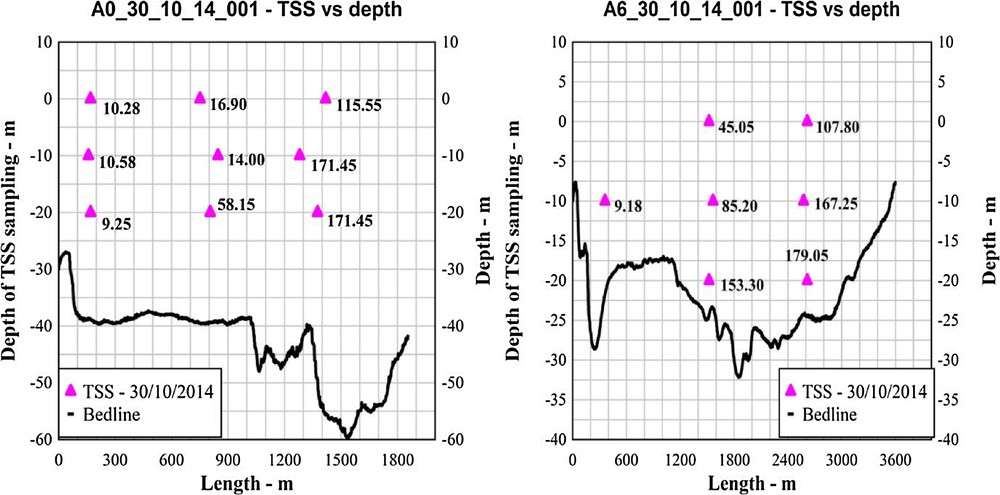
Distribution over the depth of TSS, in mg/L, on 30 October 2014 during FS−CNS1 at transects A0 (left) and A6 (right).
On the Negro side, the concentration was almost constant over the depth, in the order of 10 mg/L, while on the Solimões the TSS concentration increased with the depth, as expected. At mid-channel, in A0, at the water surface and at a water depth of 10 m, a very low TSS, typical of pure Negro waters, was observed, whereas at a depth of 20 m a value of 58 mg/L was measured. Further downstream, at A6, larger TSS values were observed on the water surface and at a depth of 10 m, whereas close to the bed, at a depth of 20 m, the TSS value was very similar to that typical of Solimões waters. Finally, the data show that the mixing between the rivers waters starts close to the bed, where the plume of sediment-laden flow enters from the Solimões side to the Negro pool and then extends to the lower depth. This confirms the findings from past studies in the area that have demonstrated that at the Negro/Solimões confluence the mixing interface is not vertical, but it is tilted due to the interaction between shear, density differences (Laraque et al., 2009), and it is consistent with studies conducted in other confluences of large rivers characterized by difference in water density and TSS concentration (Best et al., 2007; Gualtieri, 2011). Also, it is very likely that the flow patterns of the sediment-laden plume of Solimões waters are even strongly affected from the complex bathymetry of the confluence. Furthermore, the backscatter intensity data showed that the width of the mixing interface was initially in the order of hundred metres and ten metres in low and relatively high-flow conditions, respectively (Trevethan et al., 2015a), while downstream the width seemed depending on the interplay among different complex processes.
At the end, these findings suggest a different intensity of mixing between the two field surveys. This result is consistent with previous studies at the confluence of Rio Paraná and Rio Paraguay, in Argentina, where very different rates of mixing were observed upon different momentum ratios and basin-scale hydrological responses (Lane et al., 2008).
It is well-known that the bed shear stress or the shear velocity provide an index of the basic parameters of fluid force per unit area on the stream bed. Therefore, they have been related to sediment mobilization and transport in many theoretical and empirical studies of sediment transport, including the inception of sediment motion and the occurrence of bed/suspended load motion through the classical threshold Shields/Rouse numbers (Chanson, 2004). Hence, the bed shear stress was applied to characterize the interaction between hydrodynamics and sediment transport about the Negro/Solimões confluence. Various methods have been proposed to calculate the local bed shear stress, including reach-averaged relations, theoretical assumptions about structure of turbulence and direct measurements of turbulence. As in this study many ADCP transects were collected, the local bed shear stress was calculated using the approach proposed by Sime et al. (2007). They compared different methods to estimate the local bed shear stress from moving boat ADCP profiling. They found that the most precise method was a quadratic-stress approach, which used the vertically averaged mean velocity and a zero-velocity height based on bed grain-size information. So, they proposed that the bed shear stress is directly proportional to the local depth-averaged velocity magnitude as:
| (1) |
| (2) |
where κ is the von Kármán constant, e is the Euler number, and z0 is the height above the bed at which the velocity is zero. Following Wilcock (1996), they assumed in applying Eq. (2):
| (3) |
where d84 is the bed grain diameter such that 84% are finer. From Nordin et al. (1977), different values for d84 were used for the Negro, the Solimões, the confluence, and the Amazon rivers.
The data obtained using Eqs. (1), (2) and (3) are to be intended as skin (or grain) friction shear stress due to individual grains protruding into the flow (Chanson, 2004), which should be added to the form shear stress due to the presence of large macro-roughness elements and bedforms in the area of this study to gain the total bed shear stress.
From Equations (1) and (2), one can see that the bed shear stress depends even on the water depth. Using the above equations, the local bed shear stress was calculated for each ensemble gaining the distribution of the local bed shear stress along each transect.
Furthermore, bed shear stress can also be applied to approximate the maximum particle size in suspension (Trevethan and Aoki, 2009):
| (4) |
where ρs is the particle density and ν is the water kinematic viscosity. Therefore, this large reduction in bed shear stress about the mixing interface could lead to a significant decrease in the size of sediment that can be moved/suspended and consequently to the deposition of these sand particle at the mixing interface.
Table 6 lists the values of dss for both field studies. It can be observed that in the Solimões River as well as in the CHZ and in the Amazon River, the maximum suspended grain size was in the range of fine sand with larger values during the relatively high-flow conditions.
Maximum suspended grain size observed during FS−CNS1/FS−CNS2.
| Field survey | dss (m) | |
| Negro | FS−CNS1 | 0.094 |
| FS−CNS2 | 0.094 | |
| Solimões | FS−CNS1 | 0.184 |
| FS−CNS2 | 0.203 | |
| CHZ | FS−CNS1 | 0.170 |
| FS−CNS2 | 0.190 | |
| Amazon | FS−CNS1 | 0.189 |
| FS−CNS2 | 0.206 |
The map of the bed shear stress about the confluence of the Negro and Solimões Rivers on 31 October 2014 (Fig. 10[left]) and on 30 April 2015 (Fig. 10[right]) was obtained by kriging of the ADCP data, showing that large bed shear stresses up to 7 and 10 Pa on 31 October 2014 and 30 April 2015, respectively, were present on the Solimões side of the confluence and of the Amazon channel. The largest values corresponded to the area of the scour hole 1500 long, 700 m wide, and 70 m deep, which was identified using seismic and bathymetric data (Ianniruberto et al., [2018, this issue]) and even downstream of these. The lowest values of the bed shear stress were located in the Negro side of the confluence, in the stagnation and in the separation region on the Solimões side of the Amazon River.

Bed shear stresses about the confluence of the Negro and Solimões Rivers on 31 October 2014 (left) and on 30 April 2015 (right) during FS−CNS1 and FS−CNS2, respectively.
5 Conclusions
The paper presented some key results from two field surveys conducted in relatively low and high-flow conditions about the confluence of the Negro and Solimões Rivers, in the Amazon basin, which is one of the largest confluences on Earth. During these campaigns, large difference in flow rates and velocity as well as in water chemistry and suspended sediment were observed between the two rivers in both relatively low and high-flow conditions. About the confluence, a depth-averaged velocity magnitude up to 2.5 and 3.0 m/s was observed on the Solimões near the right bank on 31 October 2014 and 30 April 2015, respectively, while the Solimões waters were subjected to a strong change in direction to realign with the flow direction of the Amazon River.
First, the study described in this paper gained a quite comprehensive characterization in two different flow conditions of the basic hydrodynamics parameters about the confluence Negro and Solimões Rivers as well as of those affecting sediment transport. The distribution of bed shear stress could provide significant insights to explain the basic morphodynamic features about the confluence and the CHZ.
Second, several hydrodynamics features already identified in past confluence studies such as stagnation zone, velocity deflection and re-alignment zone, maximum velocity region, separation region with recirculation, flow recovery region, were observed during both field studies. However, a comparative analysis of the features demonstrated that some of them were significantly affected by the flow conditions observed in the two field surveys. Whilst no significant difference was observed about the extension of the velocity deflection and re-alignment zone, in relatively high-flow conditions the separation region was longer (from 2.5 to 4.0 km), the region of maximum velocity seemed more downstream, and the extension of the CHZ was slightly larger and even its endpoint was more easily identified.
Third, downstream the confluence, the difference between the depth-averaged velocity on the Negro and Solimões sides of the Amazon River decreased, indicating a process of momentum transfer that was comparatively weaker in high-flow conditions. Also, the width of the mixing interface in the initial CHZ was generally larger in low-flow conditions. These findings suggest a different intensity of mixing between the two field surveys, which is consistent with past studies on the confluence of large rivers (Lane et al., 2008).
Finally, the distribution over the depth of the concentration of total suspended solids (TSS) highlighted the entrainment close to the bed of a plume of sediment-laden flow from the Solimões side to the Negro pool of the Amazon channel. This finding is consistent with past observations on confluences with difference in density and TSS concentration (Best et al., 2007; Laraque et al., 2009). However, a further, more comprehensive investigation is needed to better identify the main mechanisms controlling the mixing of Negro and Solimões River waters, but this preliminary initial analysis suggested that the effect of lateral stratification and lateral forces from converging flows as well as of friction, change in channel width, and secondary currents should be considered to explain the complex three-dimensional mixing interface dynamics in a large river confluence.
Acknowledgements
The authors acknowledge this research was carried out within the Clim-Amazon European Laboratory in Brazil funded by grant agreement FP7 INCO-LAB No. 295091 from the European Commission and the partial support from the MIUR PRIN 2010–2011 Research Project HYDROCAR (CUP n. E61J12000210001). The authors acknowledge Dr. Mark Trevethan for his activity in the Clim-Amazon Project and the CPRM (Geological Survey of Brasil) for supplying the research vessel, instrumentation, technical assistance with sampling; Bosco Alfenas, Andrè Martinelli Santos, Daniel Moreira, Arthur Pinheiro, Paulo Melo, Nilda Pantoja, Andre Zumak, and João Andrade for their assistance with sampling during the field campaigns.