

1 Introduction
The deeply eroded roots of cratonic and metacratonic crust typically expose complex structures that were parts of orogenic belts, as exemplified by the Paleoproterozoic Formations reworked during the Eburnean Orogeny in Senegal (Dabo and Aïfa, 2010), as well as in the entire western border of the Congo Craton (Lerouge et al., 2006; Maurizot et al., 1986; Owona et al., 2011). Exhumed deep geologic structures appear at the surface in the form of lineaments that generally correspond to structural elements such as lithological contacts, foliation, schistosity, shear zones, fold hinges, faults, and fractures (Soesilo and Hoppin, 1986). Numerous studies have shown the effectiveness of satellite imagery remote sensing in revealing such lineament and their structures. In some cases, these lineaments host mineralizations, and hence constitute important targets for mineral exploration (Deslandes, 1990; Pouliot, 1986; Takodjou Wambo et al., 2016). The abundance of structures reported in the basement areas of Cameroon justifies the use of remote sensed geologic mapping in the currently investigated sector of the Abiete–Toko area. The aim of this study is to characterize the lithotectonic structures of the Abiete–Toko region through the combination of Landsat 7 ETM+/SRTM satellite imagery analysis and detailed geologic field mapping. This identification and mapping provide insights on the deformation phases that have affected the region, and may serve as a guide for gold prospection.
2 Geological setting
The Pan-African Domain in Cameroon is subdivided into three tectonic domains, namely the North (North-West Domain), the Central (Adamawa-Yade), and the South Cameroon Domains (Meridional Domain), separated by the Tcholliré–Banyo shear zone (TBSZ) and the Sanaga Fault (Fig. 1A; Mvondo et al., 2007a, 2007b; Ngnotue et al., 2000; Nomo Negue et al., 2017; Nzenti et al., 1998; Pinna et al., 1994; Toteu et al., 2001). The North Cameroon domain is limited to the south by the Adamawa Fault (AF), which extends up to the far North of Cameroon. It is characterized orogenically by a polyphase and polycyclic evolution (Ngako, 1986; Nzenti et al., 1992; Nzenti et al., 1999; Penaye, 1988; Toteu et al., 1987). It is composed of volcanic formations associated with the metasedimentary series of Poli.
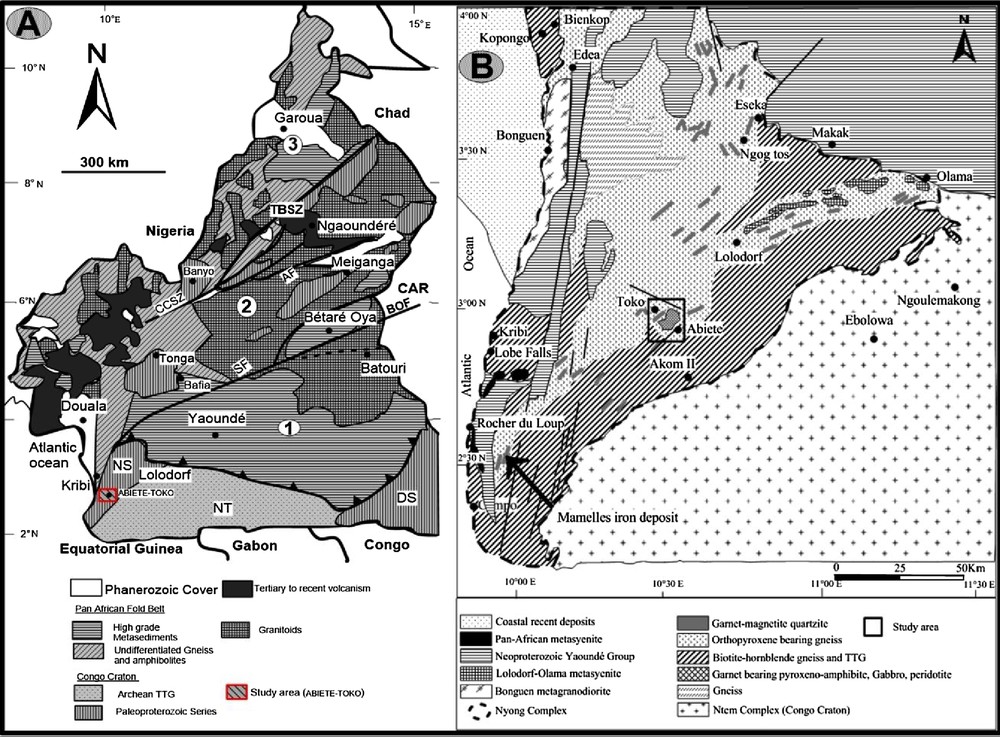
A. Geologic map of Cameroon (after Nzenti et al., 2011; Pinna et al., 1994) showing the localization of the study area (red square) and the main lithotectonic domains: (1) southern domain; (2) central domain; (3) northern domain; CCSZ: Central Cameroon Shear Zone; SF: Sanaga Fault; TBSZ: Tcholliré–Banyo shear zone; NT: Ntem Complex; DS: Dja series; NS: Nyong Series; AF: Adamawa Fault. B. Major geologic assemblages of South Cameroon (after Lerouge et al., 2006; Maurizot et al., 1986; Vicat, 1998).
The Central Cameroon domain occupies an intermediary position between the North and South Cameroon Domains, and corresponds to a geographical area oriented NE–SW, stretching from the north of Bafia to the south of Poli and marked by four major NE-trending fault zones, namely, the Central Cameroon Shear Zone (CCSZ), the Tcholliré-Banyo shear zone (TBSZ), a ductile transcurrent shear (Ngako et al., 2003; Nzenti et al., 1988), the ductile/brittle Betare Oya Fault (BOF) (Kankeu, 2008), and the brittle Sanaga Fault (SF)(Dumont, 1986). The abundance of syn-tectonic granitoids and orthogneissified leucogranites, granites and syenites of hyperpotassic, calc-alkaline to aluminous nature (Ganwa et al., 2008; Nzenti et al., 1994, 1998; Tanko Njiosseu et al., 2005) also characterize the Central Cameroon Domain.
The South Cameroon Domain is essentially represented by the Yaoundé Group. Here, two major lithological units are defined at the regional scale by a low- and a high-grade metamorphic assemblage composed of schists and quartzites belonging to the Mbalmayo–Bengbis–Ayos series to the south and Yokadouma to the east, and of gneisses, migmatites, micaschists, amphibolites and calcsilicate rocks, belonging to the Yaoundé series in the centre and Bafia series in the north, respectively. These different series are usually made up of Neoproterozoic volcano-sedimentary formations thrusting the belt formations on the Congo Craton (Barbey et al., 1990; Nédélec et al., 1986; Nzenti, 1987; Nzenti et al., 1984, 1998). The South Cameroon Domain is limited in its southern part by the northwestern margin of the Archean nucleus of the Congo Craton. The northwestern margin of the Congo Craton is made up dominantly of Archean rocks with some reworked material that formed during the Paleoproterozoic Eburnean orogeny (Lerouge et al., 2006; Owona et al., 2011).
The Abiete–Toko gold district is located in the Nyong Complex, between latitudes 2°49′–3°00′ N and longitudes 10°25′–10°35′ E (Fig. 1B). The current equatorial type climate, characterized by an average precipitation climatically constrained to 1800 mm/yr and an average temperature of 24 °C favours the development of a dense forest of equatorial type (Letouzey, 1985) and the formation of ferrallitic soils on the interfluves and hydromorphic soils downstream (Bilong et al., 1992). These make surface observation and mapping fairly challenging. The Nyong Complex is limited by the Atlantic Ocean in the Southwest, by the Pan-African orogenic front in the North and the Northeast, the Ntem Complex in the Southeast, and is capped by Quaternary formations of the Douala–Kribi–Campo sedimentary basin in the Northwest (Fig. 2). It is composed of metasedimentary and metavolcanic rocks that have recorded the Eburnean/Trans-Amazonian (2400 and 1800 Ma) high-grade tectonometamorphic event around 2050 Ma (Feybesse et al., 1987; Lerouge et al., 2006; Neves et al., 2006; Penaye et al., 2004).
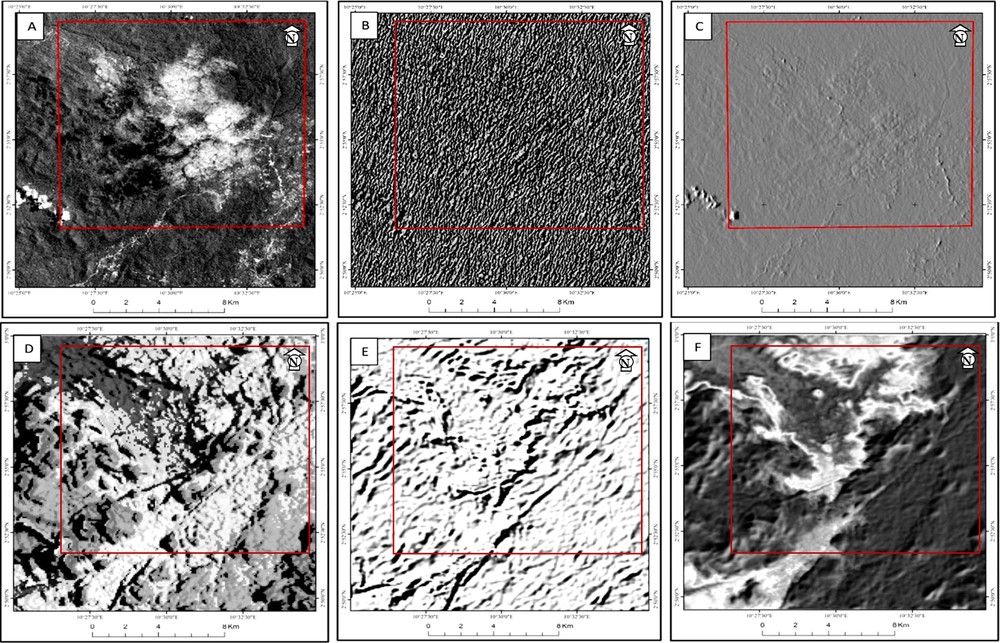
Landsat 7 ETM+ and SRTM Images of the study area. A. Orignal Landsat image. B. Landsat image after Sobel filtering. C. Landsat image after PCA analysis. D. Orignal SRTM image. E. SRTM image after Sobel filtering. F. SRTM image after PCA analysis.
The Nyong Complex is characterized by a D1–D3 polyphase deformation during the Eburnean orogeny, with prominent Liberian D1 schistosity (N050E to N060E) and foliation (Maurizot et al., 1986) and D2 shear zones (Feybesse et al., 1998; Lerouge et al., 2006; Owona et al., 2011; Penaye et al., 2004; Toteu et al., 1994). Microstructures indicate dynamic recrystallisation under granulite conditions (Owona et al., 2013). According to Apolinarski et al. (1980), the Abeite–Toko area hosts mainly granulitic rock formations and its morphology is marked by horsts and grabens. Some studies point out the alluvial gold potential of the Nyong Complex, more precisely in Abiete, where the gold grade in some streams vary from 0.35 g/m3 to 1.22 g/m3 (Milési et al., 1980) and 3.7 g/t at Ako’ozam-Akom II (Fuanya et al., 2014). This alluvial gold could originate from the mobilization of primary vein minerals (Eno Belinga, 1984; Ngo Bidjeck, 2004).
3 Data analysis
3.1 Satellite data
To visualize the geological elements at the surface, we use a combination of SRTM topographic data and Landsat images (210-913 scene) acquired by the satellite Landsat 7 ETM+ (Path 186 and Row 059 of 22 December 2003) under favourable climatic conditions (dry season). The choice of these images and data was justified by their spectral characteristics, which allows for structural analysis and their good spatial resolution (30 m), favouring a fair accuracy mapping on a large scale. The main characteristics of the Landsat satellite images used in this study are presented in the Supplementary Material.
Remote sensing is the total sum of techniques that allow the acquisition of information (principally in the form of images) on the whole earth or part of its surface, without any direct contact with the latter. It generally involves the processes of capture and saving energy from an emitted or reflected electromagnetic radiation, through processing and analysis of the information and representation of the result in the form of images (Rouse and Haas, 1973; Scanvic, 1983; Takodjou Wambo et al., 2016). This technique allows for the observation of very wide surface areas, providing large spatial accuracy, and therefore represents an excellent source of information useful for the lithostructural mapping of a region (Scanvic, 1983; Takodjou Wambo et al., 2016). This work has for main objective the lithostructural mapping of the study area using a combination of automatic/manual extraction of major lineaments (structural elements) from satellite images and classical geologic mapping. To achieve this, image processing and mapping pieces of software such as ArcGIS 10, ERDAS IMAGINE 2014, and Geomatica 2012 were used, to automatically extract the major lineaments within the area. Then detailed field geologic mapping was carried out to confirm the existence and to further study these lineaments.
3.2 Specific processing
Remote sensing studies generally make use of the digital formats of satellite images, because they offer multiple possibilities for analyses. However, these digital images carry numerous types of information on different kinds of objects at the ground surface and so they need to be filtered to isolate the geological structures from the surrounding non-geological information. Numerous filtering techniques exist. Katartzis et al. (2001) used a model that combined both geometric and radiometric properties of the linear geological features they aimed to extract. The Hough Transform (HT) is an automatic analysis technique used for the detection of linear features in a variety of applications. Principal Component Analysis (PCA) was applied by Karnieli et al. (1996) and Nama (2004) on Landsat Enhanced Thematic Mapper imagery (ETM+) to reveal the extent of the deformation caused during the volcanic eruptions in 1999 on Mount Cameroon. PCA, which is part of a group of multidimensional descriptive methods called factorial methods, was used for compressing redundant data of multi-band images to obtain a combination of the most discriminatory colourful composition (Duby and Robin, 2006). Ali and Pirasteh (2004) showed that tectonic structures in southwestern Iran could be delineated through contrast stretching of Landsat 7 ETM+ Band 4. Kenea (1997) and Suzen and Toprak (1998) showed the effectiveness of combining different processing techniques to improve the contrast of images, making them more expressive and thus better revealing geological discontinuities and faults. All these methods are based on edge filtering techniques using digital filters such as the Laplacian, Sobel, and VanderBrug operators (Sukumar et al., 2014).
PCA is advantageous over the other methods in that it can produce uncorrelated output bands, segregate noise components, reduce the dimensionality of data sets and produce more colourful colour composite image. We thus use it here in combination with the Sobel filtering method. The latter detects abrupt changes in the grey level of neighbouring pixels.
Following Yésou et al. (1993) (Fig. 3, Table 1), we applied the Sobel directional filters and gradient in four directions: north–south, east–west, NE–SW and SE–NW (Gronayes et al., 2003; Koffi Yao et al., 2012; Ouattara et al., 2012; Takodjou Wambo et al., 2016; Youan Ta et al., 2008).
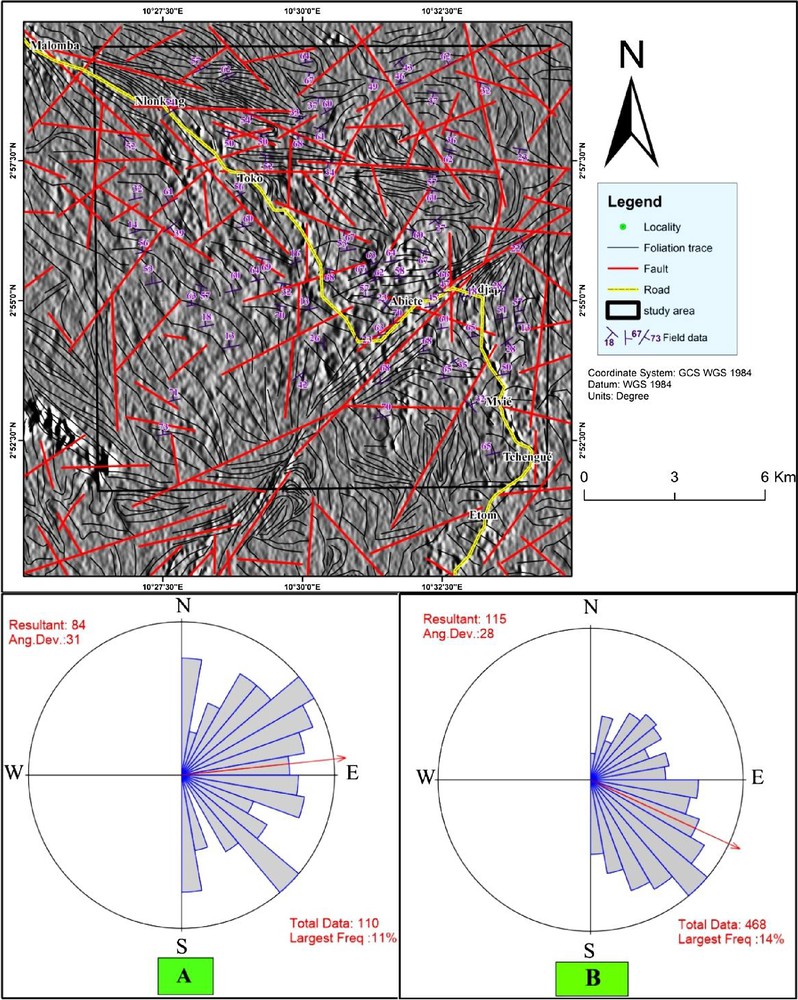
Major accidents enhanced by Sobel filtering and the gradient of Yésou et al. (1993) applied to the PCA1 image and subjected to automatic extraction with the associated directional rose.
Convolution matrixes of the Sobel 7 × 7 filter and the gradient of Yésou et al. (1993).
| Sobel N–S | ||||||
| 1 | 1 | 1 | 2 | 1 | 1 | 1 |
| 1 | 1 | 2 | 3 | 2 | 1 | 1 |
| 1 | 2 | 3 | 4 | 3 | 2 | 1 |
| 0 | 0 | 0 | 0 | 0 | 0 | 0 |
| −1 | −2 | −3 | −4 | −3 | −2 | −1 |
| −1 | −1 | −2 | −3 | −2 | −1 | −1 |
| −1 | −1 | −1 | −2 | −1 | −1 | −1 |
| Sobel E–W | ||||||
| −1 | −1 | −1 | 0 | 1 | 1 | 1 |
| −1 | −1 | −2 | 0 | 2 | 1 | 1 |
| −1 | −2 | −3 | 0 | 3 | 2 | 1 |
| −2 | −3 | −4 | 0 | 4 | 3 | 2 |
| −1 | −2 | −3 | 0 | 3 | 2 | 1 |
| −1 | −1 | −2 | 0 | 2 | 1 | 1 |
| −1 | −1 | −1 | 0 | 1 | 1 | 1 |
| Sobel NE–SW | ||||||
| 0 | 1 | 1 | 1 | 1 | 1 | 2 |
| −1 | 0 | 2 | 2 | 2 | 3 | 1 |
| −1 | −2 | 0 | 3 | 4 | 2 | 1 |
| −1 | −2 | −3 | 0 | 3 | 2 | 1 |
| −1 | −2 | −4 | −3 | 0 | 2 | 1 |
| −1 | −3 | −2 | −2 | −2 | 0 | 1 |
| −2 | −1 | −1 | −1 | −1 | −1 | 0 |
| Sobel NW–SE | ||||||
| 2 | 1 | 1 | 1 | 1 | 1 | 0 |
| 1 | 3 | 2 | 2 | 2 | 0 | −1 |
| 1 | 2 | 4 | 3 | 0 | −2 | −1 |
| 1 | 2 | 3 | 0 | −3 | −2 | −1 |
| 1 | 2 | 0 | −3 | −4 | −2 | −1 |
| 1 | 0 | −2 | −2 | −2 | −3 | −1 |
| 0 | −1 | −1 | −1 | −1 | −1 | −2 |
| Yésou et al. (1993) | ||||||
| 1 | 1 | 1 | 1 | 1 | 1 | 1 |
| 1 | 1 | 1 | 1 | 1 | 1 | 1 |
| 1 | 1 | 1 | 1 | 1 | 1 | 1 |
| 0 | 0 | 0 | 0 | 0 | 0 | 0 |
| −1 | −1 | −1 | −1 | −1 | −1 | −1 |
| −1 | −1 | −1 | −1 | −1 | −1 | −1 |
| −1 | −1 | −1 | −1 | −1 | −1 | −1 |
3.3 Extraction of the lineaments using photo-interpretation
Automatic and manual extraction of the lineaments from the satellite images was carried out and a geographic information system (GIS) revealing the whole network of anthropic lines (road network, delimitation fronts of forests and cultivated areas, etc.) was also generated. This data set was then superimposed on the field geologic mapping data to isolate lineaments of tectonic origin. On the one hand, we performed manual mapping from the analysis of all linear structures observed on the transformed, enhanced and filtered satellite image. On the other hand, we conducted an automatic extraction of the major lineaments with the software Geomatica 2012, which uses three algorithms to automatically detect lines of pixels as vector elements by examining the local variance of the grey level in a digital image. This automatically enhances and outlines the lineaments on the image (Koçal, 2004; Koike et al., 1995). We then compared the two data sets. The map of the network of fractures was eventually obtained from the validation of the automatically extracted network of lineaments with that on the field.
3.4 Field data
Field investigations focused on detailed lithostructural analysis of outcrops exposed in nine open trenches, with five oriented north–south and four oriented east–west. The spacing between the trenches is 3 km. Records of the lithologies making up each outcrop as well as geological measurements (foliation, lineation, schistosity, folds and fractures) were made.
4 Results and discussion
The entire processing on the Landsat 7 ETM+ image helped to improve the image contrast, which highlighted the linear structures and facilitated the lineament's photo-interpretation (Fig. 2). The identified lineaments show linear traces sporadically interrupted by curved traces. Two main types of lineaments were distinguished. Type-I lineaments (black colour on the map), observed in the field to mostly penetrate the outcrops are interpreted to represent foliation traces (Takodjou Wambo et al., 2016). Type-II lineaments (red colour on the map) correspond to regional structures as they generally extend over large mapped areas, show a more pronounced trace, and a sparser spatial density. These type-II lineaments are interpreted to be faults and fractures. These interpretations are confirmed by field data plotted on rose diagrams. The rose diagrams reveal that the faults have NE–SW and NW–SE, with a mean direction around west–east (red arrow on (A) rose diagram). The foliation traces (here (B) rose diagram) have a dominant NW–SE trend and secondary WNW–ESE and east–west orientations. Their mean direction is WNW–ESE (red arrow).
4.1 Field mapping
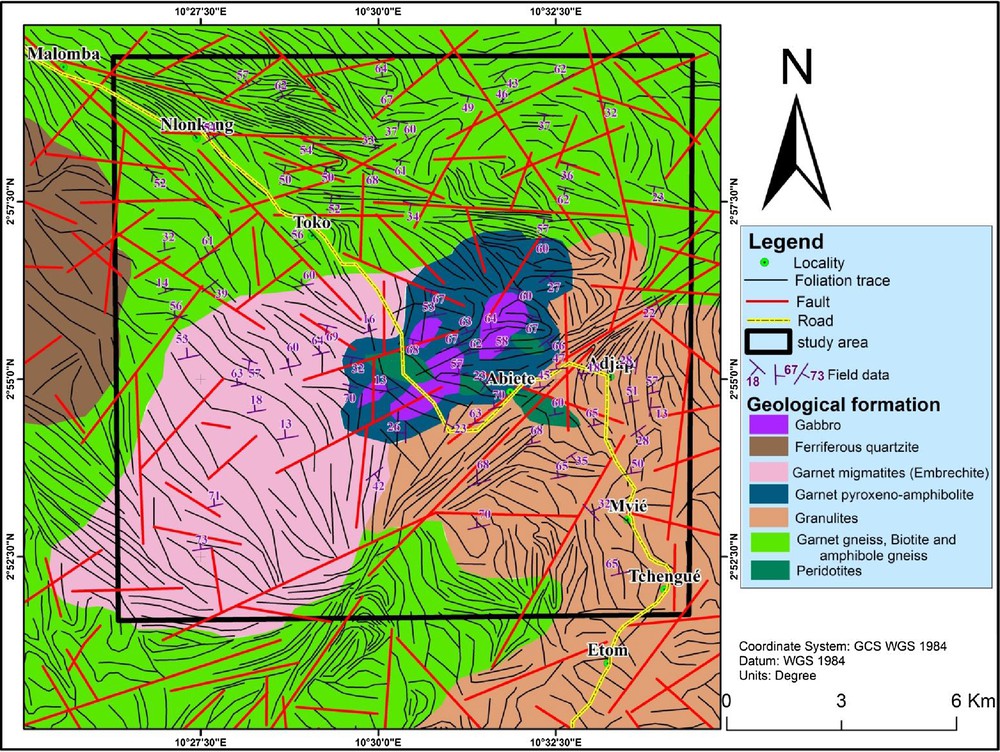
The lithology consists of Grt + Bt + Amp-bearing gneisses, Grt-bearing migmatites, granulites, Grt bearing pyroxene-amphibolites, gabbros and peridotites. Grt + Bt + Amp-bearing gneisses occur as blocks on top of hills, limbs and deep valleys or bed of rivers. Grt bearing migmatite are embrechites showing a net foliation and granoblastic beds of quartz and thick feldspars. Granulites crop out as large domes and usually have a brecciation texture (stockwork). Grt-bearing pyroxene–amphibolites are observed in decimetric to decametric blocks on limbs. They contain locally quartz veins of variable thicknesses. The gneisses, migmatites, granulites, and peroxene amphibolites have been deeply affected by the tectonic structures described above (Fig. 4). Gabbros occur as NE–SW dykes fractured in blocks of metric to decametric dimensions, with a Pl + Px + Amp mineralogical composition. Peridotites occur as metric to hectometric dykes dominantly trending N120–130°E. They transform themselves into serpentinite in the contact zone with chlorite-rich talc schist.
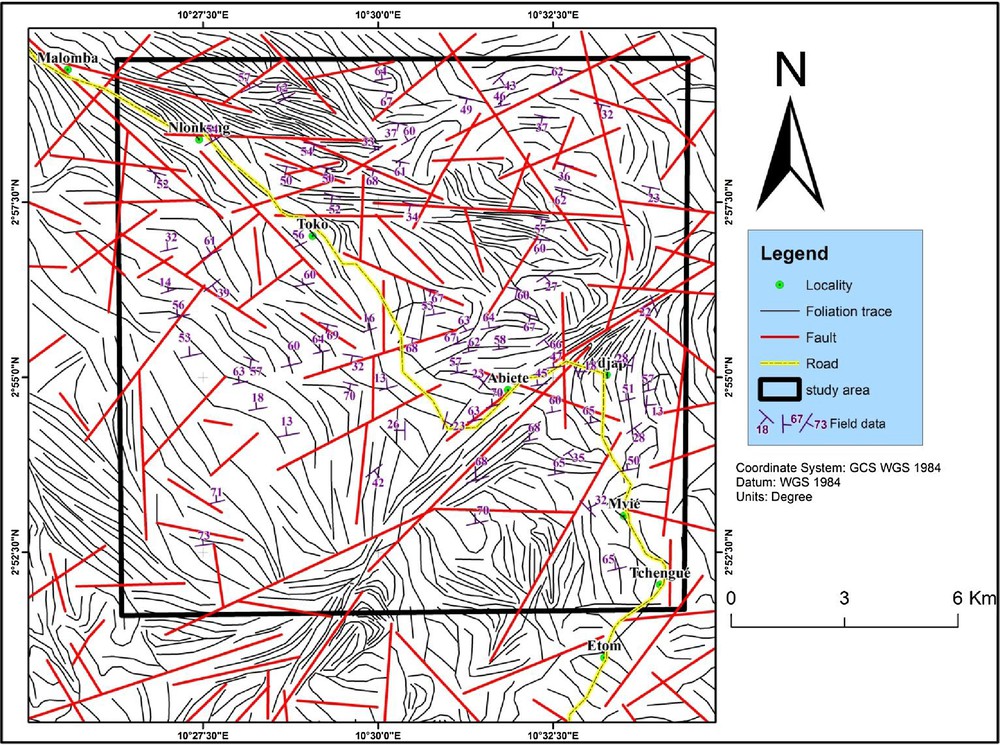
Structural map of the region of Abiete–Toko, established from the analysis of ETM+ Landsat 7 images.
4.2 Structural mapping and characteristics of the lineaments
Numerous discontinuities became visible on the satellite image after the above filtering methods were applied. Their geological nature was confirmed through their comparison with field data. The analysis of the textural attributes of the images (characterized by the resolution of the image, the topographic discontinuities that are visible on the image, and the association of various geological objects such as crest lines, the alignment of the mountain ranges and visible on the cartographic scale) favoured the mapping of curvilinear structures. Fig. 4 illustrates a high density of lineaments of various lengths ranging from 1.5 to 16 km. The total length of the mapped lineaments is approximately 430 km. The most important zone of lineaments (13–16 km long) crosses the study area in the WNW–ESE and NE–SW directions, passing north of Toko and east of Abiété. Other lineaments have lengths less than 12 km. More than 92% of the lineaments have lengths less than 5 km; only 1.3% of them have a length greater than 10 km; small lineaments are therefore the most abundant ones.
4.3 Structural significance of the lineaments
The lineament map reveals multiple fracture nodes, that is, intersections of lineament zones (Fig. 4). These nodes, comprising intersections of fractures, have a significant water potential and may correspond to areas of high mining potential. The fracture network shows structures cross-cutting each other, showing that they are asynchronous. In particular, north–south-trending strike-slip faults are found to be cross-cut by ENE–WSW to east-west faults. A similar observation was made by Lerouge et al. (2006), Maurizot et al. (1986), Owona et al. (2011), and Tchameni et al. (2001) for the north–south Liberian faults offset by the east–west Eburnean structures Trans-Amazonian orogeny following the collision of the Congo and San Francisco cratons between 2400 and 1800 Ma (Maurizot et al., 1986; Tchameni et al., 2001). The field observations confirm that the curvilinear structures are sets of foliation.
Faults concentrate along narrow zones trending both WNW and north-east. The marked deformation trend in both directions added to the net transverse strike-slips between the lineaments, suggests the existence of two major shear zones in the area. The apparent sense of shear deduced from field observation of the network of shares (Dresen, 1991) is dextral on the WNW–ESE-trending lineament zone, while it is sinistral along the NE–SW-trending fault zone.
4.4 Deformation phases
Three deformation phases were identified in the field: D1, D2, and D3.
The first deformation phase D1 is revealed by chloritic rocks rich in talc that display a Sc1 schistosity trending N050E to N060E with very low dips. Gneisses and amphibolites are characterized by a S1 foliation with a similar attitude. The foliation carries a mineral-stretching lineation L1 represented by the elongated quartz crystals with a N130°E direction.
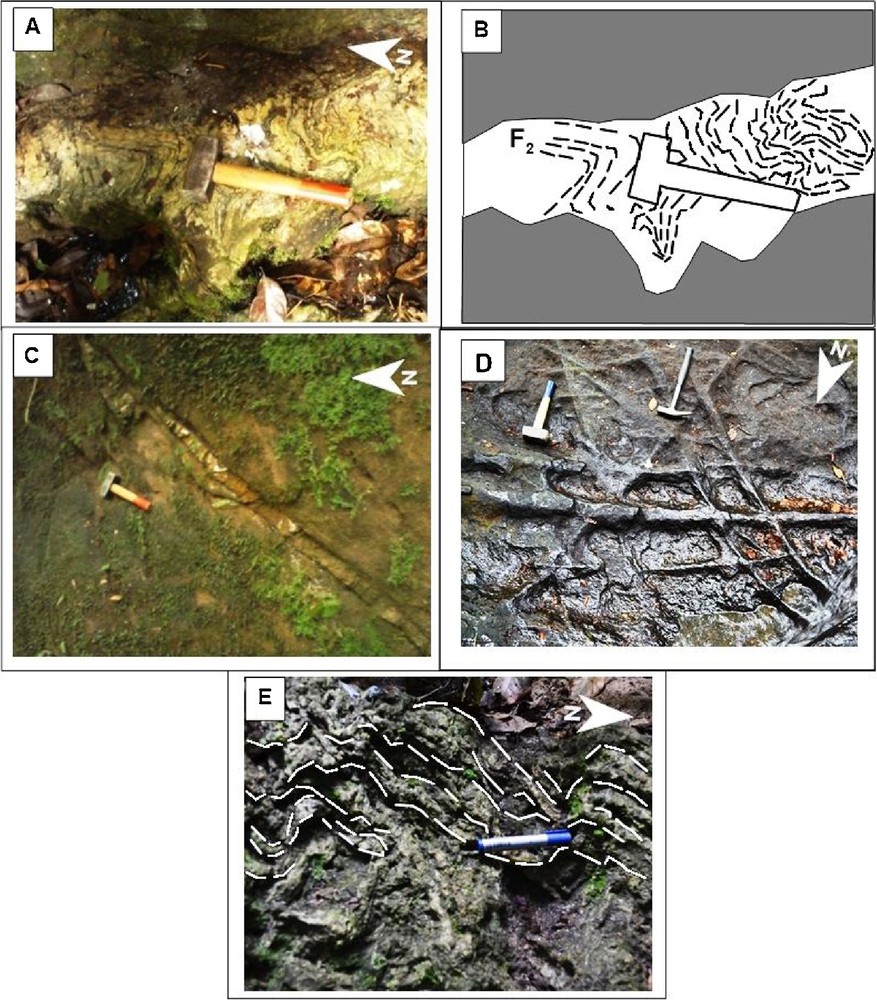
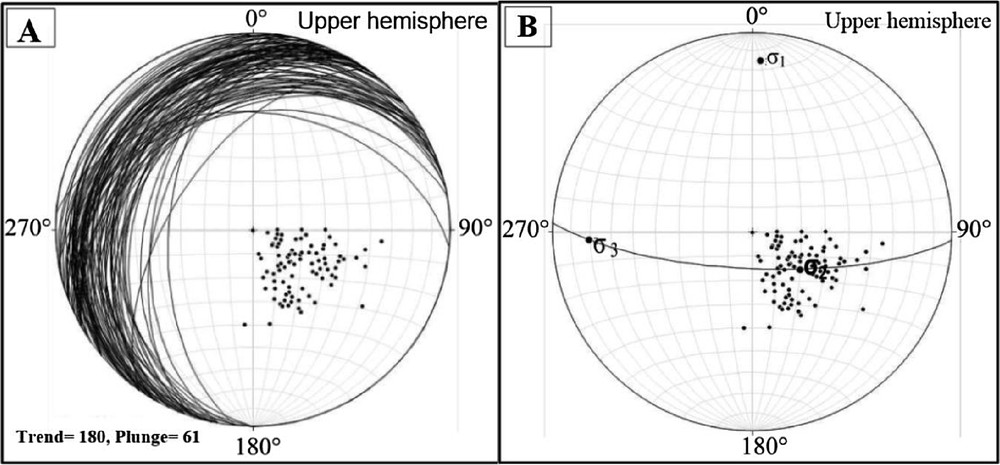
The second deformation phase D2 is characterized by a foliation S2 which is an alternation of thick mineral bands and regular F2 folds, encountered mainly in gneiss. The folds also form fold trains characterized by a high variability in their degree of opening. All these folds have an axial plane direction N010E to N050E with a low dip (Fig. 5). In migmatite, this foliation is syn-migmatitic, marked by the alternation of leucosomes with mesosomes and melanosomes. D2 is thus interpreted as a NNE–SSW shortening phase. The analysis of the stereogram of the poles of foliation planes helps determining the contemporary main axes of deformation of the D2 phase: σ1, N003E 15N; σ2, N132E 65 SE; σ3, N088E 19W (Fig. 6A–B). Comparing the angles of dip of the deformation axes, σ1 and σ3 are sub-horizontal and σ2 sub-vertical. Thus φσ2 > φσ3 > φσ1, hence the D2 phase is attributed to a sinistral strike-slip tectonic regime linked to a NNE–SSW shortening direction.
Stereographic projection of the foliation poles (A) and of the D2 deformation system (B).
Images of some structural elements. A and B. S1 affected by F2. C. Fracture filled by a mineral assemblage comprised of quartz and felspar. D. Fluid-assisted brecciation leading to a stockwork texture. E. F2 in accordion trains affecting S1 on a gneiss outcrop.
The third deformation phase D3 is responsible for the activation of various fractures denoted by f3. Some of these fractures are closed, while others form quartzo-feldspathic veins that cross-cut the other deformational structures at various levels. These fractures are generally oriented N125E50N and affect the D1 and D2 structures (Fig. 6C). The proposed geologic map (Fig. 7) results from the superposition of the structural map (Fig. 4) and of the lithological map. The two major lineament structures on the structural map correspond to the river channels of two major rivers of the sector, which are the Tchangué and the Kienké, oriented WNW–ESE and NE–SW, respectively. Hence, the drainage pattern of the area is guided by the fracture network.
Lithotectonic map of the region of Abiete–Toko, established from the analysis of ETM+ Landsat 7 images.
5 Conclusions
The application of remote sensing principles governing the implementation of a tele-analytical map helped identify and characterize the principal structural lineaments associated with the Proterozoic (Eburnean) tectonic events within the Abiete–Toko gold district. The resulting structural map highlights the foliation traces and the fracture network. Structural elements predominantly localize along two principal zones, trending WNW–ESE and NE–SW. The WNW–ESE shear zone is dextral and the NE–SW shear zone is sinistral. Besides foliation fault traces, our results suggest a ductile/brittle polyphase deformation D1–D3 at the local scale, marked by several structures, particularly a S1 foliation, Sc1 schistosity, L1 lineation, F2 folds, and f3 fractures. The second phase of deformation D2 is the dominant one and is characterized by regular folds. These folds have an axial orientation N010E to N050E, with low dip. The synthesis of the collected data suggests a north–south and NE–SW shortening direction expressed by folds and localized strike-slip shear zones. These results attest to the applicability of this mapping methodology to the study of regional tectonic events. The successful application of this method in the Abiete–Toko region could serve as an incentive to expand this analysis to the surrounding areas, especially for understanding the arrangement of structures and better integrating the tectonic architecture at a regional scale. This work could also serve as a guide to mineral exploration as it reveals the lineaments that mineralising fluids could have followed.
Acknowledgments
The data presented here form a part of the first author's PhD thesis supervised by L.M. Bondjè Bidjeck and L.D. Bitom at the University of Yaoundé-I. The authors are grateful to Professors Owona Sébastien (“Université de Douala”) and to the reviewers, Tahar Aïfa (“Université de Rennes-1”), and Olivier Vanderhaeghe (“Université Paul-Sabatier, Toulouse-3”) for their constructive comments and suggestions on an earlier version of the manuscript.