

1 Introduction
Fluids are present in the upper crust and are usually related to either underground resources (water, oil, and gas) or natural hazards. One major probe to infer where fluids are present and how they are moving at depth is through seismic monitoring and imaging. For instance, in natural hazard assessment, seismicity is indeed used to monitor volcanic eruptions and magma upwelling (De Barros et al., 2013; McNutt, 2005). Anthropogenic activities in reservoir operations such as fluid storage or extraction also induce seismicity. For examples, induced seismicity has been observed in deep geothermal fields (e.g., Lengliné et al., 2017; Wei et al., 2015), during gas storage into depleted reservoir (e.g., Cesca et al., 2014), and induced by CO2 geological storage (Payre et al., 2014) or gas and hydrocarbon extraction (Albano et al., 2017; Bardainne et al., 2008). In recent years, unconventional shale gas exploitation strongly increases the seismicity rate around the reservoirs, in particular in the central United States and Western Canada (e.g., Bao and Eaton, 2016). While in Oklahoma (USA) the seismicity is mainly induced by the large volume of waste water injected below the shale layers (e.g., Keranen et al., 2014; Schoenball and Ellsworth, 2017), the seismicity in Western Canada might be produced by the fracking process itself (Atkinson et al., 2016). Earthquakes are also observed during and after hydraulic dam fillings (e.g., Gupta et al., 2017). Recent observations at fluid injection sites indicated that induced earthquakes can reach magnitudes up to Mw ∼ 6, as the Prague and Pawnee earthquakes in Oklahoma (USA). Therefore, seismic hazard due to anthropogenic activity is a major concern and should be mitigated.
It is now well known that fluid pressure induces failures, by decreasing the effective normal stress acting on faults and fractures, which brings the stress state close to the failure envelope. Therefore, when the fluid pressure reaches a failure threshold, an earthquake occurs if sufficient frictional weakening occurs. Within this idea, the seismicity should follow the fluid pressure diffusion, and the measure of the seismicity front could lead to an estimation of the diffusivity of the medium (Shapiro, 2015). Consequently, as the size of the pressurized volume increases with the volume of injected fluids, the length of the faults which get close to failure also increases. Therefore, the maximum magnitude of the induced seismicity should scale with the injected volume (McGarr, 2014).
However, the response of a faulted medium to fluid pressure perturbation can be much more complex. Firstly, the seismicity may occur far and much deeper from the injection, as observed in Oklahoma, where wastewater disposals induced seismicity more than 40 km away from the injection (Schoenball and Ellsworth, 2017; Yeck et al., 2017). The seismicity may also be delayed in time, with the largest event occurring after the shut-in of the injection, as observed at the Basel geothermal field (Mukuhira et al., 2013). Furthermore, only a fraction of the energy injected into the reservoirs is converted to seismicity, as a large part of the deformation may not express seismic signatures (Guglielmi et al., 2015a; Schmittbuhl et al., 2014). For instance, a large aseismic motion was induced by the geothermal field of Brawley in southern California (Wei et al., 2015), which, in turn, triggered two M ∼ 5 earthquakes. At the laboratory scale, Goodfellow et al. (2015) showed that the seismic energy represents less than 1.25·10−4% of the injection energy during hydraulic fracture tests, highlighting that aseismic deformation represents a large part of rupture mechanisms.
Therefore, the relationships between fluids, earthquakes and aseismic deformation are still under debate, and detailed observations near injection wells are rare, even if the understanding of induced seismicity is crucial for reservoir engineering and hazard mitigation. In order to get well-constrained data close to injection and to investigate the seismological and hydromechanical behavior of the pressurized rock volume, we have developed a series of innovative in-situ experiments at a decameter scale. The main idea is to reactivate well-identified geological structures belonging to mature fault zones in shale and limestone at about 300 m depth. To do so, high-pressure water is directly injected into them. Around the injection zone, a dense network of geophysical sensors allows the simultaneous monitoring of the hydrological, mechanical, and seismological responses of the ruptured faults over a broad frequency band, from static to high frequency (10 kHz). Such experiments therefore benefit from realistic in-situ conditions, well-characterized geological structures, controlled hydraulic perturbations, and a multi-parametric monitoring network at close distance (meter to decameter) from the injection.
In this paper, we first describe the two injection experiments performed in fault zones nested in low- and high-permeability rocks, together with the seismic and hydromechanical responses of the tested geological structures. Importantly, these experiments provide new complete dataset for seismological and hydromechanical characterization and show unequivocally that most of the deformation induced by the fluid injection is aseismic. In the light of the coupled analysis of the data, we therefore suggest that the seismicity is only a secondary response to the fluid pressure, and that seismicity is rather triggered by aseismic deformation caused by the injection.
2 Data and experiments
2.1 Geological context and injection procedure
The experiments aim at injecting high-pressure water (1 to 5 MPa) into selected existing geological features (e.g., fault, fracture, bedding plane), in order to induced slips on the tested structures. Those experiments took place in underground research laboratories, at about 300 m depth. This depth allows a stress state that favors shear motions of the tested structures. From the galleries, boreholes were drilled, to intersect the different geological structures of a mature fault zone. Inside the injection borehole, the SIMFIP probe (Guglielmi et al., 2013) isolated a 2.5-m-long chamber with a straddle packer system. The probe is a new borehole tool that allows water injection together with simultaneous measurements of the fluid pressure and of 3D mechanical displacements. With this probe, water was injected into the geological structures that crosscut the sealed section of the borehole. The injection sequences were design to (1) test the pore-elastic response of the medium with low-pressure injections (e.g., pulse tests of short duration, some minutes) and (2) induce the mechanical shearing and opening of existing fractures with a step-by-step increasing pressure. The pressure increase however stays below the fracturing pressure, since the aim of such experiments is to reactivate existing faults and is not to induce fluid driven hydro-fractures.
The first experiment of this type was performed in 2010 into the fractured limestone of the Low Noise Underground Laboratory of Rustrel (southern France). The experiment consisted in injecting water in a high-permeable fault zone. The hydromechanical and seismological measurements showed unprecedented and direct evidence of an aseismic motion preceding seismic failures (Guglielmi et al., 2015a). However, this experiment suffered from a very limited number of seismic sensors, which prevented the in-depth analysis of the seismic responses (Derode et al., 2015). To resolve this limitation, similar experiments took place again in the same facility, in 2015, with a denser monitoring network made up of 31 seismic sensors around the injection (from 1 to 20 m) (Duboeuf et al., 2017). Injections were performed at 11 different locations (Fig. 1A), to test the responses of either (1) the sub-horizontal bedding planes that separate layers with different facies, and (2) the minor faults or fractures, belonging to the extended damage zones of a kilometer-long fault (Jeanne et al., 2012). Results confirmed that most deformation is aseismic in these experiments, with seismicity mainly occurring at distance (1 to 12 m) from the injection.
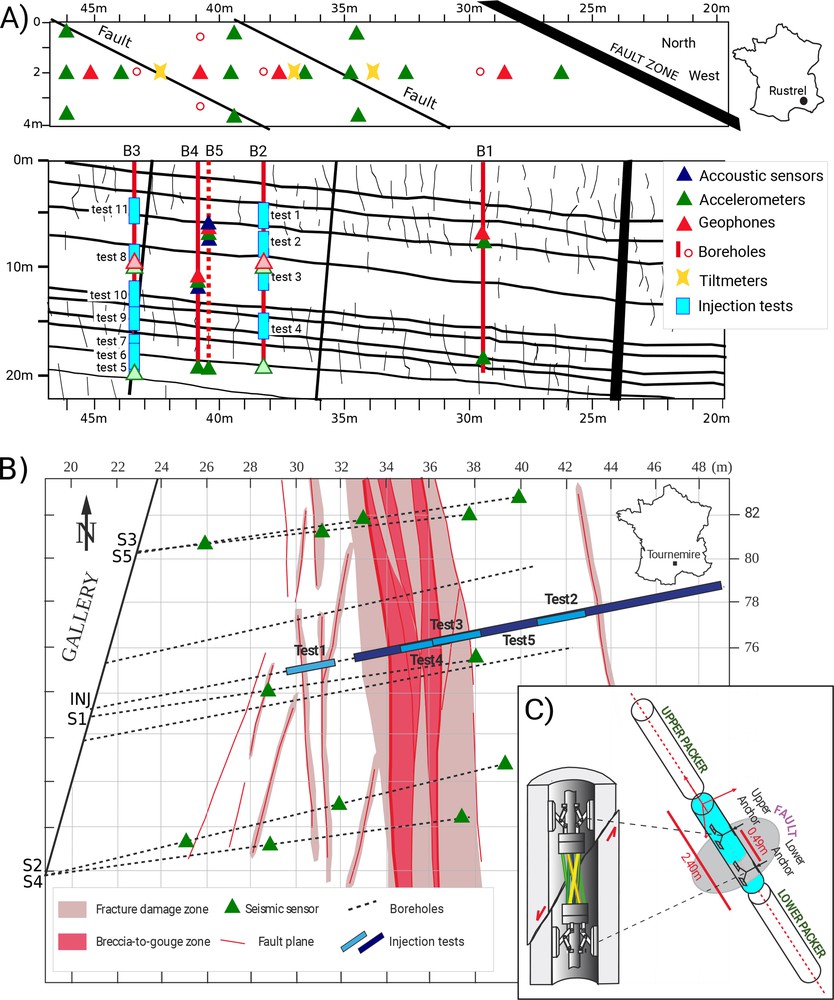
Experimental setup of the experiments. A. Map view of the gallery and vertical cross-section, showing the locations of the monitoring network and the injection tests, in the Rustrel limestone (see Duboeuf et al. (2017) for details). B. Map view of the experiment in the Tournemire shale with the schematic structures of the fault zone and the location of the injection tests and the seismic sensors (see De Barros et al. (2016) for details). C. Schematic view of the SIMFIP injection probe, and details on the optic-fiber strainmeter anchored in the injection chamber.
In order to test another lithology and investigate seismicity in low-permeable formations, a set of experiments (De Barros et al., 2016; Guglielmi et al., 2015b) was conducted in 2014 in the Toarcian shale of the IRSN underground experimental platform of Tournemire (France). Here, the injection borehole fully crossed a kilometer-long fault zone, and 4 injections were performed in different geological structures: (1) minor faults in the damaged zones, (2) the unfractured medium, (3) fractures in the damaged zone, and (4) the fault core (Fig. 1B). In top of the responses of those isolated structures, the full thickness of the fault zone, including the fault core and the western damages zone, was tested using a 15-m-long portion of the borehole as injection.
2.2 Monitoring network and data
Both injection experiments (limestone in Rustrel, 2015 and shale in Tournemire, 2014) were instrumented with a dense monitoring network in order to record in high detail the hydrological, mechanical, and seismological responses (Fig. 2) of the hydraulically-stimulated structures. Inside the injection chamber, the newly developed SIMFIP probe allowed the simultaneous measurements of the injected pressure, the flow rate, and the 3D motions of the injected structures. This borehole strainmeter (Fig. 1c), based on optical-fiber Bragg grating measurements, was anchored on the borehole walls, independently from the injection system (Guglielmi et al., 2013). It captured deformations as small as 1 μm/m. At a few meters from the injection, deformation was also recorded by three two-components tiltmeters set on the gallery floor in the Rustrel experiment. At Tournemire, a borehole was equipped with 40 extensometric gauges, distributed on a 12-m-long probe.
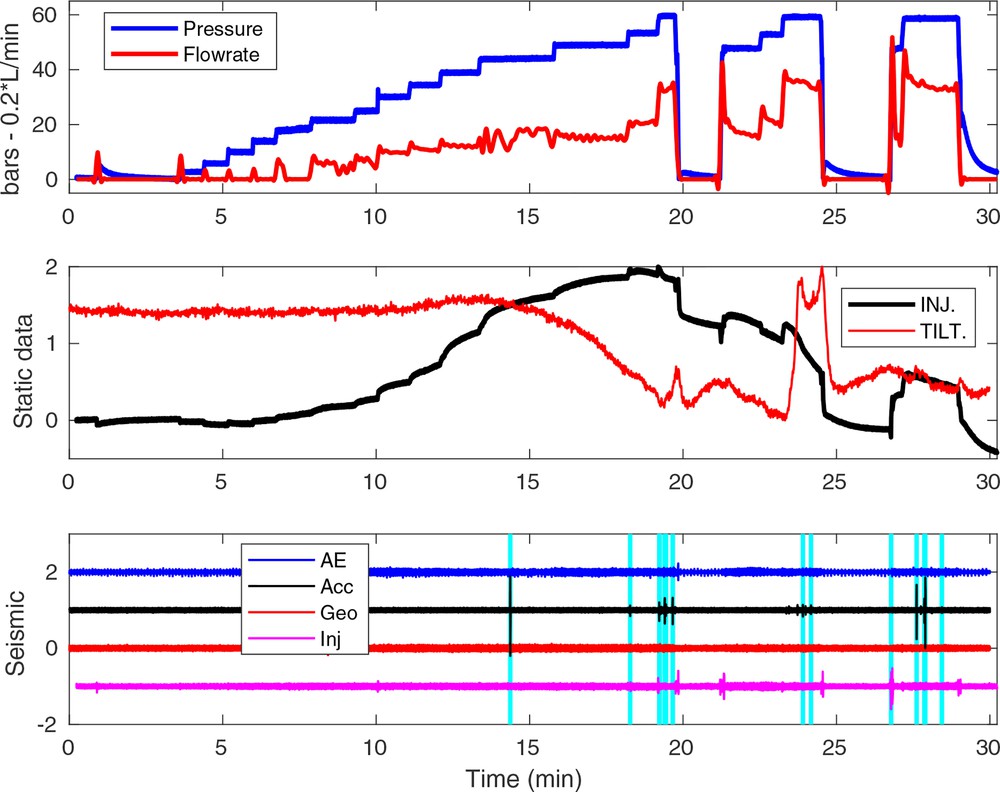
Example of data recorded during step-rate injections in test 11, Rustrel. Top panel: hydraulic data, with pressure and flow rate at the injection; middle panel: quasi-static data, with one component of the deformation (INJ) at the injection point and of a tiltmeter (TILT) set on the gallery floor; bottom panel: high-frequency data, with high-pass filtered deformation (Inj, 10–500 Hz) at the injection point, geophone (Geo, 10–800 Hz), accelerometric (Acc, 0.1–4 kHz) and acoustic (AE, 0.2–10 kHz) data. The light blue vertical lines show the detected seismic events.
Surrounding the injection, the seismicity was mainly recorded by a dense network of 22 and 16 accelerometers, for the Rustrel (Fig. 1A) and Tournemire (Fig. 1B) experiments, respectively. These sensors, with a flat response between 2 Hz and 4 kHz, were preferred to classical geophones, in order to have a much wider and higher frequency response. Fig. 3 shows the time and the frequency signature of a seismic event recorded at Rustrel. Below ∼ 500 Hz, accelerometers and seismometers have similar responses. Above this frequency, while the geophone is losing sensitivity, the accelerometers fully catch the event waveform, including its frequency corner at around 1.2 kHz. To complement this backbone network at lower and higher frequency, a few geophones (10–800 Hz) and acoustic sensors (10 Hz–10 kHz) were also deployed (Fig. 1).
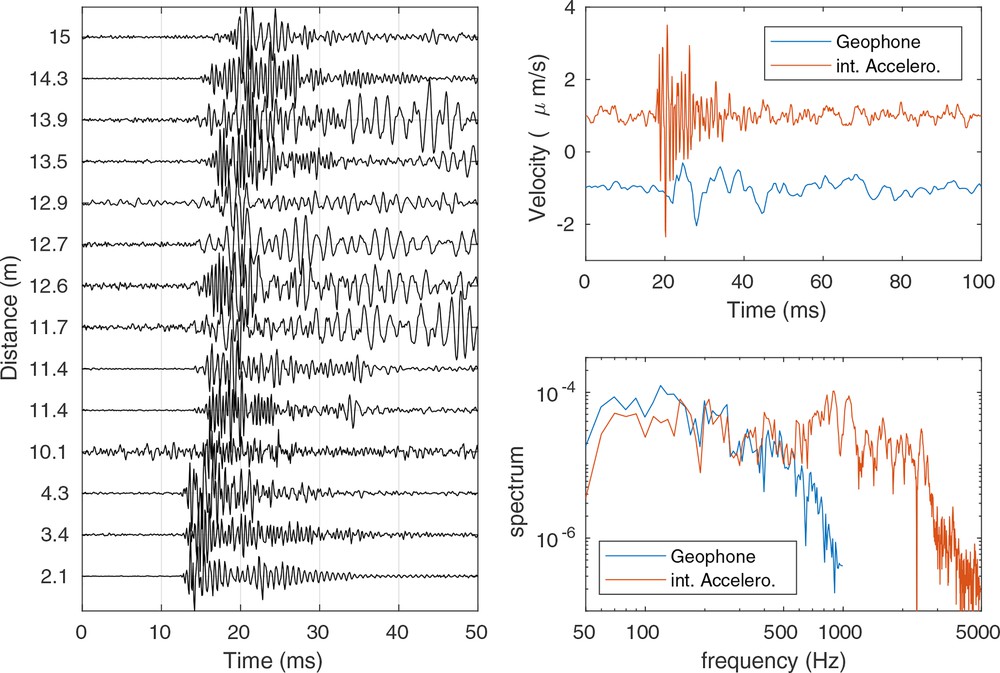
Example of a Mw ∼ –3.6 seismic event recorded in the Rustrel experiment. (Left) Accelerometric data, sorted accordingly to the hypocentral distance. (Right) Waveforms and spectrum, recorded by a geophone and an accelerometer (after time integration) set at the same location. The corner frequency of this event is around 1.2 kHz.
All these data were synchronously recorded, at sampling frequencies going from 1 kHz for hydrological and mechanical data to 2, 10 or 20 kHz for seismological data. Fig. 2 summarizes this multi-parameter dataset, by showing data recorded by different sensors during part of an injection in Rustrel (2015). In addition to the pressure and flow rate, which are more commonly recorded during reservoir-scale fluid injection, the variety of sensors used here allow one to span the full frequency range of the fault responses from the static deformation to the very high-frequency seismic emissions.
Finally, in both experiments, active seismic sources were also installed. The repetitive signals from these sources (hammer shots in Tournemire and vibrating device in Rustrel) are then used to monitor small velocity changes associated with medium perturbations during fluid injections and fault reactivations.
3 Experimental results
3.1 Seismic signatures
In both experiments, seismic events were detected by amplitude threshold methodsand then checked by eye-screening. In the Tournemire dataset, to identify small amplitude signals, the already detected events were used as templates and cross-correlated with the continuous seismic records (template-matching, Gibbons and Ringdal, 2006). At the end, only 34 events were detected in the Tournemire dataset during three injection tests (De Barros et al., 2016). The other two tests show no or single seismic emission. Out of the 11 tests performed in Rustrel, six tests show seismicity, with a total of 215 events (Duboeuf et al., 2017). An example of seismic event is shown in Fig. 3.
P- and S-wave arrival times and P-polarizations were used to get an absolute location for 24 events in the Tournemire experiment. One hundred and thirty-seven events from Rustrel were located both absolutely and relatively using arrival times and inter-event delays measured between similar events. The focal mechanisms, assuming a pure double-couple mechanism, were determined using either the first peak amplitudes for 16 events in the Tournemire dataset, or the first-motion polarity for 59 events in Rustrel.
The event magnitudes lie between Mw = –3.2 and Mw = –4.2. For both experiments, the detection threshold is around Mw ∼ –4, at least around the injections. Frequency corners are found to be greater than 1 kHz, which leads to rupture area with an estimated radius of about 0.1 m to 0.3 m for a circular crack. Such seismicity is quite small compared to reservoir-scale seismicity, usually greater than Mw ∼ –3 or tectonic seismicity (Mw > 0). However, such magnitude and source size are consistent with classical scaling laws for shearing events (e.g., Madariaga, 1976), with a stress drop of about 0.1 MPa. No major differences in magnitudes or frequency corners were observed between experiments.
Unconventional seismicity, like low-frequency events, tremor signals or long-period/long-duration signals have been observed around fluid injection in reservoirs (e.g., Kumar et al., 2017). They are interpreted as the seismic signature of slow-slip failures, but their existence and interpretation are still under debate (Zecevic et al., 2016). In the datasets recorded during the 2010 Rustrel experiments, Derode et al. (2015) identified such events. The source process behind them was, however, not clear, as the number of sensors did not allow a detailed analysis. Some low frequency events, with a peaked frequency content at ∼ 400 Hz, were also detected in the Tournemire dataset. However, the location of those events showed that they occurred in or around boreholes. They are likely to be produced by borehole wall resonance induced by pressure change (Tary et al., 2014). Therefore, unconventional seismic signals cannot be clearly linked to the fault reactivation in our datasets.
3.2 Deformation at the injection points
Hydromechanical responses strongly differ between the two experimental sites. In the shale of Tournemire, at low pressure, the flow rate was very small, indicating a very low initial fracture permeability. Once a pressure threshold was reached, the tested fractures slipped with some dilatancy, leading to a strong increase in flow rate and permeability. This pressure threshold, called Fracture Opening Pressure (FOP; Zoback, 2010), clearly separated the poro-elastic behavior near the injection borehole, from the plastic behavior on one or a few fractures which could extend several meters from the injection. Logically, seismicity only occurred once the FOP was reached. Maximum displacement measured between 0.08 and 0.55 mm with the SIMFIP probe was observed at the injections. At the end of the tests, the 0.05 to 0.52 mm residual displacements confirmed that a plastic motion was induced for all tests, even if two out of the five tests did not show any measurable seismic events, highlighting that aseismic motions occur during injections.
The fractured limestone of Rustrel, belonging to the unsaturated zone of the massif, behaves differently. Before any injections were performed, some fractures already had a millimeter opening. Therefore, even at low pressure, the flow rate was high: for four tests, injecting in highly permeable fractures led to a 70 L/min flow rate, while injection pressure remained below 2 MPa. No clear failures were observed in those tests, and no seismicity occurred. On the contrary, for six other tests, the pressure reached high value (5.5 MPa), with a flow rate increasing with pressure. Within these six tests, we observed a strong increase of permeability for two of them. A 20-fold permeability increase was also measured between the beginning and the end of the test performed in Rustrel in 2010 (Guglielmi et al., 2015a). Mechanical failures at the injection points are confirmed by residual displacements of 0.01 to 0.05 mm. However, contrary to the Tournemire tests, the pressure threshold between the poro-elastic and the plastic responses cannot be clearly defined using either the hydraulic or the deformation data. It suggests a transitional behavior, rather than the binary open/close process observed in the Tournemire experiments. For those six tests, as well as for the 2010 test, at least a few seismic events, and up to 120 events, have been observed.
3.3 Partitioning between seismic and deformation energy
Our observations show that the seismicity is unevenly distributed among tests. Some tests are fully aseismic, even if residual displacements are measured at the injection points, indicating a plastic motion on the injected structures. Moreover, there is a clear lack of seismicity near the injections, and the seismicity is also unevenly distributed in space, with some areas without any seismic sources. As instance, the seismicity in the Tournemire experiments occurred only in the eastern damage zone of the main fault. We can therefore wonder what fraction of the deformation is actually emitting seismic signals.
To evaluate the contribution of the seismicity to the deformation, seismic moments are compared to an equivalent moment computed from the deformation (Fig. 4). The latter can be computed as M0def = μ D S, with μ the shear modulus. The displacement D, measured at the injections, can be a fraction of either the maximum or the residual displacement, by considering either the total motion or only the shearing part. The surface S of the shearing zone can be estimated by assuming that the seismic events are all located either inside or around it. Therefore, both D and S are rough estimations. They, however, show that less of 0.1% of the deformation energy is actually emitting seismicity in the Tournemire shale. This ratio is higher, but still very small, in the Rustrel limestone, as seismicity represents less than 6% in average. Therefore, in both cases, most of the deformation is aseismic during fluid injections.
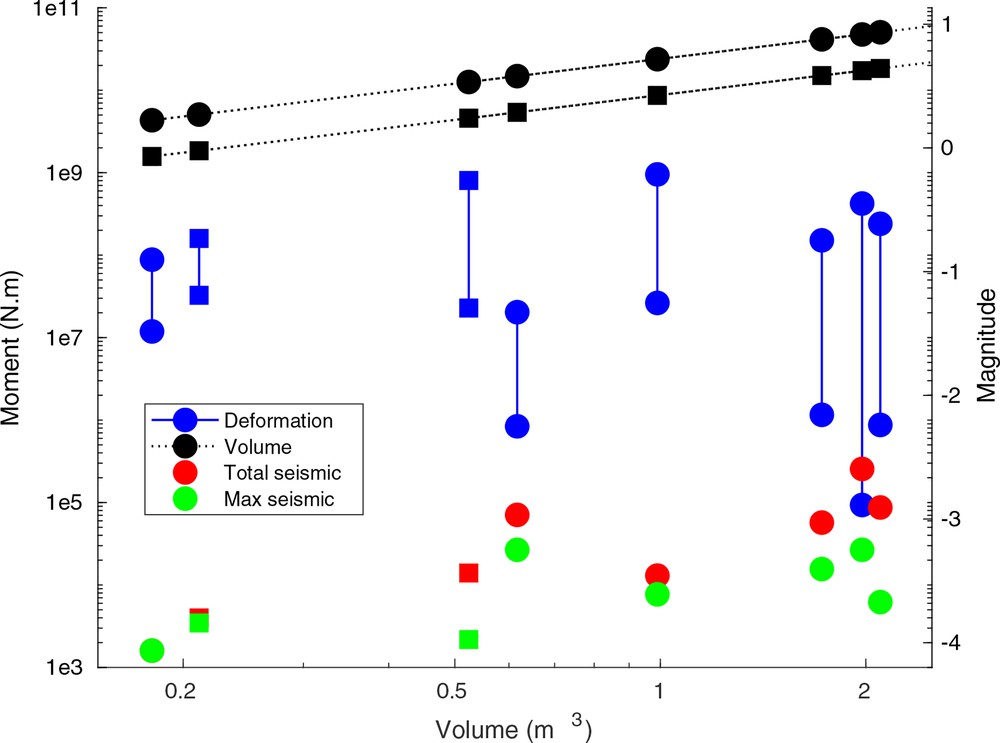
Cumulated and maximum seismic moment (red and green symbols), deformation moment and predicted volume moment (blue and black symbols) versus injected volume V for the different tests of Rustrel (square) and Tournemire (circle). The volume moment is the maximum seismic moment following McGarr (2014) relationships, as M0max = μ V. The shear moduli μ are different for Tournemire and Rustrel. The deformation moment is computed by M0def = μ S D. Uncertainties on the rupture surface S and the displacement D measured at the injection give the error bars.
Based on our observations, we suggest that not considering aseismic deformation induced by injections can lead to an overestimation of the maximum magnitude prediction as proposed by McGarr (2014). The authors linked the maximum seismic moment M0max of induced earthquakes to the injected volume V by M0max = μ V, with V the injected volume. The maximum seismic moment observed here is indeed linearly related to the volume (Fig. 4). However, the McGarr (2014) theoretical predictions are six orders of magnitudes above our observations. This strong discrepancy may be explained by the strong aseismic component of the deformations, as McGarr (2014) considered that all deformations are emitting seismicity.
3.4 Location of the deformation
Repetitive, active seismic sources were shot during the experiments to image seismic velocity perturbations that testify to changes in the mechanical properties of the fault zone. Monitoring seismic velocity changes has proven its efficiency in giving valuable information about active fault behavior with either seismic slip (e.g., Brenguier et al., 2008), aseismic motion (e.g., Rivet et al., 2011), or pore-pressure changes (e.g., Hillers et al., 2015). In such injection experiments, with a dense monitoring network around the fault, seismic velocity change measure aims to detect aseismic deformation processes distributed around the reactivated structures.
The active seismic signals recorded during injection periods were compared with reference signals recorded prior to the tests and considered as the baseline responses of the medium. The delay betweensignals are then inferred from the phase differences by interferometric techniques. As P- and S-waves do not have the same sensitivity with respect to deformation and fluid content, we measured travel-time changes for both phases separately. Using tomography methods, these P- and S- wave velocity changes were located in the medium, by converting travel-time differences to velocity changes (Rivet et al., 2016).
Fig. 5 presents images of the seismic velocity changes measured during the first injection test of Tournemire experiment in a set of minor, secondary faults belonging to the western damaged zone and located at the center of the seismic sensor array. This test does not show clear seismic emissions, despite plastic deformations observed at the injection point. First, below the FOP (i.e. before plastic deformation on the injected structures), both P- and S-waves show a slight increase around the injection chamber (Fig. 5a,c). The pressure in the chamber makes it inflate, which increases the stress in the surrounding medium. Above the FOP, velocity perturbations are much stronger (up to 5%, Fig. 5b,d). A strong decrease of P- and S-waves is associated with the dilatancy of the minor faults that are aseismically slipping in response to the injection. The plurimetric extension of the perturbations (i.e. of the slipping area), is confirmed by numerical modeling of fluid-assisted stress perturbations (Rivet et al., 2016). The dilatant shear on these faults induces a stress transfer, with a stress increase in the surrounding areas, associated with a positive perturbation of the velocity.
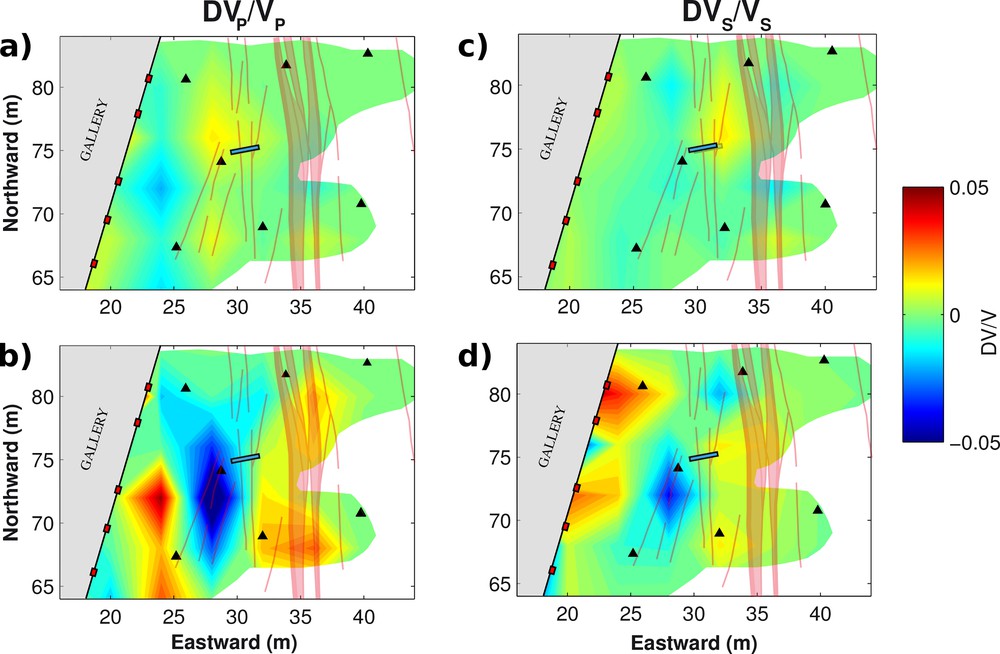
Map view of the P- (left panels, a and b) and S-wave (right panel, c and d) velocity variations observed during test 1, Tournemire (see Fig. 1A). The blue rectangle shows the injection chamber. a and c: velocity changes for an injection pressure below the FOP; b and d: velocity changes for an injection pressure above the FOP, i.e. when aseismic failures were observed.
The seismic velocity changes are therefore related either to the dilatancy of the slipping faults or to the opening/closing of micro-cracks due to stress perturbations. As no seismicity was recorded during this test, velocity changes appear as a good probe to monitor (1) aseismic deformation and (2) stress transfer. Across the tested fault, averaging the positive and negative perturbations leads to a small decrease of velocity of about 0.1%. This agrees with the perturbations measured across tectonic fault zones, and induced by earthquakes (Brenguier et al., 2008). Therefore, the small negative perturbations observed after earthquakes might be a spatial average of stronger and localized perturbations.
4 Discussion
Our experiments only induced a sparse seismicity, despite plastic behaviors at the injections. Particularly, there is a lack of seismic events near the injection points and an uneven spatial distribution around. The number of seismic events strongly differs from one test to another, with some tests without any seismicity. Therefore, the spatio-temporal distribution of the seismicity is very heterogeneous. Assuming that the fluid pressure, which reduces the effective stress, directly triggers the seismicity, the earthquakes should move away from the injection with the square (or cubic) root of time for a poro-elastic diffusion of the fluid (Shapiro, 2015). Such distance-time plot is given in Fig. 6, with a normalized diffusivity to make the different tests comparable. The actual diffusivity is found to range between 0.0015 and 0.13 m/s2 among tests, which agrees with values usually measured in geothermal areas. However, this diffusive pattern is not clear, as seismicity does not gather behind a seismic front. For some tests (e.g., test 2, Rustrel), seismicity occurred clustered in time but spatially scattered. Test11 seismicity (Rustrel) seems to follow two different diffusive patterns, with a higher diffusivity at early time than later in the test, which is inconsistent with the observed increase of permeability. Therefore, a poro-elastic diffusion is too simple to model the full complexity of the medium response. On top of that, the medium is changing with fluid injection, as new fluid paths are created. The intertwined relationships between injection parameters, geological settings, aseismic deformation and seismicity are therefore complex.
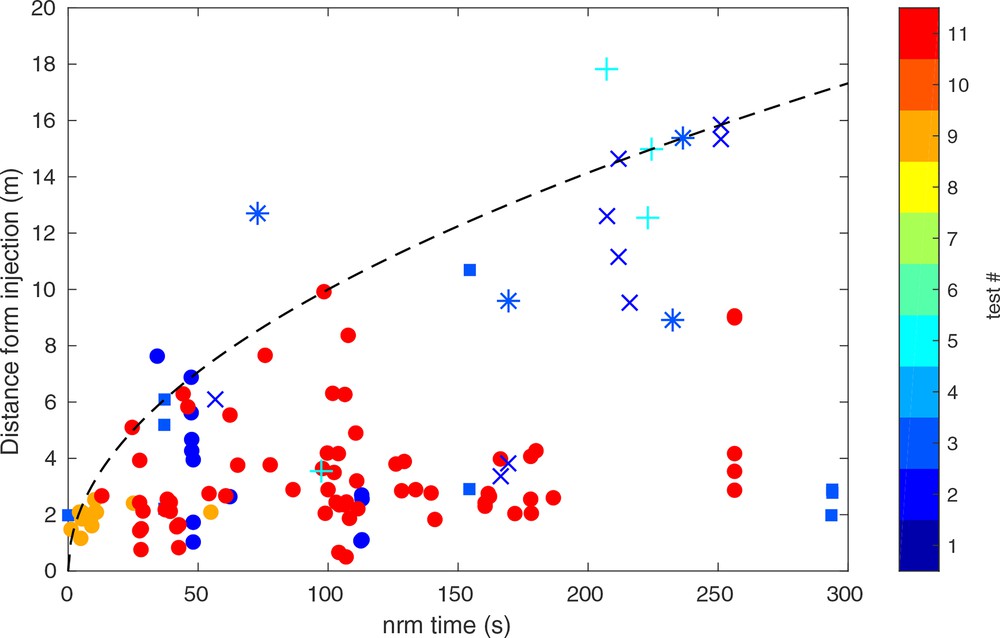
Spatio-temporal distribution of the seismicity. Distance R between hypocenters and injection points versus time t where the pressure is above σ3. The time has been normalized, in order to make the different tests comparable, with a diffusivity D = 1 m/s2. This normalization coefficient is the mean for the three events with the largest diffusivity. The dotted line is therefore the theoretical prediction R = sqrt(4πDt), with D = 1 m/s2. The color-code stands for the test number, in either Tournemire (cross symbols) or Rustrel (filled symbols).
Based on our original experiments, the respective role of lithological, hydraulic and frictional properties of the fault zone can be better constrained. Firstly, we observe that the lithological properties influence the seismic behavior. For similar fluid perturbations, seismicity production is smaller in the Tournemire shale than in the Rustrel limestone. Similar experiments, also at decametric scale, but in crystalline rocks reveal a much numerous seismicity (Jalali et al., 2017; Zang et al., 2016). Besides, in the Tournemire shale, 11 out of 16 events with computed mechanisms occurred on the same family of fractures (Fig. 7), which are the only ones in the area with a calcite filling. While the shale has a rate-strengthening behavior, the calcite fillings may be rate-weakening. Therefore, seismicity occurred only on geological structures with an adequate mineralogy and frictional behaviors. In Rustrel, more numerous seismicity is observed in the layers with the highest density of fractures. The density and frictional properties of the fractures around the injection are then one controlling factor of seismicity production.
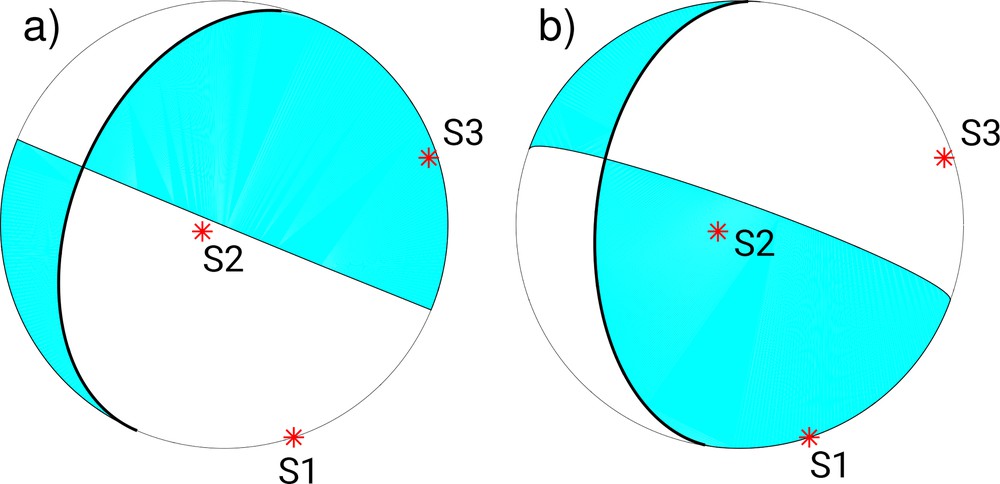
Example of mechanisms computed for two seismic events in Tournemire. The bold lines are the fault planes, which are N150–180, 30–60°W structures with calcite fillings. The local stress field (S1 = 4 ± 2 MPa, S2 = 3.8 ± 0.4 MPa and S3 = 2.1 ± 1 MPa) was measured by Cornet (2000) and confirmed by Guglielmi et al. (2015b). Out of the computed mechanisms in the Tournemire test 2, four events have a mechanism similar as the left-handed strike-slip given in (a), and three events follow a right-handed strike-slip mechanism (b).
Fracture permeability also has a strong effect on seismicity. For both experiments, injections into areas with higher permeability fractures induce very little seismicity. As the fluid flows rapidly out the injected area, the volume invaded by the fluids is too large to allow a pressure higher than the FOP away from the injection. Therefore, no failures and no seismicity could happen. Finally, at the experiment scale, the fault zone is very heterogeneous, such as the seismicity distribution. The fault core seems indeed to act as a barrier for the fluid and for the stress field. It leads to heterogeneous hydraulic responses and stress concentration and rotation (Faulkner et al., 2006). Those heterogeneities, together with the permeability differences, may explain the asymmetric distribution of seismicity between the two sides of the fault core in the Tournemire shale (De Barros et al., 2016).
The stress field may also impact the seismic behavior. The seismic events show very scattered mechanisms for both experiments. Particularly, for Tournemire test 2, 7 mechanisms were computed for events that share similar horizontal location. Those events show similar nodal planes, but opposite polarities. The four left-handed strike slip mechanisms (Fig. 7a) agree with the local stress field measured by Cornet (2000) and confirmed by Guglielmi et al. (2015b). The three remaining events show an opposite mechanism (right-handed mechanism, Fig. 7b). As the fluid pressure equivalently reduces the effective stress of all normal components, such events with opposite slip-direction cannot be directly induced by a fluid-pressure increase. An additional forcing, likely the aseismic deformation, should interfere in order to strongly perturb the local stress field.
A strong aseismic motion was observed, when comparing deformation at the injection, induced seismicity, and medium perturbations imaged through seismic velocity changes. The strong discrepancy between seismic moment and either deformation energy or McGarr (2014) relationships clearly shows that most of the deformation is not emitting seismicity. Such small seismic-to-aseismic ratio has been observed at the laboratory scale (Goodfellow et al. (2015), during reservoir monitoring (e.g., Calò et al., 2011; Schmittbuhl et al., 2014) or in subduction areas (e.g., Vallée et al., 2013).
In our experiments, deformation is particularly observed aseismic at the injection points. Therefore, it is firstly induced before any seismic failures (Guglielmi et al., 2015a). Both velocity change measurements and numerical modeling show that this aseismic motion may propagate over a distance of tens of meters away from the injection points (Guglielmi et al., 2015b; Rivet et al., 2016). Around it, the stress field should be perturbed, by Coulomb failure stress change, in the same way as for earthquakes (Stein, 1999). Moreover, this stress transfer around mainshocks triggered aftershocks, whose number decay with time follows an Omori's law. Here, stacking the event distributions for all tests, we also observed a 1/t decay of the number of seismic events (Fig. 8). Therefore, the observed seismicity seems to be “aftershocks” of the aseismic motion. In other words, the main slow failure induced at the injection modifies the stress field, strongly enough to trigger opposite-slip seismic events.
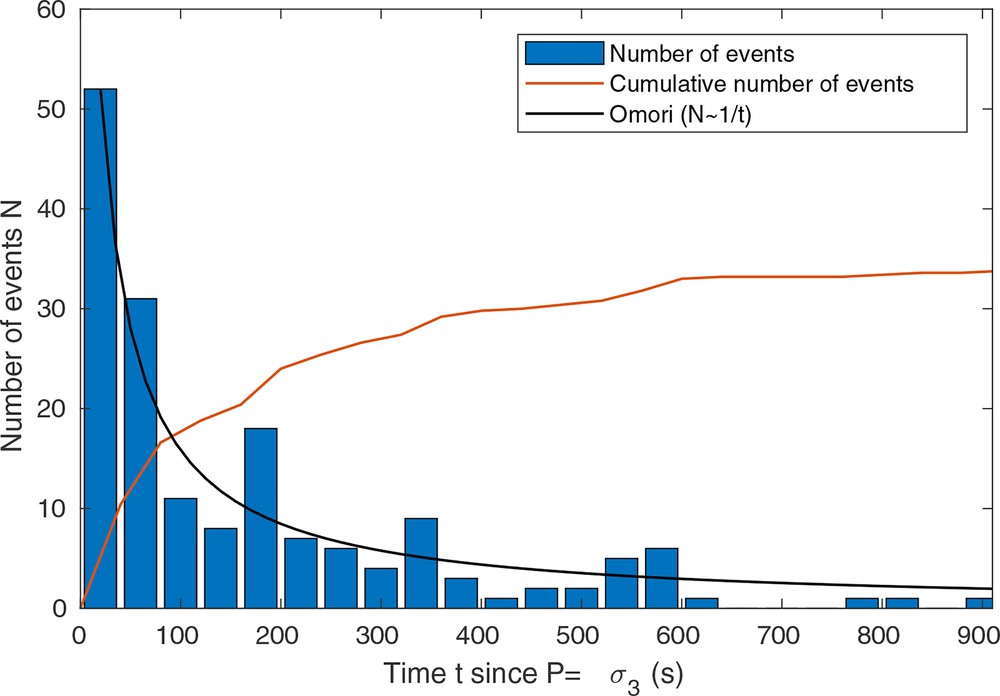
Stacked time distribution of the seismic events for all tests. The time is defined as the time when the injection pressure is above σ3. The red line is the cumulative number of events (divided by 5 for the sake of clarity). The black line is the Omori's law (N(t) ∼ 1/t), which best fits the distribution.
We can therefore propose a new model to explain how fluid perturbations induce seismicity (Fig. 9). The increase of fluid pressure and the associated reduction in effective normal stress induce large, aseismic failures. These aseismic deformations modify the fracture permeability and open new paths for the fluid flow. The volume to pressurize becomes larger, with new aseismic deformations once the pressure level becomes high enough. The fluid propagation could follow a fault-valve-like process as proposed by Sibson (1990), except that failures do not generate seismicity. It could also be modified by sudden shifts from highly channeled to large pressurized patches. In that case, the evolution of permeability with stress and strain could be an important mechanism driving the growth of aseismic fault rupture (Jeanne et al., 2018). The seismicity is likely a consequence of the main failures: the stress transferred from the aseismic deformation modifies the local stress field, which generates seismicity on structures with adequate rate-weakening frictional behaviors. It means that the seismicity may surround the main deformation area, and can eventually be outside the pressurized area. Moreover, as the pressurized zone increases with injected volume, the seismic cloud size also increases with time, leading to an apparent diffusivity of the seismicity.
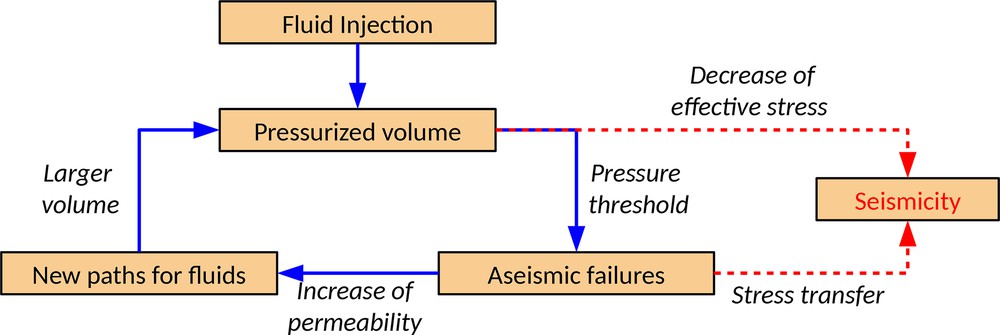
Schematic view of the dual processes for fluid-induced seismicity, as inferred from the in-situ experiments.
However, from the saturated area, fluid diffusion may also occur, and may directly induce seismicity by decreasing effective stress. Therefore, a dual process, by either stress perturbations or increase in fluid pressure, may lead to seismicity. The balance between those two processes mainly depends on the pressure level, the variations of the medium permeability with stress and strain, and the injection time (Cornet, 2016; Jeanne et al., 2018). In our experience, seismicity seems mostly dominated by stress perturbation processes, but a lower-pressure fluid, injected during a longer time might generate a seismic front that follows fluid diffusion.
Aseismic deformation is therefore dominating the hydraulic responses of reservoirs (i.e. the fluid-flow paths). Thus, it is of crucial importance to monitor deformation during reservoir stimulation, by using either borehole instruments (strainmeters, extensometers, etc.), or surface measurements when possible. Monitoring velocity changes prove to be a promising tool to infer in-situ aseismic deformation and stress changes (Calò et al., 2011; Hillers et al., 2015; Rivet et al., 2016). On the contrary, the use of induced seismicity may not be a direct probe for the fluid, as it depends, among other parameters, on the injection properties, on the local stress field and on the density, the frictional and strength properties, and the permeability of the fractures. Therefore, great care should be taken in interpreting fluid extension from the spatio-temporal distribution of seismicity.
5 Conclusion
Two experiments of fault reactivation by fluid pressure injections were performed in shale (Tournemire site) and limestone (Rustrel site). The multi-parameter and dense monitoring network allowed the close observations of the hydro-mechanical and seismological responses of the injected structures, from the static deformation to the high-frequency (10-kHz) acoustic emissions. While plastic deformation was observed after most of the injections, only a sparse seismicity was observed. Its uneven spatio-temporal distribution, the energy budget and the seismic velocity changes show that more than 95% of the deformation is indeed aseismic. Seismicity rather seems to be a response to the stress transferred from this large aseismic deformation, than to the fluid pressure. Therefore, a dual process of stress transfer from aseismic deformation and poro-elastic diffusion of pressure leads to a complex seismic behavior. Moreover, the seismic emissions depend, not only on the injected volume, but also on the local stress field, on the geological heterogeneities, on the fracture permeability and frictional properties, and on their stress – strain dependency. Therefore, the spatio-temporal distribution of the seismicity in, e.g., reservoirs may mainly map the aseismic deformation, together with lithological heterogeneities. Therefore, in order to improve reservoir monitoring and seismic hazards mitigation, it is of crucial importance to better monitor and understand the deformation that are not recorded by conventional seismic instruments.
Acknowledgments
Tournemire experiment was funded by TOTAL SA through “Fluids and Faults” project (PIs: Claude Gout, Raymi Castilla and Pierre Henry). Rustrel experiment was supported by the “Agence nationale de la recherche” (HYDROSEIS project, PI. F. Cappa, ANR-13-JS06-0004-01) and by Total SA (HPMS-Ca project, Albion, PI. G. Massonat). We thank the IRSN (French Institute of Radioprotection and Nuclear Safety) for their dedicated help and access to the IRSN Tournemire platform, and the low-noise underground laboratory (LSBB) of Rustrel for logistical help during the experiment. SITES Company (J. Durand, H. Caron, and Y. Zouhair) is acknowledged for installing and maintaining the SIMFIP probe, sensors, and acquisition during the experiment. We thank the Magnitude Company (Sainte-Tulle, France office) for the Tournemire microseismic data processing. Louis De Barros deeply thanks the French Academie des Sciences for awarding him the Gouilloud–Schlumberger prize.
This paper is invited in the frame of Académie des Sciences 2017 Prizes (Grand prix Gouilloud-Schlumberger 2017). It has been reviewed/approved by Michel Campillo and Vincent Courtillot.