

1 Introduction
Mount Cameroon is one of the largest continental volcanoes of Africa and the most active volcano of western Africa (Fig. 1). It is part of the 1600-km volcanic chain known as Cameroon Volcanic Line (CVL) that extends from the islands of the Gulf of Guinea towards northern Cameroon. Many geohazards events have occurred along the CVL in the recent decades including out-gassing of Lakes Nyos and Monoun (Freeth and Kay, 1987), recent lava flows along Mount Cameroon (Suh et al., 2003), landslides (Ayonghe et al., 2002) and tectonic earthquakes (Ateba et al., 2009). These events have caused heavy casualties and some damages to properties and infrastructures, making the CVL to be the most attractive area for research. Studies of the seismicity in Cameroon generally point out the region around Mount Cameroon as the most active in the whole country (Ateba et al., 2009; De Plaen et al., 2014; Déruelle et al., 1987; Fairhead, 1985; Ntepe et al., 2004; Tabod et al., 1992).
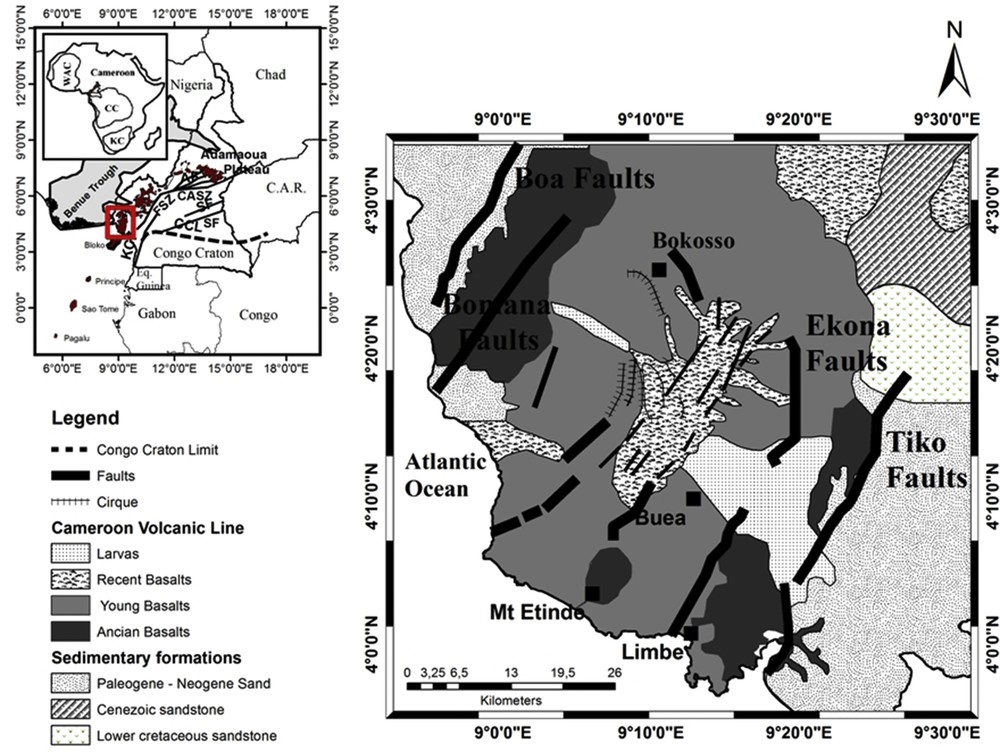
Simplified geologic and tectonic map showing major tectonic elements of the study area. Upper inset: the volcanic areas that are part of the CVL are shown in brown. The main geological entities and some faults are presented and revised from Ateba et al. (2009).
Available historical records updated from the compilation of many researchers (e.g., Ambraseys and Adams, 1986; Ntepe et al., 2004; Tabod et al., 1992) show several earthquakes located around the mountain with hypocenters varying from near surface to depths of about 50 km or above (Ambeh et al., 1989; Ateba and Nteppe, 1997). Other signs of activities of Mount Cameroon are the volcanic eruptions, with about eight occurrences recorded since the last century (Déruelle et al., 2000; Njome et al., 2008). The structure of the crust and the upper mantle along the CVL has been recently investigated in many studies. Reusch et al. (2010) revealed the presence of a continuous mantle low-velocity zone (LVZ) under the CVL using body wave tomography and attributed it to a thermal anomaly of at least 280 K. The average crustal thickness along the CVL was estimated to be about 36 km (Tokam et al., 2010) and the structure of the crust along the CVL was interpreted as not having been that much affected by Cenozoic volcanism (Tokam et al., 2010). However, the region around Mount Cameroon is the only active one along the line. In term of crustal structure, it shows a different pattern compared to the rest of the line. The average crustal thickness beneath Mount Cameroon was estimated to be about 25 km (Ateba et al., 2009; Tokam et al., 2010), which is about 10 km thinner than the average estimates elsewhere along the line. The particularity of Mount Cameroon is also observed on gravity data that reveals a positive Bouguer anomaly around the volcano (Kamguia et al., 2008; Tadjou et al., 2009). Therefore, a detailed study of the crustal structure is needed in order to better apprehend the tectonic settings of the region and understand how the present activity, restricted to Mount Cameroon, is linked to the deeper LVZ.
The observed gravity field is the superposition of all anomalies induced by different geological sources located at various depths. The separation of gravity data into its residual–regional component is an important step in the interpretation process. The wavelet transform, which has been widely used in recent years in gravity data processing and interpretation, has been proven to be a powerful tool to delineate geological boundaries (e.g., Bogusz et al., 2013; Chen, 2004; Hou and Yang, 1997; Martelet et al., 2001; Ucan et al., 2000; Wang, 2005). It can also be assisted by the traditional spectrum analysis for depth estimations (Albora and Ucan, 2001; Xu et al., 2009). The objective of the present study is therefore to estimate the geometry and source depths of the various geological features beneath the Mount Cameroon region in order to get new insights on the development of the CVL.
2 Geologic settings
The structural units in Cameroon are mainly characterized by the CVL, the Central African Shear Zone (CASZ), the Adamawa Plateau, the Congo Craton, and the Benue Through. The CVL is a particular type of volcanic lineament encompassing oceanic and continental parts, and consisting of a chain of volcanoes, Tertiary to Recent in age, generally alkaline in composition, extending from the Atlantic island of Pagalu to the interior of the African continent (Fitton, 1987; Lee et al., 1994, Fig. 1).
The setting of the CVL remains to date a major scientific matter for the Earth Sciences community. Many tectonic models have been proposed to explain its origin. These include plume head interaction with lithosphere topography (e.g., Ebinger and Sleep, 1998; Halliday et al., 1990), decompression melting beneath reactivated shear zones (e.g., Fairhead and Binks, 1991) and small-scale mantle convection resulting from the edge flow along the northern boundary of the Congo Craton (e.g., King and Ritsema, 2000; Reusch et al., 2010; Reusch et al., 2011). Adams et al. (2015) later suggested that its origin might be derived from a complex combination of geodynamical processes rather than from a single one. Mount Cameroon, the only active volcano of the chain, has a southwest–northeast elongated shape and counts more than one hundred volcanic cones that are much aligned along its northeast–southeast axis (Gèze, 1953). It has a horst/graben structure parallel to the direction of the CVL (Gouhier et al., 1974; Vincent, 1971), in which the central uprising part is compensated by the collapse of the lateral sedimentary basins (Déruelle et al., 1987). The tectonic context behind Mount Cameroon is a regional extensional structural setting (Déruelle et al., 1991). Two main faults, oriented SSW–NNE, were earlier mapped around Mount Cameroon by Hedberg (1968): the Tiko fault to the east and the Boa fault to the west (Fig. 1). Another fault system, known as Ekona faults, was later identified on the eastern flank by Zogning (1988). Mt Cameroon is surrounded eastward by the Douala basin and westward by the Rio Del Rey basin. The northwestern flank is marked by a circular steep structure (the northwestern cirque) and the Bokosso NNW–SSE fault system. The volcano is made of alkaline basaltic lavas interbedded with small amounts of pyroclastic material above Precambrian metamorphic rocks covered with Cretaceous to Quaternary sediment (Gèze, 1953). It is underlain by the Pan-African basement rocks, which consist of schists and gneisses with some intrusion of granites and diorites (Fitton, 1987; Déruelle et al., 2007). From various rock samples, the K–Ar ages of Mount Cameroon was estimated to less than 1 Ma (Piper and Richardson, 1972), not exceeding 0.7 Ma (Nkoumbou et al., 1995).
3 Data
The gravity dataset used for the present study consists of more than 250 irregularly spaced gravity stations collected during various field experiments and research teams between 1963 and 2008 (see Ngatchou et al., 2014; Tadjou et al., 2009 and references therein). The latest gravity campaigns were carried out during 2008 by the National Institute of Cartography (NIC) to acquire more data and fill the gaps around Mount Cameroon. The equipment used for the experiment was a Lacoste–Romberg gravimeter. The measurements were taken from the base station used by the previous institutions and located at Buea (Up Station). This base station was earlier linked to the international reference station located at the Douala International Airport. The base station and other former stations in the area were used to assess the quality of the new measurements by comparing them to the previous ones collected at the same places. The acquired data were corrected for the instrumental drift and then combined with the former ones for the present study (Fig. 2, left). The ETOPO1 DEM at 1′ interval was used to estimate the magnitude of the terrain corrections in the area as it provides altitudes varying between 0 and 4100 m. The terrain correction is estimated based on the combination of methods developed by Kane (1962) and Nagy (1966) using mean densities of 2.67 g/cm3. The maximum terrain correction almost reaches 14 mGal at some points for a global average correction of about 2–4 mGal. Using the Geodetic Reference System GRS80, the complete Bouguer anomaly, which is the sum of the simple Bouguer anomaly and of the calculated terrain correction, was computed for all survey stations (Fig. 2). The final anomaly ranges between −75 and 110 mGal with computed errors range between 0.2 and 1.5 mGal. Previous estimation of gravity anomalies using IGSN71 reference revealed maximum errors from merged data across Cameroon to 1.3 mGal (Fairhead and Binks, 1991) or 2.52 mGal (Fairhead and Okereke, 1987). The Bouguer anomaly map was then obtained after interpolation using a continuous curvature grid algorithm implemented in GMT software. The seismic events shown in Fig. 2 (left) and represented by white circles are taken from a compilation of data from previous studies (Ateba and Nteppe, 1997; Tabod et al., 1992).
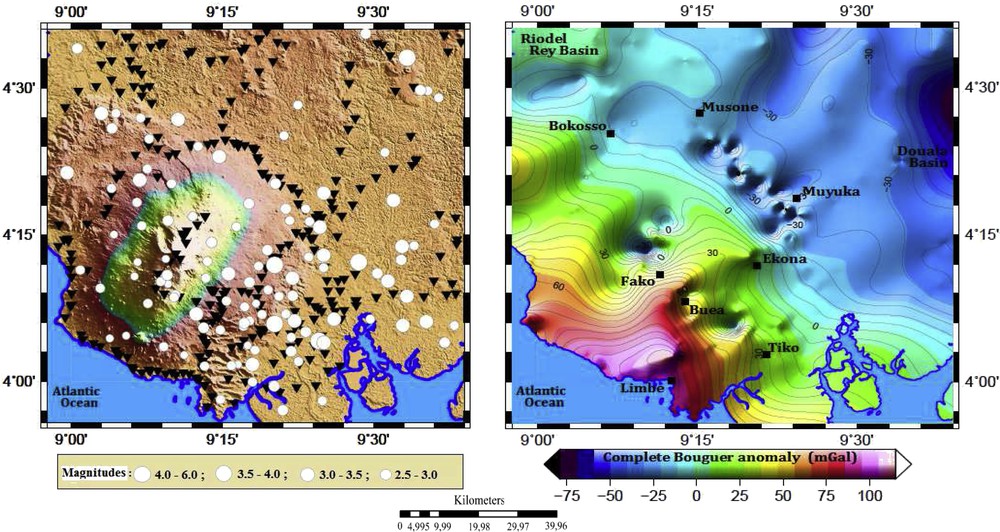
(Left) Topographic map of the study area obtained using Etopo1 DEM, showing all the gravity stations used and represented as black triangles. White circles are seismic events scaled to the magnitude. (Right) Complete Bouguer anomaly map of Mount Cameroon and the surrounding areas of the study area. Black thin lines are gravity contours with interval of 6 mGal.
4 Interpretation approach
The wavelet transform method consists in decomposing the signal into a series of functions with decreasing frequencies in such a way that each level of decomposition includes a high-frequency component and an approximation resulting from extracting the high-frequency components from the signal (Bogusz et al., 2013; Ucan et al., 2000). In the wavelet multi-scale approach, the common algorithm applied is the pyramidal decomposition and reconstruction. The key idea is to decompose the spatial domain into a series of sub-spaces with different resolutions and then describe initial functions as approximate limits of the series of approximate functions (see Hou and Yang, 1997; Jiang and Zhang, 2012; Mallat, 1989; Xu et al., 2009; Yang et al., 2001 for further details). Mathematically, according to Jiang and Zhang (2012), the 2D gravity anomaly can be decomposed with the wavelet multi-scale analysis method using the following equation:
| (1) |
In this study, we tested various 2D wavelet multi-scale analysis techniques including Haar, Daubechies, Symlet, Coif, Biorthogonal, and Meyer wavelet techniques, and we compared them with different levels of obtained detailed and approximate images. The best results were obtained with the Discrete Daubechies wavelet transform, which provided higher image resolution. The gravity field was decomposed into six orders and provided approximate and detailed fields for all the six orders. The sixth order corresponds to the maximum depth estimate of density sources from spectrum as no significant difference appears at higher orders. The approximate field contains information from regional gravity field and reflects the low-frequency gravity anomalies produced by large-scale geologic structures, while the detailed field reflects the local gravity field, which contains gravity anomalies of high frequency produced by shallow small-scale geologic bodies. The maximum order is also fixed after the disappearance of the features from the local field anomaly on the approximate image (regional field). The more we increase the wavelet multi-scale transform order, the deeper will be the corresponding source depth. The remaining issue is that the estimate of the source depths cannot be obtained directly from the images.
We use the logarithm power spectrum (Cianciara and Marcak, 1976) to estimate the source depth assuming that the source field depth is correlated with the power spectrum. Therefore, the average depth information of the various sources can be obtained using the slope of the logarithm power spectrum curve applied both on the Bouguer anomaly map and on the wavelet detailed images.
5 Results and discussions
5.1 Analysis of the Bouguer anomaly map and seismicity
The analysis of the Bouguer anomaly map of the study area (Fig. 2b) shows that gravity highs are correlated with areas of high topography (uplift), while gravity lows are correlated with those of low topography (depressions). The areas of gravity lows near the Rio Del Rey Basin are related to deep mass deficiency, extending to the Douala Basin. The gravity highs cover half of the studied area from the Atlantic Ocean to the diagonal passing through Ekona and Bokosso. The Douala Basin edge has the lowest gravity anomaly (<−35 mGal), and extends along the CVL. The Bouguer anomaly varies from about +100 mGal in the Limbe region to −70 mGal in the Douala Basin.
The seismicity of Cameroon is confined around Mount Cameroon and the majority of earthquakes occurring around the volcano are located at its southeastern flank (Tabod et al., 1992). The b-value for the area was estimated to 1.53 ± 0.02, which is typical for volcanic areas (Wetie Ngongang, 2015). This author also associated this anomalous high b-value with the presence of high heterogeneities in the materials composing the crust beneath Mount Cameroon.
Comparing the complete Bouguer anomalies to the seismicity of the area, it was found that the epicentres of the reported earthquakes with a magnitude range of 3.5–6 (Fig. 2a; Ngatchou, 2015) are quite limited by the transition zone between positive and negative anomalies (Muyuka to Bokosso zone) and predominantly occur in the southeastern flank of Mount Cameroon. Therefore, the gravity gradients may suggest that the heterogeneities evoked earlier are due to a vertical contact or fault. Practically, the Mount Cameroon area is an anomalous gravity field as well as an area of high seismicity (Tabod et al., 1992). Gravity anomaly and seismic distribution are related to various scales of tectonic activities that have taken place in the area mostly during Cretaceous and Cenozoic times. High seismicity indicates that the tectonic activities are still going on and can be triggered by fluid percolation trough the crust, as evoked by Ateba et al. (2009), who suggested the presence of a vertical magma conduit under the central axis of the volcano, extending from the surface to about 20 km in depth.
5.2 Estimation of depths from the power spectrum
The logarithm power spectrum (Cianciara and Marcak, 1976) was applied successively on the gridded Bouguer anomaly map (Fig. 3) and on the various order of the wavelet detailed images (Fig. 3 and Table 1). It is important to recall that the calculated depth obtained from the power spectrum method is not the exact field source depth, but just an estimated value.
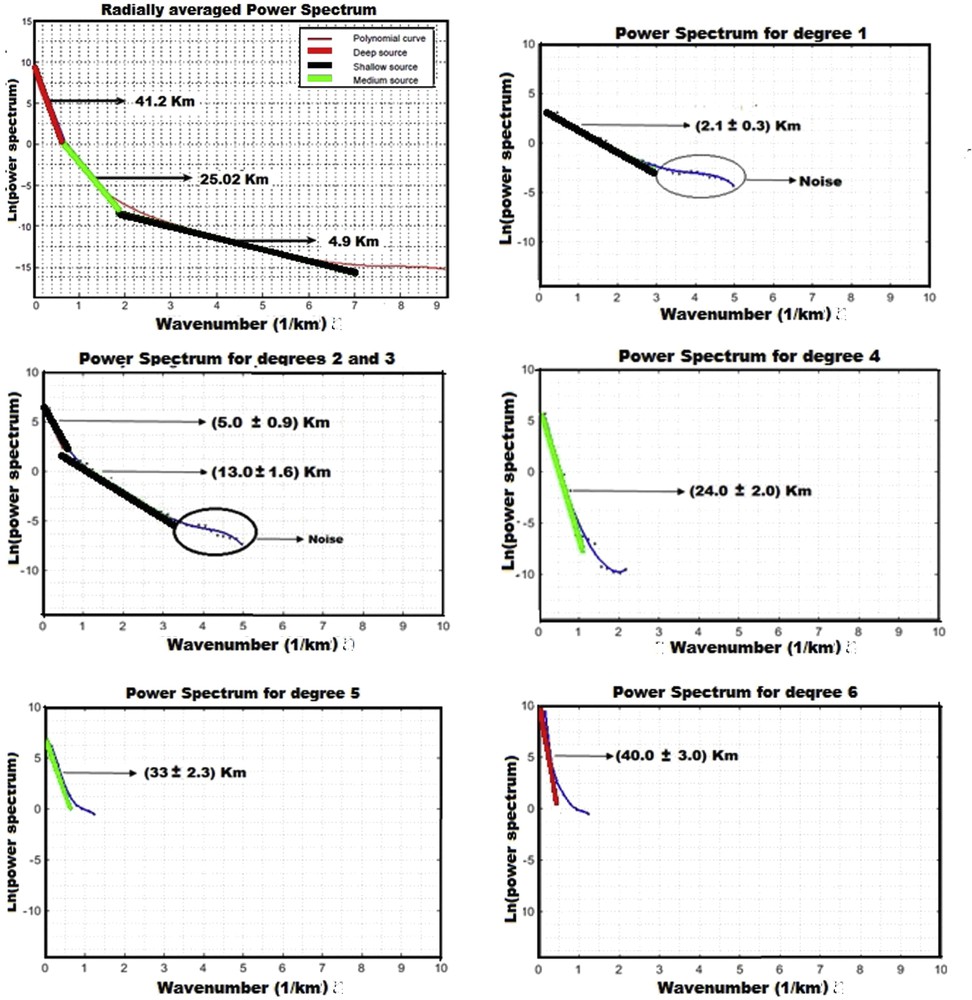
Spectrums of the complete Bouguer anomaly (top left) and the first- to sixth-order detailed images for the area around Mount Cameroon and the estimated depths for the sources. (Red, green and black lines correspond to the deep, intermediate, and shallow sources, respectively.)
Estimated depths of the source for the first- to the sixth-order detailed images calculated from the power spectrum method.
| Wavelet detailed image transform order | Estimated depth (km) |
| 1st order | 2.1 ± 0.3 |
| 2nd order | 5.0 ± 0.9 |
| 3rd order | 13.0 ± 1.6 |
| 4th order | 24.0 ± 2.0 |
| 5th order | 33.0 ± 2.3 |
| 6th order | 40.0 ± 3.0 |
The slope of the logarithm power spectrum curve for the complete Bouguer gravity anomaly can be divided into three segments, each corresponding to anomalies induced by an average geologic structure located at a particular estimated depth (Fig. 3, top left). From this perspective, the results may place the bottom of the sedimentary layers at 5 km, the top of Moho at 25 km on average over the area, and deep mantle sources at approximately 41 km.
However, for the detailed images, the application of the spectrum method to the first order can just provide information on the sedimentary layer or very shallow structures and noises, while the second- to sixth-order detailed images can be useful to analyse deeper structures. The wavelet images for the second to the fourth order reflect the anomaly induced by shallow to deep geologic bodies including pre-Cenozoic and Moho ones. The results for the fifth and sixth orders represent the anomalies induced by density contrasts across the Moho and geologic structures within the upper mantle respectively.
5.3 Wavelet approximate images and regional tectonics
The approximate wavelet images are applied to the regional gravity field that contains low-frequency gravity anomalies created by deep large-scale geologic structures. Two significant approximate images (second order and fourth order) are presented in this paper since they reveal significant changes in the regional pattern (Fig. 4). Fig. 4A may represent a gravity source located at upper crust with gravity anomalies trending northwards with values increasing from east to west in the studied area. This can be interpreted as an eastwards crustal thickening. This result agrees with similar findings by Poudjom et al. (1995) and Tokam et al. (2010). Fig. 4B shows similar features, but with less gravity amplitude. A negative gravity zone is concentrated in the centre of the area and is clearly more visible in the lower crust image than in the upper-crust one. It suggests a variable Moho discontinuity in the study area and a deeper Moho at that place.
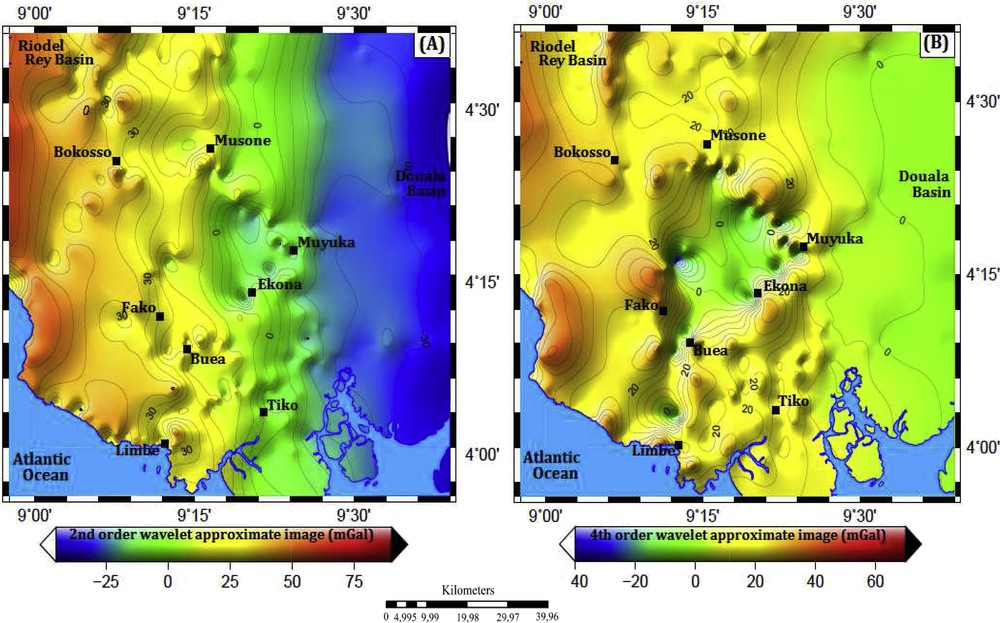
Wavelet transform approximate images of the Bouguer gravity anomalies decomposed on the second (A) and fourth (B) orders, respectively.
5.4 Detailed images and local structures
5.4.1 Upper crust
The first- and second-order wavelet detailed images display effects of upper crust structures (Fig. 5A and B). One should recall that the first order contains effects of shallower structures (∼2 km in depth, Table 1) and noise, so no further comment will be provided for that order, although it shows some similarities in shape with the second-order image. On the second-order detailed image (∼5 km in depth, Table 1), we can observe a relatively homogenous crust in the east characterized by low gravity gradients, while in the west of the figure the crust appears heterogeneous with higher gravity anomaly gradients. The positive anomalies oriented along the Limbe–Buea direction suggest the presence of dense materials within the crust. The fact that the lateral extension of this dense material is small may confirm that the development of the CVL did not affect that much the upper crust as already pointed out in previous studies (e.g., Tokam et al., 2010). The negative anomalies observed in the northwest of the study area may result from the presence of low-density materials, as Mount Cameroon is surrounded by several basins (see Fig. 1).

Wavelet decomposition results of Bouguer gravity anomalies in the Mount Cameroon area at different scales from the 2-D multi-scale wavelet analysis. (A) to (D) correspond to the first- to fourth-order detailed images, respectively. Gray thick lines are gravity contours. Black squares are the main cities. Red dots underline the Tiko and Ekona Faults surface expression.
5.4.2 Lower crust
The third-order detailed image (Fig. 5C) displays some local features with positive anomalies, which are not dominant in the western part of the map, as observed on the second- or fourth-order detailed images. The estimated depth of the source of the anomalies responsible for this feature is 13 km (see Table 1 above) and could correspond to the transition zone between upper crust and lower crust structures. This transition can also be observed on the shear wave velocity model by Tokam et al. (2010), where the model shows a positive velocity contrast at a depth 10–13 km as seismic velocities generally increase with densities. On the fourth-order detailed image (Fig. 5D), we can distinguish once again two main areas as observed on the second-order approximate image (Fig. 4A). The anomalies trending positively in the west can be interpreted as crust thinning, while anomalies trending negatively in the east might result from crust thickening. From an estimation using the power spectrum, the fourth-order detailed image (Fig. 5D) has an average depth of about 24 km, which is similar to the depth of 25 km for the Moho estimated by Tokam et al. (2010) using an inversion of seismic waves. Ateba et al. (2009) also revealed that the foci of most earthquakes occur above 25 km. The trends of the Tiko and Ekona faults, which are known as the most active ones in the studied area (Ambeh et al., 1989; Ateba and Nteppe, 1997), can be clearly observed on the fourth-order detailed image (Fig. 5D). This can suggest that the influence of active fault systems around Mount Cameroon is as deep as 25 km and that faults can serve as magma conduits.
5.4.3 Uppermost mantle
The estimated depth of the fifth-order detailed image is 33 km (Table 1, Fig. 6E). At this depth, the image is globally similar to the approximate images (Fig. 4), as we reach regional patterns. The signal at this depth is predominantly positive, even though there are some spots of low gravity anomalies located in the centre of the area, with values not lower than −9 mGal. However, there are still significant gravity gradients between the west and the east of the study area, as previously highlighted. This suggests different mantle composition between west and east or variable Moho depths. This feature can be interpreted as revealing a thicker crust in the east, while structures with mantle composition are already present in the west at this depth. On the sixth-order detailed image (Fig. 6F), the density distribution follows the same shape with the entire study area covered by positive anomalies. This comforts the idea of variable mantle state in the study area, which can be explained by a difference in composition or temperature. The literature points out small-scale convection between the cold and thick Congo craton, and thinner and hotter Panafrican Mobile Belt as the mechanism at the origin of the CVL (Reusch et al., 2010, 2011). Moreover, most of deep earthquakes (∼25 km) in the Mount Cameroon area are thought to be associated with the zone of weakness, possibly a magma conduit (Ambeh et al., 1989), to the uplift of upper mantle (Ateba and Nteppe, 1997) or to the brittle failure of the lower crust induced by the flow of magma rising from the asthenosphere (De Plaen et al., 2014). The zone of weakness whose surface signatures are the observed faults can be correlated with the area of significant gradients pointed out earlier on the gravity detailed images. It extends from the upper crust to the uppermost mantle, suggesting a path for the rising materials from the mantle.
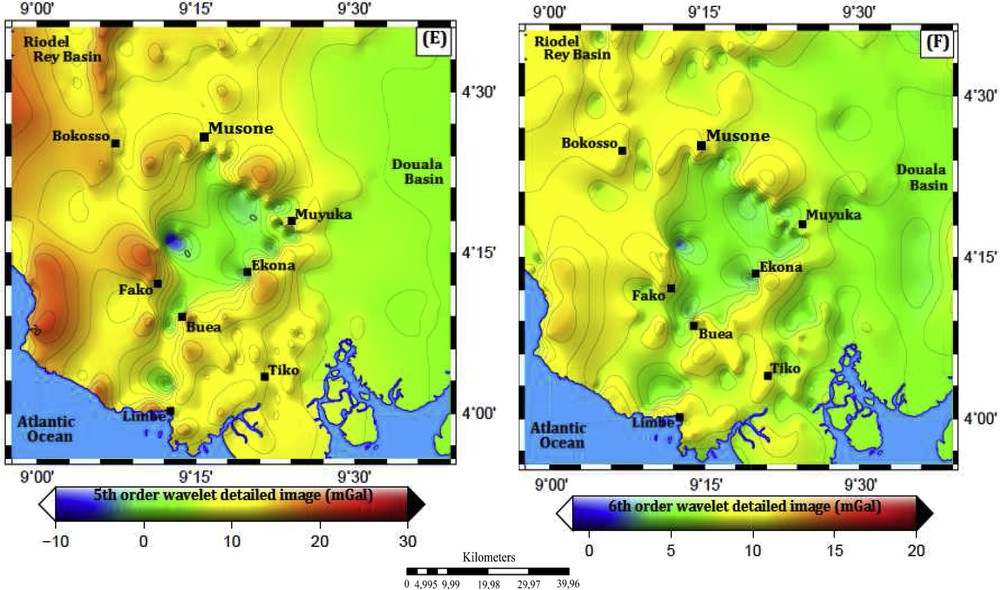
Wavelet decomposition results of the Bouguer gravity anomalies in the Mount Cameroon area at different scales from 2-D multi-scale wavelet analysis. (E) to (F) correspond to the first- to fourth-order detailed images, respectively. The grey thick lines are gravity contours. Black squares are cities.
In order to check the existence of small-scale features between fifth- and sixth-order wavelet images, we computed the difference between sixth- and fifth-order detailed images (Fig. 7). The resulting image shows some local features with gravity anomaly varying eastward from +10 to about −5 mGal, suggesting the existence of some local density contrasts between depths of 33 and 40 km. These contrasts can be associated with the change in temperature or composition as the materials rise from the asthenosphere through the magma conduit.
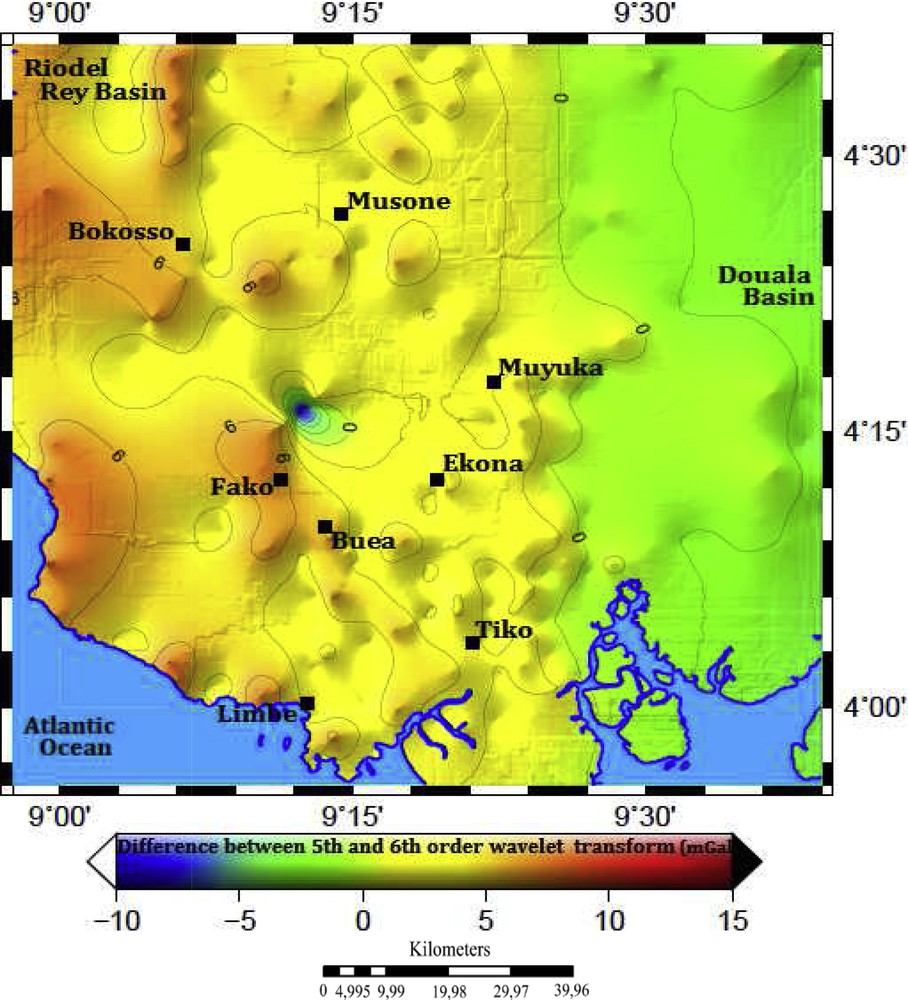
Difference between gravity anomalies of fifth- and sixth-order wavelet decompositions.
6 Conclusion
In this paper, the multi-scale wavelet transform has been used to separate gravity anomalies into their regional and residual components. The obtained detailed and approximate images are used to analyse the structural characteristics of the lithosphere beneath Mount Cameroon and its surrounding area. The analysis of power spectrums helped to estimate the average depth of the causative source for each detailed image. The first- and second-order detailed images revealed the difference in composition of the upper crust between the East of the study area and the West. The presence of partially extended dense material in that layer (areas of positive anomalies) suggested that the development of the CVL did not affect that much this part of the crust.
The third- and fourth-order wavelet detailed images, characterizing the mid to lower crust, reflect the anomaly induced by the structure above the Moho discontinuity. The main findings are the thickening of the crust from the west to the east of the studied area and the clear trends of the Tiko and Ekona faults, which appear to be as deep as 25 km, corresponding to the estimated average Moho depth in the area. These faults belong to the active fault systems around Mount Cameroon and can serve as magma conduits, favourable to the various theories on the setting of CVL (e.g., Fairhead and Binks, 1991; Reusch et al., 2010, 2011).
The estimated source depths for the fifth- and sixth-order detailed images mainly reflect the anomaly trend induced by the Moho and the uppermost mantle material. The difference between the fifth- and sixth-order wavelet detailed images mainly reveals the anomaly induced by the pre-Cenozoic structures, including the density contrast interface, and it can be used in further studies (inversion and interpretation) of the pre-Cenozoic structures.
From the upper crust to the upper mantle, the gravity signal is getting more positive as depth increases and reaches approximate maximum values of ∼10 mGal on the sixth-order detailed image. Ambeh et al. (1992) found that the entire deepest earthquake (<25 km) around Mount Cameroon occurred in the Tiko and Ekona regions. The observed seismicity can be triggered by the uplift of the upper mantle or the failure of the lower crust induced by the flow of magma, and the resulting change in the lithospheric structure can explain the presence of dense material seen as positive anomalies on gravity maps. The crustal and mantle structure beneath Mount Cameroon involves a complex combination of crustal thickness, composition and thermal variations.
Our main contribution in this study has been to combine the effectiveness of the wavelet multi-scale method with the logarithmic power spectrum analysis to retrieve the crustal structure beneath the Mount Cameroon region. It provides new insights on the distribution of the geologic bodies at different depths. According to the results, crustal densities are laterally and vertically inhomogeneous beneath the studied area. The Bouguer gravity anomalies are complex in the upper crust than those in the lower crust and at deeper positions.
Acknowledgements
The gravity data used in this study has been obtained from IRD (“Institut de recherche pour le développement”) and INC (“Institut national de la cartographie”, Cameroon). The figures in the paper have been produced using GMT – we thank Paul Wessel, Walter H. F. Smith and the other authors of GMT. We thank Professors D. Gomez-Ortiz and C. Tiberi for their constructive comments. We thank Editor M. Campillo for handling the manuscript.