

1 Introduction
Crystal chain networks play a major precursor role in the formation of several magmatic textures such as dense crystal mushes (Philpotts and Dikson, 2000), shear localisation bands (Picard et al., 2011), crystal orientation domains (Ildefonse et al., 1992; Picard et al., 2011; Závada et al., 2009), and more generally in mineral foliation acquisition (Arbaret et al., 1996; Blumenfeld and Bouchez, 1988; Závada et al., 2009). In turn, shear-induced structures resulting in the spatial organisation of the crystals hold key information on processes such as the bulk strain tensor, strain localisation or the rheology of magmatic bodies during their ascent and emplacement at shallow depth (Paterson et al., 1998; Petford, 2003; Ubide et al., 2019; Voltolini et al., 2011; Závada et al., 2009). The development of crystal aggregates is commonly attributed to the process of synneusis during crystallisation or glomerocryst formation while crystals are being resorbed (Hogan, 1993). Two possible origins of crystal clusters are (i) the remains of remobilised crystal-rich layers disrupted during replenishment of the magmatic chamber (Laumonier et al., 2014; Seaman, 2000) and (ii) the combination of a heterogeneous distribution of crystals and repetitive transient interactions (i.e. collisions) that occur due to the relative motion of the crystals suspended in a flowing melt (Arbaret et al., 1996; Blumenfeld and Bouchez, 1988; Hogan, 1993; Ildefonse et al., 1992; Philpotts et al., 1998; Stickel and Powell, 2005; Tikoff and Teyssier, 1994). Such processes require crystal mobility in the flowing magma (Hogan, 1993). These interactions lead to the development of structural features such as transient tiling of anisometric crystals at very low solid fraction φ (typically much less than 0.1; Arbaret et al., 1996; Den Tex, 1969; Mulchrone et al., 2005; Tikoff and Teyssier, 1994) and clusters in which the number of involved particles increases with increasing the solid fraction φ (Philpotts et al., 1999). A unique cluster geometry forming a continuous network is reached at the so-called minimal critical solid fraction φc that depends on particle shape and size distributions and on the particles' overall orientation distribution (Garboczi et al., 1995; Lorenz and Ziff, 2001; Pike and Seager, 1974; Saar and Manga, 2002; Saar et al., 2001). For spheres, φc is 0.2896 (Lorenz and Ziff, 2001; Shante and Kirkpatrick, 1971). The relationships between the solid network and the rheology of crystallising magmas close to, and passing through, φc have been widely examined using experimental (e.g., Picard et al., 2011) and numerical approaches (e.g., Saar et al., 2001). The early development of crystal aggregates and their effect on the rheological behaviour of magmas with low crystal fractions, typically less than about 20%, remain poorly constrained. Here, we present the results of SPO measurements of isolated versus aggregated crystals in an experimentally deformed low-concentrated magmatic suspension by using both 3D X-ray computed tomography and 2D sectional analysis. The analogue magmatic suspension is composed of a water-undersaturated aluminosilicate melt mixed with a volume fraction of crushed alumina grains fixed at φs = 0.16 and residual air bubbles of φb ~0.01. The fabric of the residual bubbles is also measured as it gives key information on local flow properties. The influence of both isolated and imbricated crystals on the flow properties such as the tortuosity of the streamlines quantified by the bubbles' SPO is discussed. The results are compared with previous two-dimensional analogue experiments and discussed in terms of relationships between the SPO, the clusters properties, the tortuosity of the flow, and the applied finite strain. Consequences of crystal clustering on the change in viscosity of magmas at low crystal fractions, as measured during shear experiments, is discussed.
2 Experimental procedure
2.1 Starting material
The starting material is composed of a hydrous glass (2.5 wt % H20) mixed with a solid phase consisting of crushed alumina crystals with a sieved fraction of 45 μm < ∅ < 90 μm (Fig. 1a). The synthesis procedure is detailed in Champallier et al. (2008). The dry glass was synthesized by Schott AG, Germany, and has a haplogranitic composition (Dingwell et al., 1996; Holtz et al., 1992; Schulze et al., 1996; SiO2 = 79.23, Al2O3 = 12.44, Na2O = 4.43 and K2O = 3.90% as measured by microprobe analysis; Champallier et al., 2008). The solid volume fraction is φ = 0.16 (HPG 5 of Arbaret et al., 2007). Among the available volume fractions, we have chosen this concentration because grain separation in computed tomography images becomes hardly achievable for larger solid fractions (Saar and Manga, 2002; Saar et al., 2001). Alumina was chosen to avoid any crystallisation/dissolution of the grains during the timescale of the experiment (<3 h), thus ensuring constant melt composition, solid fraction, and melt water content during deformation. The bubble fraction is composed of residual air bubbles whose volume fraction φb of 0.01 is stable during the overall experimental process of synthesis and deformation. Additionally, this bubble fraction is low enough to consider interactions on the rotation and displacement of neighbouring solid particles as negligible.

(a) High-resolution X-ray computed tomography (HRXCT) sectional image, 720 μm in width, of sample PO514. Crystal fraction φs = 0.16 and bubble fraction φb = 0.01. The voxel size is 1.4 μm. Light grey is interstitial melt, medium grey is alumina grains, and black areas are voids (residual bubbles). (b) Sectional image after the treatment by median filtering followed by “anisotropic diffusion 2D″ filtering. (c) Final segmented image. White is “background” (melt + bubbles) and black is alumina grains.
2.2 Deformation setup
High-temperature high-pressure torsion experiments that allow deformation to large strains were performed in an internally-heated gas-medium deformation apparatus (Paterson instrument, Australian Scientific Instruments). The experimental set-up and techniques have been described by Paterson and Olgaard (2000). A cylindrical sample, 14.9 mm in diameter, 7.06 mm in length and with ends parallel to within 3 μm was cored and machined from the synthesized material. During deformation, the sample was held between alumina pistons and jacketed in copper. Experiments were conducted at a confining pressure of 300 MPa and temperatures ranging from 475°C to 550°C using the torsional configuration (Paterson and Olgaard, 2000). Thermal gradients within the samples were <1°C·cm−1. Three experiments (PO514, PO519 and PO610) reached shear strains γ = 2.6, 17.5 and 7.0, respectively, at angular displacement rates ranging from 2 × 10⁻⁴ s−1 to 2 × 10⁻³ s−1 at the outer radius of the cylinder (see Tables SM1 and SM2 in the Supplementary Material). At these applied strain rates, the suspension exhibits a Newtonian behaviour with a stress exponent n = 0.99±0.22 and an apparent log viscosity of 10.4 (strain rate ~ 6.10−4 s−1 and T = 500°C; Arbaret et al., 2007; Champallier et al., 2008).
3 Data acquisition and processing
3.1 Three-dimensional X-ray computed microtomography analysis
High-resolution X-ray computed tomography (HRXCT) is a non-destructive technique that yields the separation in a volume of phases of different compositions and densities (Baker et al., 2012; Gualda and Rivers, 2006; Ketcham, 2005a, 2005b; Ketcham and Carlson, 2001; Mees et al., 2003). The microtomography measurements have been performed at the Materials Science Beamline MS of the Swiss Light Source (SLS) of the Paul Scherrer Institut (Switzerland). The characteristics of the electron source and of the detector of the microtomographic beamline have been described by Stampanoni et al. (2002).
The measurements were conducted on a piece of sample PO514, 720 μm in width and 10 mm in length, taken close and with its long axis parallel to the polished surface of the section used for the two-dimensional image analyses (Fig. 1a; section 3.2). Raw data were acquired with a low-noise CCD camera with a resolution of 1024×1024 pixels. The in-plane and slice spacing are such that the voxels are 1.4 μm sides. The complete image treatment process was done using ImageJ (http://rsb.info.nih.gov/ij/). First, reduction of randomly distributed noise, beam hardening and ring artefacts were realised on the slice of 1024 images by applying successively the median filtering and the “anisotropic diffusion 2D″ filtering (Fig. 1b). Second, bubble and crystal phases were separated from their background (the glass) by segmentation before filling all holes in objects in the resulting binarised images (Fig. 1c). Image analysis was performed using Blob3D (Ketcham, 2005a). The first step was to classify each voxel in one of the three classes (glass/matrix, crystals, and bubbles). The second step was to separate objects from each other in both bubble and crystal classes. The details of the procedure are described in Ketcham (2005a; 2005b) and Gualda and Rivers (2006). During this procedure, the number of resulting single particles found in each cluster was noted for further statistical analysis. The third procedure of Blob3D, named “EXTRACT,” yielded particle shape fabric information such as volume, location, contacts relationships and orientation of the particle's long axis. The latter is called hereafter orientation αp. The three-dimensional directional properties of the shape fabrics were determined with the Quant3D software (Ketcham, 2005b). Computed axes issued from Quant3D allowed us to define the shape properties of the fabric ellipsoid by using the Jelinek parameters that are the symmetry T, which varies from −1 (prolate ellipsoid) to 1 (oblate ellipsoid) and the eccentricity P' (see Borradaile and Werner, 1994 for the formulas).
3.2 Two-dimensional image analysis
Polished sections were prepared from deformed samples parallel to the [XZ] plane (with X the direction of shear, and Z the normal to the [XY] plane of shear), close to the outer surface of the sample. In this plane, deformation occurs approximately by simple shear with a finite strain called hereafter γsec, which should not to be confused with γ, the maximum strain reached at the maximum radius of the cylindrical sample. Sectional shape fabric measurements were performed on Scanning Electron Microscopy (SEM) images obtained with a JEOL JSM-6400 (ISTO, Orléans). The two-dimensional shape properties of both alumina and bubble phases were determined by applying the inertia tensor method (program SPO2003.EXE; Launeau, 2004; Launeau and Cruden, 1998). The shape fabric of both alumina grain and bubble populations is obtained by averaging the single object inertia tensors. The method quantifies the fabric direction α (−90°<α < 90°, positive for a clockwise orientation with respect to the dextral shear direction α = 0), and its degree of anisotropy expressed by the axial ratio R (Launeau and Robin, 1996; Launeau et al., 1990; Saltikov, 1958).
4 Results
4.1 Fabric properties of the starting material
The shape and fabric properties of both the alumina crystals and the residual bubbles were measured on several randomly oriented sections cut in the starting material (an example of a sectional view is shown in Fig. SM1 in the Supplementary Material). The crystal population displays a lognormal distribution with an average axial ratio r = 2.35±1.14 (r = a/b, with a the long axis and b the short axis). The crystal population does not exhibit any significant shape preferred orientation with R = 1.016 (Fig. SM1 in the Supplementary Material, left). The fraction of residual bubbles preserved after sample hydration does not exhibit a significant shape preferred orientation with R = 1.056 (Fig. SM1 in the Supplementary Material). This suggests nearly isotropic pressure conditions during synthesis.
4.2 Three-dimensional fabrics
4.2.1 Alumina grains
A total of 377 alumina grains were analysed from microtomographic images (Fig. 2). The spatial distribution of grains is illustrated by the surface percentage calculated on the 1014 images forming the analysed volume (Fig. SM2 in the Supplementary Material). The surface percentage of alumina grains varies from about 10% to more than 28%. This indicates that the spatial distribution is not homogeneous, even though these results should be considered carefully as the ratio between image and average grain size is low. In addition, the arithmetic mean and median of the surface percentages are close to the volume fraction of 16.3% achieved during the synthesis procedure. Such similar percentages ensure that the threshold procedure was adequately performed on tomographic images.
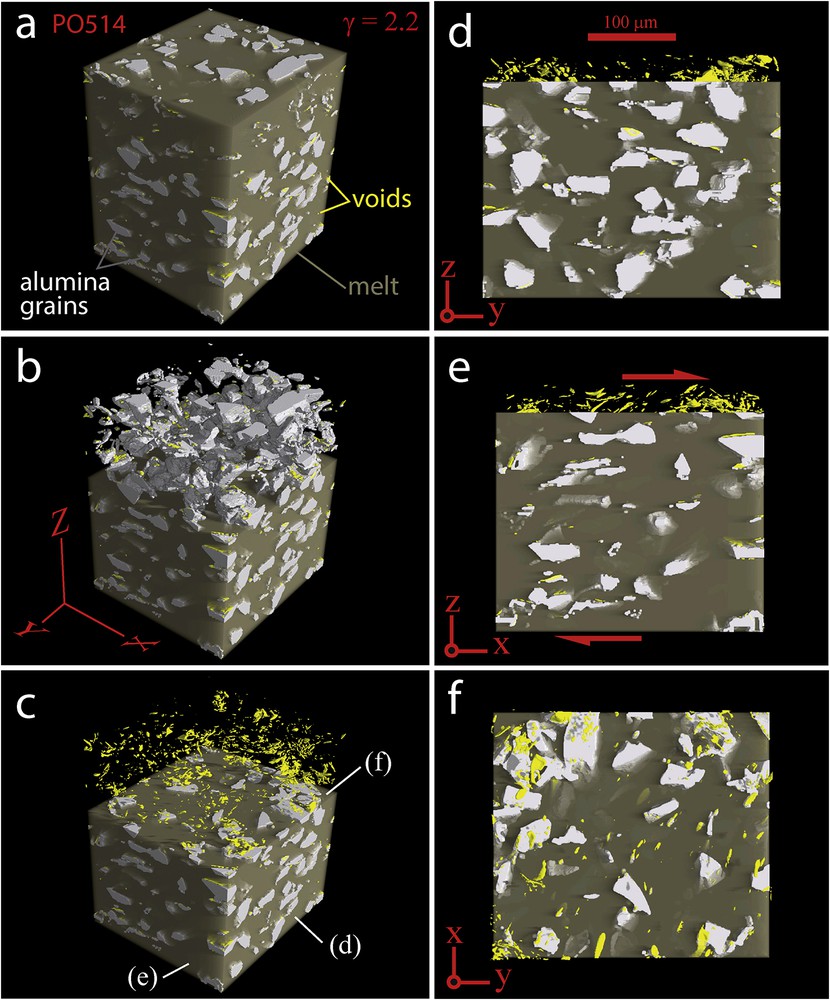
(a) Three-dimensional view of the segmented volume issued from PO514 experiments (visualization performed with VGStudio MAX software, Volume Graphics©). Light grey is the alumina grains, yellow is the voids and cream colour is the melt. (b) Same view as (a) without melt on the top part of the volume. (c) Same view as (b) without alumina grains on the top part of the volume. (d), (e), and (f) refer respectively to the sectional, [y,z], [x,z], and [x,y] views. Note the strong shape preferred orientation of the alumina grains with respect to the dextral sense of shear (Fig. 2e).
The grain population formed both isolated grains (59.6%) and clusters of touching grains (40.4%). The spatial positions of clusters in the analysed volume correspond to the maximum local surface percentages (Fig. SM2 in the Supplementary Material). Among the 29 clusters separated in the volume, 21% are trains of less than 6 grains in which 27% are constituted of pairs of tiled grains (5 clusters). These trains are elongated at about 20° to the shear direction (Fig. 3a). In contrast, larger clusters do not show a clear shape preferred orientation on tomographic images (Fig. 3b). The range in grain-size distribution between 1.8 and 5.3 log·μm3 is comparable for isolated grains and grains involved in clusters (Fig. 4a). However, the isolated grains seem to be in majority larger in size than the clustered-grain population, which consists mostly of large grains mixed with residual fragments resulting from electrostatic aggregation preserved during the sieving procedure (Fig. 3b).
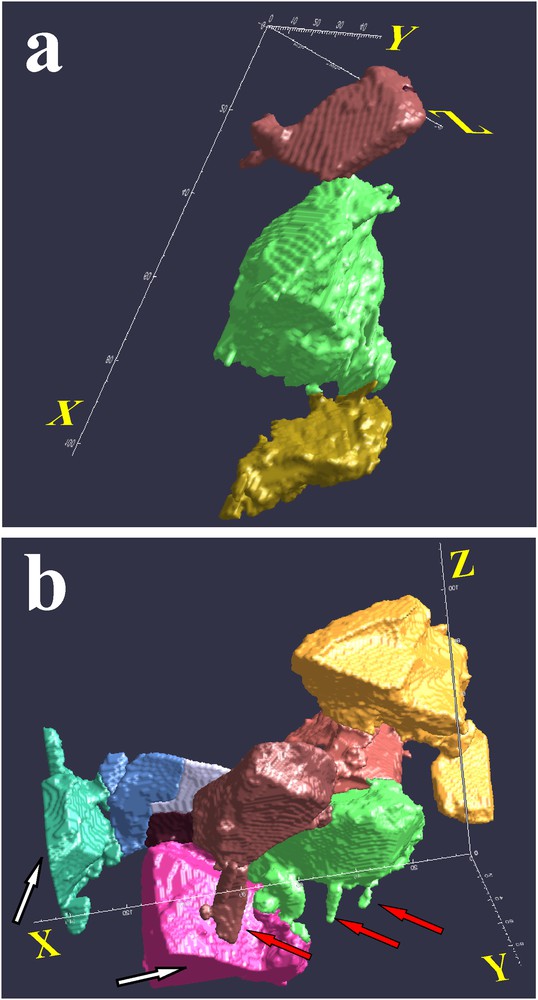
Examples of clusters. (a) Train of three grains whose orientation is closely parallel to the direction of shear (x-axis). (b) Cluster (glomerocryst) of 8 grains. White arrows: truncated grains alongside the volume. Red arrows: residual fragments possibly electrostatically agglomerated.
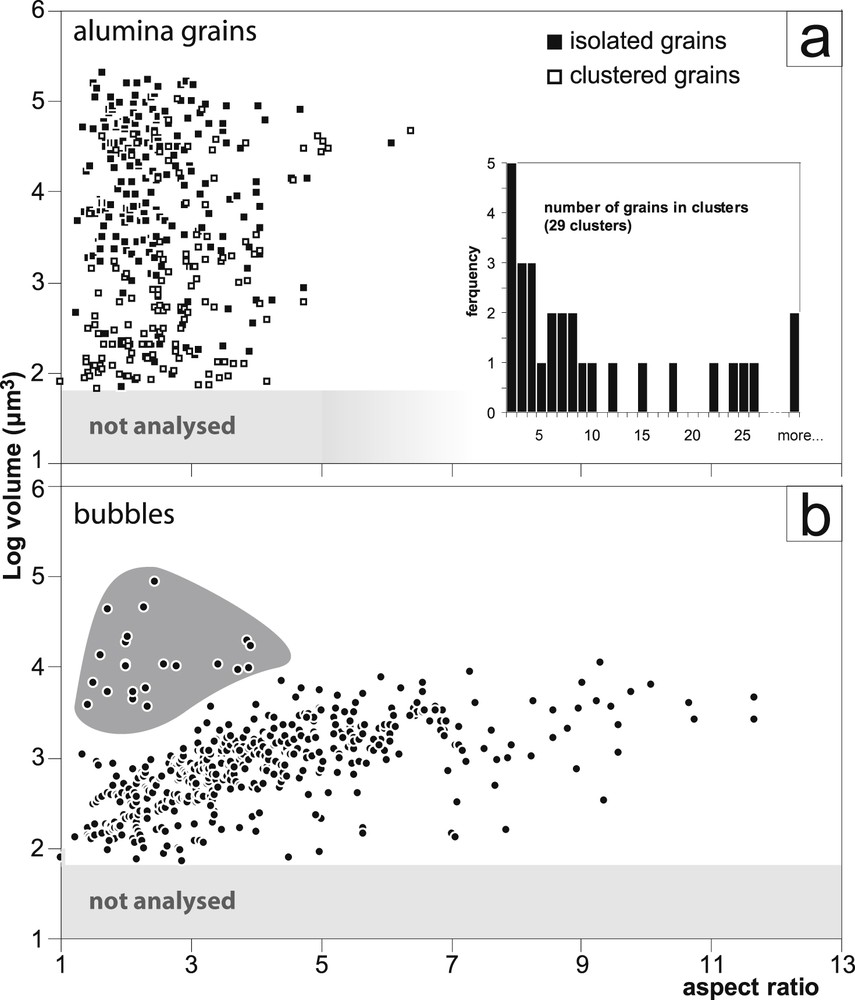
Aspect ratio and respective volume of analysed objects in the volume of PO514 experiment (BLOB3D analysis). Objects of less than 1.8 m3 are not analysed. (a) Volume distribution of alumina grains. Inset diagram: frequency of clusters with respect to the number of grains in the cluster. (b) Volume distribution of residual bubbles. Note the positive correlation between the volume and the aspect ratio. Grey area isolates large voids that are related to alumina grain crushed during the synthesis.
The shape preferred orientation (SPO) of the whole population constituted by 377 alumina grains is weak (Dmax = 3.43; Fig. 5a). Its shape fabric is characterised by a foliation parallel to the shear plane and a poorly defined lineation at 30° to the direction of shear (Fig. 5a). The shape fabric of the clustered grains population is weak, close to that found for the whole population (Dmax = 3.47; Fig. 5b). This fabric is characterised by a poorly defined foliation that bears a lineation at about 20° to the direction of shear. By contrast, the shape fabric of the isolated grains is the strongest (Dmax = 6.25; Fig. 5c). The corresponding foliation and lineation are closely parallel to the plane and direction of shear, respectively.
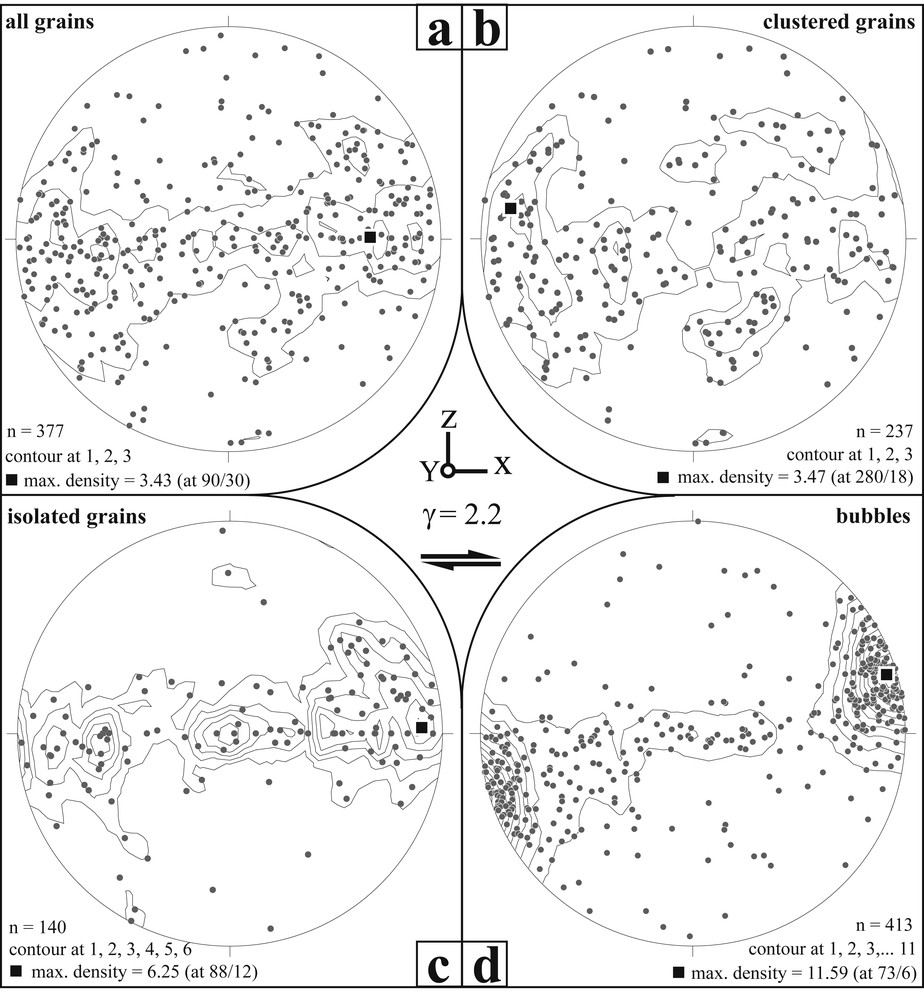
Orientation data of the PO514 experiment. The plane of the stereograms corresponds to the [x,z] plane of the deformation ellipsoid, with x the direction of the dextral shear. All plots are lower-hemisphere equal area projections. (a) For all alumina grains. The mineral lineation (maximum density of the orientation population) is at 30° from x with a foliation plane parallel to the plane of shear. (b) For clustered grains. The mineral lineation is at 18° from the direction of shear with a scattered distribution forming a poorly defined foliation plane. (c) For isolated grains. Mineral lineation and foliation are closely parallel to the direction and the plane of shear, respectively. The foliation plane is well defined. (d) For residual bubbles. The lineation formed by the passive elongation of the bubbles is at 17° anticlockwise from the direction of shear as expected from the March (1932) model for γ = 2.2 (see Arbaret et al., 2007).
The fabric ellipsoid of the whole grain population, calculated with Quant3D, exhibits a planar shape and an eccentricity of 1.34 (Fig. 6a). These shape characteristics are close to those obtained for the ellipsoid of the clustered grain sub-population (Fig. 6b). By contrast, the eccentricity of the isolated grain sub-population is significantly higher, with P' = 1.5 (Fig. 6c). These results are in accordance with the fabric characteristics obtained from the maximum density contours calculated by using the stereonet projections (Fig. 5).

Fabric ellipsoids for the four subpopulations (as defined in Gig. 5 and with a similar orientation view with respect to the strain ellipsoid) calculated with Quant3D (Ketcham, 2005a, 2005b). P′ and T are the shape and eccentricity parameters of the ellipsoids, respectively (Borradaile and Werner, 1994).
4.2.2 Bubbles
A total of 413 bubbles were found in the tomographic volume and are recognized as the residual bubbles. Although we did not analyse their spatial and size distributions over the entire volume, we infer that these voids consist of two populations (Fig. 4b). The largest voids exhibit an irregular and weak anisometric shape with a size distribution close to those of the largest alumina grains (bubbles population underlined by the grey envelop in Fig. 4b). Most of them are recognised as voids between neighbouring crystals in clusters. The rest of the voids are smaller, with aspect ratios r varying from nearly 1 to about 12, and are more homogeneously distributed and isolated over the analysed volume (Fig. SM3a, b, c in the Supplementary Material). Coalesced voids are present but rare (Fig. SM3d in the Supplementary Material). A positive correlation is found between the aspect ratio and the size of this second population of voids (Fig. 4b). The smallest voids are usually found in the pressure shadows of isolated grains, where their initial isometric shape is almost preserved. By contrast, the most deformed bubbles are found either between alumina grains moving away or on the side of isolated grains (Fig. 7).
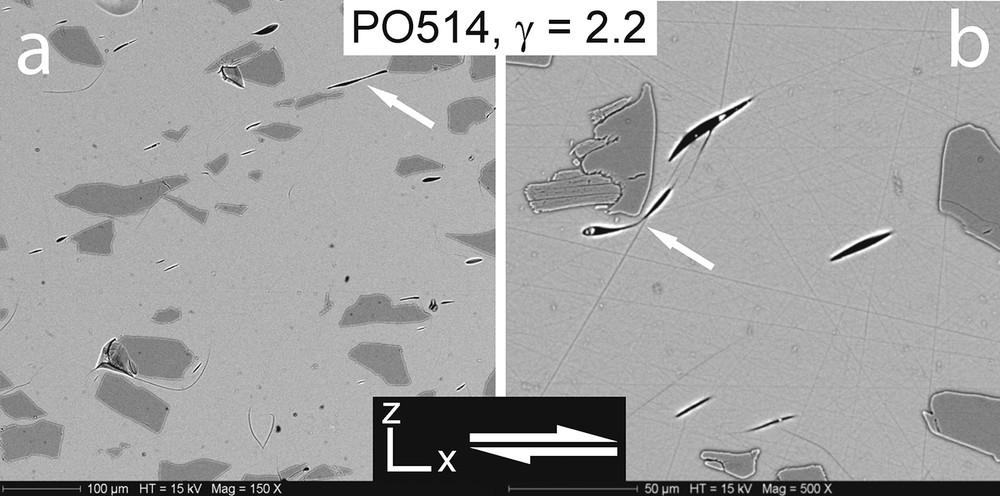
SEM backscatter images of [x,z] sections of experiment PO514. Most deformed bubbles are found either between alumina grains moving away (a, white arrow) or on the side of isolated grains (b, white arrow).
The SPO of the voids is well defined (Dmax = 11.59, Fig. 5d) and it is characterised by a main plane that bears a lineation at about 17° from the direction of shear. The corresponding fabric ellipsoid calculated with quant3D yields a comparable orientation and shape (Fig. 6d).
4.3 Two-dimensional fabrics
While we analysed only one experiment (PO514) by X-ray tomography due to the complexity of the image acquisition and treatments and subsequent 3D fabric analyses, we measured two-dimensional fabrics on the complete series of experiments from the analysis of classical SEM images. The three experiments PO514, PO610, and PO519 reached different maximum finite strains of 2.6, 7.0, and 17.5, respectively. In polished [XZ] sections prepared close to the outer surface of each sample, the effective finite strains are γsec = 2.0, 6.1, and 15.0, respectively (Fig. 8a). For each section, a mosaic of SEM images was assembled to form large scale images in order to perform a two-dimensional SPO analysis on representative alumina crystal and bubbles populations. The number of alumina grains exceeds 594 objects, while 276 bubbles at least were analysed in one section (Fig. 8b). We express the resulting 2D shape fabric ellipses in terms of orientation α of the major axis and axial ratio R (Fig. 8c).
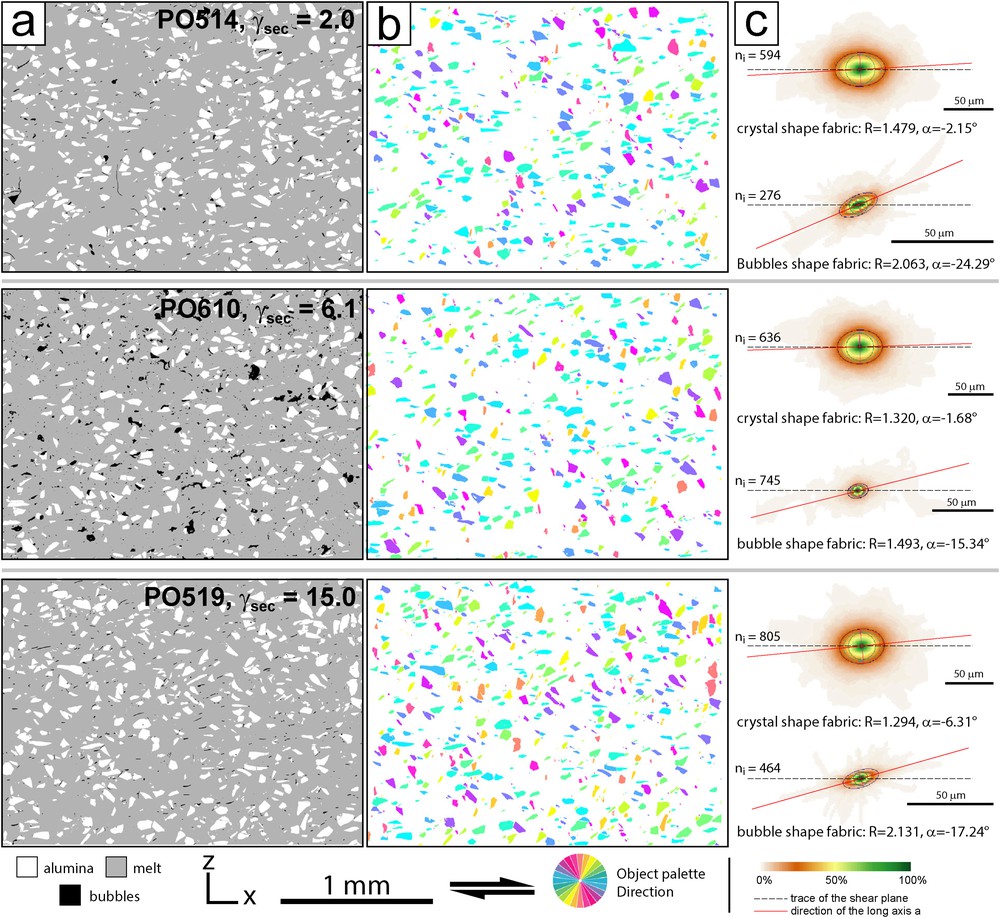
(a) False grey-level images of [XZ] sections of three samples deformed to different finite shear strains. Here γsec are estimated finite shear strains of the respective analysed sections. Grey is the interstitial melt, the white area is alumina grains, and the black area is residual bubbles or regions were grains were plucked during the polishing process (note extensive plucking in PO610). (b) Coloured particle with respect to the colour range direction. (c) Shape fabric of alumina grain and bubble populations expressed by the mean inertia tensor ellipse calculated from single-object inertia tensors (Launeau and Robin, 2005).
4.3.1 Alumina grains
For the three experiments, grain shape fabric orientations α are stable and close to the shear direction X, irrespective of the finite strain (α = −2.15°, −1.68° and −6.31°; Fig. 8c). Rose diagrams of the single object inertia tensor orientations αp yield comparable average orientations and show a unimodal distribution that widens with increasing strain. This trend is consistent with the decrease in axial ratio of the mean tensor ellipse from R = 1.48 at γsec = 2.0 to R = 1.29 at γsec = 15.0.
4.3.2 Bubbles
The bubble shape fabric orientation α is −24° for γsec = 2.0 and stabilises at about −16 to −17° for higher finite strains (Fig. 8c). The intensity of the shape fabric ranges from R = 1.38 to 2.24. The lowest value is recorded in PO610, where several alumina grains were plucked during polishing, leaving black irregular areas in the images (Fig. 8a). Although we tried to manually suppress the largest areas, residual traces of plucked grains incorporated into the bubble phase during the segmentation process likely contributed to an underestimation of the value of R.
5 Discussion
The experiments performed in this work focused on the development of cluster structures in a sheared synthetic magmatic suspension. We performed three series of experiments and one sheared sample was analysed in three dimensions. We have not considered the shape fabrics of the residual bubbles fabric as they are only used as local strain markers in our study. A detailed analysis of bubble fabric evolution and rheology in similarly experimentally deformed medias is achieved by Arbaret et al. (2007; see also Pistone et al., 2013). We focus here on the fabric of isolated crystals and clusters, on cluster formation and their implication for fabric development including crystal segregation and initiation of strain localisation during the early crystallisation of magmas.
5.1 Rheology of the solid suspension
It is now usually recognised that the development of crystal-rich domains has consequences on the rheological behaviour of magma (Hoover et al., 2001; Muller et al., 2010; Petford, 2003). Although the influence of the clustering of solid particles on the mechanical behaviour of the solid suspension was not within the scope of this work, varying shear strain rates from 2 × 10⁻³ to 2 × 10⁻⁴ s−1 (Table 2 in the Supplementary Material) allowed us to determine the rheological behaviour of the suspension. We found a Newtonian behaviour with a stress exponent n = 0.99 ± 0.22 and an apparent log viscosity of 10.4 at a strain rate ~6 × 10⁻⁴ s−1. This means that, even though large clusters of crystals are present in our suspension, they do not intensify the tortuosity of the melt flow enough to increase the apparent viscosity significantly.
The development of an important crystal framework in a particle–fluid suspension is classically related to a change in rheology with an onset of a yield strength (Bingham behaviour, Hoover et al., 2001; Saar et al., 2001). This onset is significantly dependent on the anisotropy of crystals (Picard et al., 2011). Hoover et al. (2001) and Saar et al. (2001) report on the development of a yield strength for crystal fractions as low as 20%, formed of plagioclase-like shaped particles with an aspect ratio of more than 4. We did not measure any yield strength in our experiments. Our alumina grains exhibit an average aspect ratio of 2.34 (Fig. SM1, Supplementary Material), hence insufficient to change the behaviour of the suspension from Newtonian to Bingham rheology.
5.2 Fabric of the population of isolated crystals
The shape fabrics measured for isolated crystals in the experimentally sheared magmatic suspensions are stronger than those reported for crystals embedded in clusters (Figs. 5 and 6). This strong fabric is not in accordance with the theoretical fabric evolution predicted by Jeffery's model (Fernandez et al., 1983; Gay, 1968; Jeffery, 1922; Jezek et al., 1994; Willis, 1977). This model, which considers crystals far enough from neighbours to avoid any direct contact interaction or matrix deformation disturbances, predicts cyclic shape fabrics developed by rigid-body rotation of the crystals (Arbaret et al., 2000; Fernandez et al., 1983; Gay, 1968; Jeffery, 1922; Jezek et al., 1994; Willis, 1977). Departure in shape fabric intensity from this model has been observed in 2D analogue (Arbaret et al., 1996; Fernandez et al., 1983; Ildefonse et al., 1992), 3D analogue (Arbaret et al., 2013), and HP/HT experiments (Arbaret et al., 2007). All these studies agree that this departure originates from the transient collisions that develop by combination of the relative displacement in the sheared media and the altered rotation of collided crystals. This process, called tiling feature (Arbaret et al., 2000; Fernandez et al., 1983; Mulchrone et al., 2005; Stickel and Powell, 2005), is known to produce stable fabrics (i.e. foliation and lineation closely parallel to shear plane and direction respectively, Arbaret et al., 2013) at strain γ > 2–3. However, such shape fabrics exhibit lower intensities than the ones reported in our experiments for isolated crystals. A possible explanation can be drawn from the particular organisation of the crystals in the sheared media. The heterogeneous distribution of crystals generates the development of confined spaces where the shear media is forced to flow between and around large crystal clusters. In such confined spaces, the degree of confinement increases, isolated crystals hardly rotate and their long axes statistically stabilize close to the local shear direction (Marques et al., 2005). Consequently, the average shape fabric of the isolated crystal population is much stronger than that expected for ideally distributed, non-interacting, crystals. Moreover, as recorded by residual bubbles in our experiments, the average direction of the streamlines makes an angle with the bulk shear direction (Fig. 5d) that remains constant at large strains (Fig. 8).
5.3 Fabric and stability of clustered crystals
While the formation of tiled features or trains is known to be a transient phenomenon (Arbaret et al., 1996; Stickel and Powell, 2005), the evolution in size, shape and fabric of large crystal clusters during shearing remains poorly understood. Their appearance and evolution depend on the crystal composition, size distribution, and spatial distribution in the sheared medium (Jerram and Cheadle, 2000; Okumura et al., 2006; Saar et al., 2001). Our experiments give a post-mortem integrated view. Deciphering the cluster dynamic would require making continuous observations during shearing, a procedure that cannot be followed in our experimental HP/HT setup. In particular, the aggregation of originally isolated particles into clusters remains poorly documented. In the same way, the possible progressive disaggregation of large clusters by either separation of particles one by one or by deformation of the cluster as a passively deformable object cannot be debated in the light of our results. Two-dimensional analogue experiments carried out in simple shear apparatus has allowed such continuous measurements of shape fabric evolution of interacting particles (Arbaret et al., 1996; Fernandez et al., 1983). Fig. 9 illustrates the change in fabric and spatial distribution in an analogue material starting with randomly distributed anisometric particles and a particle surface content of 16% close to the system deformed in the present study (Fig. 9a). At a finite strain of γ = 2, similar to the one reached in our experiment PO514, clusters of collided particles are developed and a global strong shape fabric is achieved. In such experiments, Arbaret et al. (1996) showed evidence that such cluster features remained transient during shearing. Indeed, for shear strains larger than γ ~5, 50% of the particles are statistically involved in collisions. Because the crystal content is similar in our 3D experiments, a similar conclusion can be proposed here.

Evolution of fabric orientation and spatial distribution from initially randomly distributed anisometric particles submitted to a two-dimensional dextral simple shear (particle surface content of 16%). Top: At γ = 0, the particles are randomly oriented. Bottom: at γ = 2, clusters of collided particles form trains oriented at about 45° clockwise from the shear direction associated with a strong stain fabric (modified from Arbaret et al., 1996).
The intensity of the shape fabric measured for clustered particles is much lower than that measured for isolated particles (Fig. 6). While particles forming trains of tiled particles show a close long axis orientation (Fig. 3a), in larger clusters the SPO is lower (Fig. 3b). The cluster forms a rigid framework that acts in the sheared media as a single object and can rotate in the same manner as a porphyroblast.
5.4 A field application: K-feldspar clustering in the Mansehra granite (Pakistan)
Isolated mushy zones are often interpreted as residual mushes originally developed either by sedimentary processes at the base of magmatic chambers or in cooled zones along border of plutons that are remobilised during replenishment processes (Farina et al., 2012; Seaman, 2000). The cluster formation (glomerocrysts) evidenced in our experiments is an alternative way to produce such features that act as rigid bodies in a flowing magma. In order to illustrate such fabrics due to clustering of crystals as documented in ours experiments, we measured sectional shapes fabrics of feldspar isolated as megacrysts and in glomerocrysts observed in the Mansehra granite, North Pakistan. The Cambro-Ordovician Mansehra granite is a calc-alkaline S-type monzogranite (Le Fort et al., 1980). The dominant porphyritic facies shows flow foliation of euhedral tabular K-feldspar megacrysts (Naeem et al., 2016) resulting from intrusion movements and superimposed flattening strain owing to the load of the sedimentary sequence (Fernandez, 1983). The size, amount and distribution of megacrysts vary at the outcrop scale. Fig. 10 show a metric scale [x,z] outcrop with regularly dispersed megacrysts whose sub-parallel arrangement is typical of flow-foliation and that wraps around a dense cluster (glomerocryst) of megacrysts. K-feldspar megacrysts have been segmented individually in the main fabric (red objects, Fig. 10) and in the cluster (yellow objects, Fig. 10). We calculated the mean orientation and eccentricity of the shape fabric by using the Inertia Tensor method (Launeau et al., 1990). In the main fabric, the K-feldspar population is composed of isolated crystals, 12% of the whole surface, with a strong fabric intensity R = 2.22 (eccentricity of the shape ellipse; Fig. 10). By contrast, the cluster is formed of an aggregate of K-feldspar megacrysts, 29% of the analysed whole surface, that exhibits a lower fabric intensity of R = 1.96. In addition, its average fabric orientation of about α = 98°, with respect to the vertical on the outcrop, differs significantly from that of homogenous main fabric of α = 161° measured around this cluster (Fig. 10). The differences in fabric intensities found between isolated K-feldspar and glomerocrysts are similar to those obtained in the experiments.
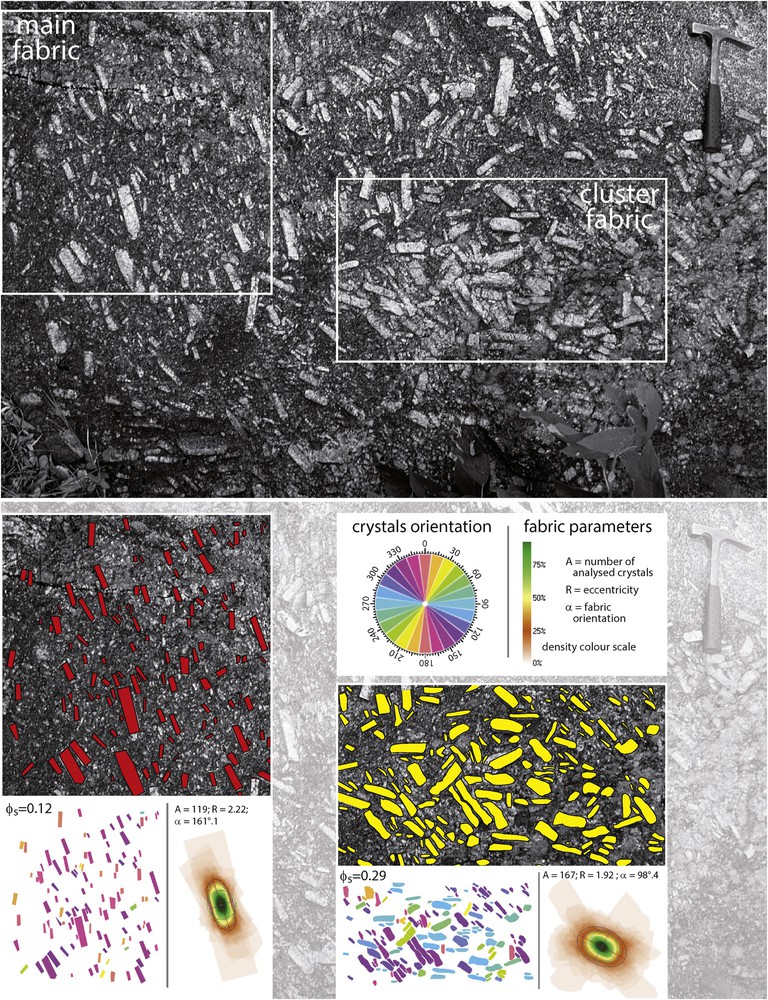
Top: Field image of K-feldspar megacryst fabrics in a [x,z] section from Mansehra granite, northern Pakistan. Bottom: shape fabric analyses of the main and cluster fabrics on selected areas, as shown on the top photography.
5.5 Implications for rheology and mineral fabrics in magmas
Our findings on rheological and fabrics properties measured in sheared synthetic magmas and their good correlation with a natural example provide some key information on the behaviour of flowing magmas.
First, the persistence of a Newtonian rheology at realistic magmatic strain rates indicates that partially crystallized magmas with 16 vol% of crystals likely flow as pure melts. Consequently, a significant amount of primary crystals can be transferred from their deep source (melting zone or deep reservoirs). This conclusion is consistent with petrological studies that reveal the complex history of crystallization at depth, transfer and subsequent growing in a shallower magmatic chamber of zoned megacrysts (e.g., Ubide et al., 2019).
Second, strain localization in such dilute systems appears in response to the partitioning between crystal chains and clusters and melt-rich domains. Strain localization in concentrated suspensions (i.e. when a jamming configuration is realized, e.g., Petford, 2009) is classically described in natural examples (Nicolas, 1992) and, more recently, in experiments (Arbaret et al., 2007; Picard et al., 2011). Our results indicate that strain localization appears in the crystallization history of magmas earlier than previously expected. This would promote early differentiation of sheared magmas by segregating the melt in emerging C′ like shear bands (Phillpotts et al., 1998).
6 Conclusion
We experimentally investigated the influence of crystal clustering on the shape preferred orientation (SPO) development during the deformation of synthetic magmas having about 16% in volume of crystals. We have shown that a fully connected solid network that could potentially induce the onset of yield strength and possibly a nonlinear rheology is not achieved in these suspensions. This is consistent with the measured Newtonian behaviour. We evidenced the control of the SPO of the clustered grains on the whole shape fabric. The angular relationships between the average foliation and cluster elongation is a potential good indicator of shear sense. Finally, we highlighted the strain partitioning between nearly non-deformed large clusters acting as rigid glomerocrysts and highly sheared zones in low-concentrated suspensions.
Acknowledgements
L.A. acknowledges support by the French Ministry of Education and Research (ACI JC3013, “Fabriques magmatiques”). This study is a contribution of the ERC RHEOLITH project (ERC Advanced Grant no 290864). M.B. acknowledges support by the Swiss National fond (Project No. 2000-0666.16) in Zurich and by the European Social Fund in Toulouse.