


 CC-BY 4.0
1. Introduction
Mayotte is an island located in the Indian Ocean, East of Africa, in the Mozambique Channel. Since 2011, it got the administrative status of France’s departments. The French seismic regulatory zonation (2010) classifies Mayotte’s territory as a zone of moderate seismicity (Zone 3 out of 5). Nevertheless, most of the buildings date from before the enforcement of seismic regulation. The recent demographic evolution is rapid and it is strongly affecting the dynamics of construction in the island. It is leading to the spread of informal housing and low-quality buildings. For these reasons, the level of seismic performance of the global building stock diverts significantly from the regulation’s standards.
Localization of earthquakes of the ongoing sequence and historical events.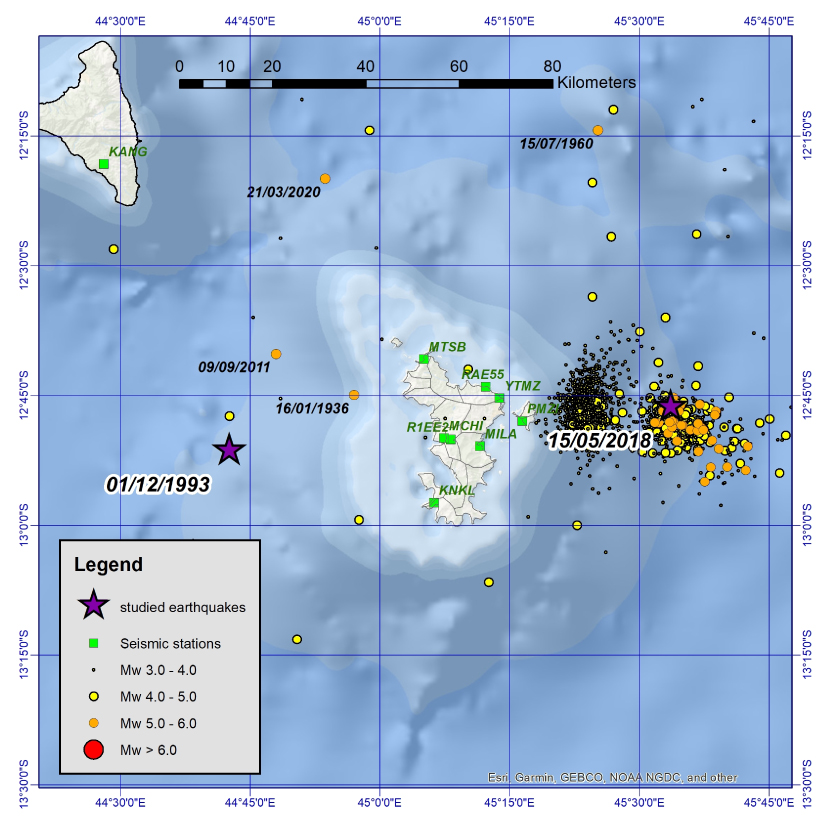
The ongoing seismic sequence results from a submarine eruption [Cesca et al. 2020, Feuillet et al. 2021, Lemoine et al. 2020]. The population felt hundreds of earthquakes, mainly during the first month of the crisis. The largest earthquake reached magnitude Mw = 5.9 and is reported to have damaged some buildings. Historical records also report that some destructive events have hit the island in the 20th century, for example in 1993 (Mb = 5.3, according to ISC, Mw = 5.5 [Bertil et al. 2021]) and in 1936 (see the historical database SisFrance Indian Ocean for example) (Figure 1). Consequently, prevention policies have to consider preparation for a destructive earthquake on the island as an important component of action plans.
The article focuses on the seismic risk in Mayotte, whether it results from the ongoing volcanic event or from the regional tectonics. It documents and releases a reliable dataset and an operational workflow for rapid loss assessment, considering the latest developments about the geodynamical context. The dataset is ready to assess consequences of future events, as well as to build realistic seismic loss scenarios that can illustrate the potential impacts of earthquakes. Two past earthquakes are simulated, for which there is documentation about their impacts on buildings: 1993 December 1 earthquake and 2018 May 15 main shock. Simulation results describe the operational outcomes of the workflow and set a basis for comparison between simulation and field observations, that contributes to justify the reliability of the key parameters provided as a reference dataset for seismic risk assessments.
2. Approach
Damage scenarios consist in simulating the damage on buildings resulting from a selected seismic configuration (also called event description or seismic scenario) and represent it in a way that can support decision-making process. Building realistic scenarios implies namely:
- to consider historical and recent seismicity,
- to take into account most recent data regarding geology and site effects,
- to derive vulnerability indexes taking into account the characteristics of local building stock,
- to elaborate a new geospatial dataset describing the distribution of the building stock by different typologies,
- to release results in a format that directly matches the needs of the decision makers.
The procedure for damage assessment follows the framework developed in the European project RISK-UE [Lagomarsino et al. 2002, RISK-UE 2003] for the European countries, which was also successfully applied on French overseas territories and other countries [Monfort et al. 2019, Negulescu et al. 2020, 2019, Sedan et al. 2013]. Slight adaptations of the vulnerability indexes that statistically describe the response of structures to shakings are required to fit the local building’s characteristics. It is important to mention that the approach is based on vulnerability indexes and is relevant statistically, but should not be applied to assess the potential damage to a specific building. Consequently, the results should be displayed only at a scale that is compatible with the precision of the entry data, in particular those describing site effects and building characteristics.
The VIGIRISKS platform, developed at BRGM, the French Geological Survey [Tellez-Arenas et al. 2019, Negulescu et al. 2019], is a tool that comprises risk computation modules, a data management system, and a convenient user interface. The computing module of the platform runs the algorithm of the Armagedom software [Sedan et al. 2013], which crosses geospatial information (acceleration, site amplification, and building types) to assess and to map damage indexes (Figure 2).
General procedure and workflow for the damage scenarios.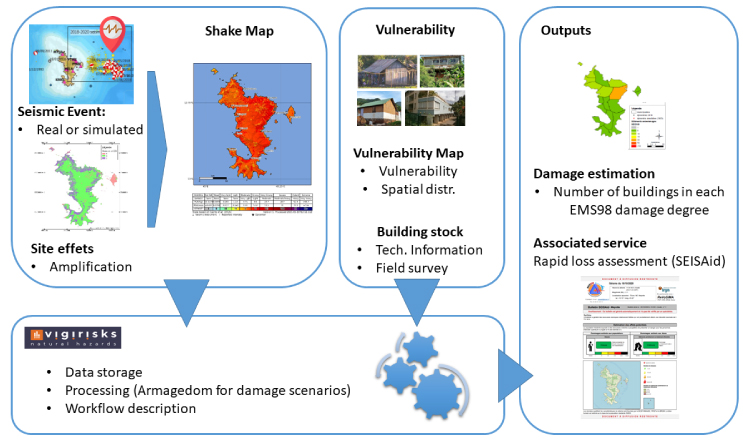
The classification of damage in five grades introduced in the European EMS-98 macro seismic scale [Grunthal 1998] is the reference for ranking the level of damage for common buildings (housing) in our simulations. This facilitates comparison of the results of the simulations with field data collected by GIM (Macro seismic field survey group) in 2018 and published in their field survey report [Sira et al. 2018].
Data and simulations are stored through the platform VIGIRISKS for future use. Thanks to web services, the calculation codes hosted by VIGIRISKS can also be used independently from the platform. For instance, the SEISAid tool developed by BRGM [see Section 4 and Guérin-Marthe et al. 2020] uses the code Armagedom, one component of the platform VIGIRISKS. It assesses automatically the probable losses associated to shake-maps [Gehl et al. 2017, Worden et al. 2018] for earthquakes that have just occurred on the French territory, and quickly produces reports for the local authorities. On the other hand, this damage assessment code makes it possible to pre-calculate credible scenarios for crisis management purposes and land use planning. They are also good communication supports to enhance risk-awareness: the French Ministry in charge of disaster prevention required such scenarios for the territory of Mayotte to BRGM.
Therefore, the workflow can handle either characteristics of pre-defined event or real events. In this article, the following configurations are considered (Table 1), as totemic events regarding seismic risk in Mayotte:
- The earthquake of 15 May 2018 (Magnitude Mw = 5.9), which is the main shock of the ongoing swarm.
- The earthquake of 1 December 1993 (Magnitude Mb = 5.3, Mw = 5.5), which occurred in the west of the island, and which was until 2018 one of the main regional earthquake to be considered for Seismic Hazard Assessment in Mayotte.
Both earthquakes produced slight structural damage to buildings, as detailed in post-event field survey reports [Europact 1995, Potin 1993, Sira et al. 2018].
Seismological characteristics of 1993 and 2018 earthquakes
| Earthquake of 1 December 1993 | Earthquake of 15 May 2018 | |
|---|---|---|
| Magnitude | Mw = 5.5 [Bertil et al. 2021] Mb = 5.3 (ISC) |
Mw = 5.9 (GCMT) Mb = 5.6 (ISC) |
| Coordinate of epicentre (Lat/Lon °) | −12.85; 44.71 | −12.80; 45.54 |
| Depth | 13 km | 40 km |
| Source hypocenter | ISC | Regional location from Bertil et al. [2021] |
| Distance to the coast | 40 km | 27 km |
| Distance to Mamoudzou | 59 km | 35 km |
3. Data collection
The reference dataset takes into account the results of the latest studies concerning geology and ground classification in Mayotte as well as the outcome of a dedicated field survey for building classification and distribution. Field investigations have completed existing data about the structural characteristics of the local building stock.
The key data for establishing the scenarios are:
- The shake-map corresponding to the scenario earthquake, which gives the spatial distribution of intensity measurements (IM) expressed in terms of peak ground acceleration (PGA) or macro seismic intensity (MI). The calculation of this shake-map requires in particular the characteristics of the earthquake scenario (magnitude, location, and depth), regional models of attenuation (Ground Motion Prediction Equations—GMPEs) and conversion between PGA and MI (Ground Motion to Intensity Conversion Equations—GMICEs), and a local model to take into account site effects, taking the form of an amplification factors map.
- Spatial distribution of buildings considering their level of vulnerability.
3.1. Site effects
Locally, site conditions influence the amplitude of the ground motion and result in very significant amplifications, causing additional damage to buildings if compared to those on rocky sites. Lithology, geometry of the outcropping geological formations or topography are main factors. This study only considers lithology. Since 2000, BRGM has done more than 30 seismic hazard assessments all over the island, for projects of educational estates for example. Consequently, it acquired both geotechnical and geophysical (H/V noise spectral ratio and MASW active surface wave method) data. Those data, combined with the latest release of the geological map at a scale of 1:30,000 [Nehlig et al. 2013, BRGM 2013] are the basis of the work, and is detailed in Roullé et al. [2021]. The map predicting lithological site effects according to the Eurocode 8 standard soil classes (class A to E) [NF EN 1998-1 2005] and their spatial extension uses the superficial weathering formations. Class A (rock) represents about 10% of the surface of the island and the remaining 90% lay on soil with amplification. Considering geological data and geophysical measures available in past studies, it appeared that class C reasonably represents the behaviour of these soils. Then, the corresponding site effects can be computed using soil related parameters in the GMPE used in the software ShakeMap 4.0 [Worden et al. 2020]. In the selected GMPE, the soil velocity (parameter Vs30 is the proxy for the type of soil: Vs30 = 800 m∕s for soil A, Vs30 = 270 m/s for soil C). The map in Figure 3 shows Vs30 values with a step of 100 m.
Map of the proxy for the site effects, based on the geological map of Mayotte from Nehlig et al. [2013]. Two soil categories, defined by their mean values of the soil velocity are considered in the calculations.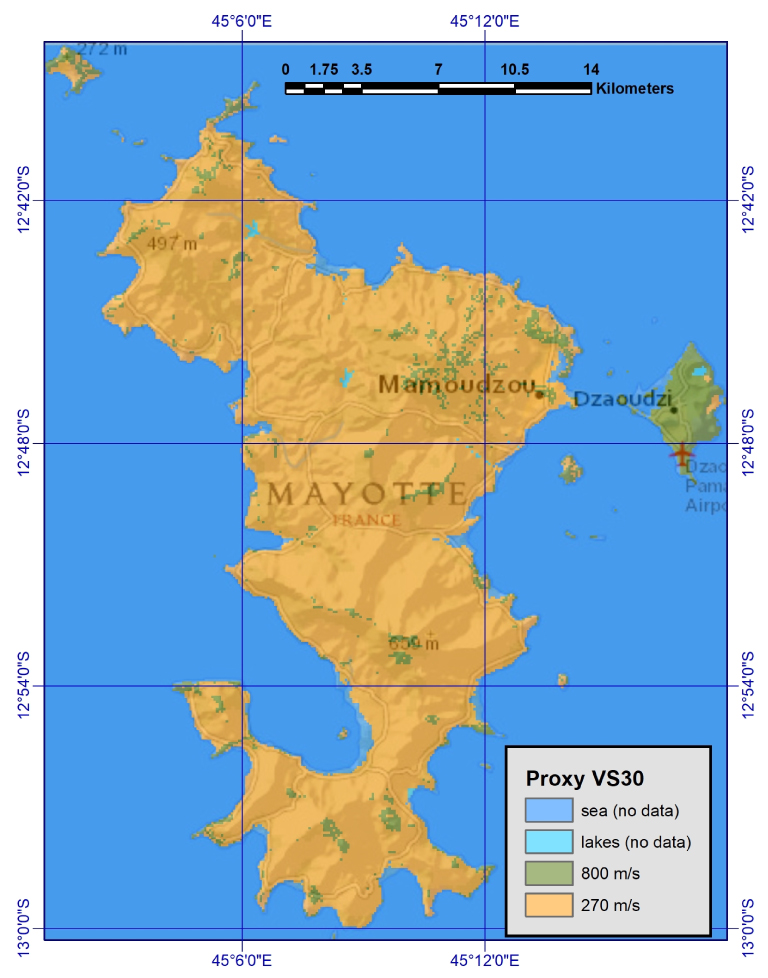
3.2. Ground motion
GMPEs are components of the analysis since they support the calculation of ground motion at every point of the model. Many GMPEs exist in the literature, and new ones are released regularly [Douglas and Edwards 2016]. Nevertheless, these equations are generally valid for a limited regional domain, a limited magnitude range, or are relevant only at large scale. Bertil et al. [2019] made a review of existing laws and proposed seven GMPEs that are compatible with seismological data about the regional seismicity of Mayotte (both historical and instrumental) in a perspective of Probabilistic Seismic Hazard Assessments, or for the establishment of shake-maps [Bertil and Hoste-Colomer 2020]. On the other hand, three accelerometric stations were operating when the main shock occurred in Mayotte in 2018 (YTMZ, MILA, PMZY on the map Figure 1). Consequently, measured accelerations are available for this earthquake. The PGA obtained from stations helped to select best fitting models. Considering all the records available, including events that occurred before the ongoing sequence, Bertil and Hoste-Colomer [2020] concludes that the equation proposed by Atkinson and Boore [2006] fits best with data, on the range of magnitude Mw = 3.0 to Mw = 5.0. It slightly underestimates PGA for earthquakes of magnitude 6 or stronger, but still gives better prediction than the other equations. USGS’ ShakeMap 4.0 tool [Worden et al. 2020] is used to establish the shake-maps in acceleration for the two events (Figures 4a and 5a), selecting the GMPE from Atkinson and Boore [2006], and introducing the Vs30 values of Figure 3 for local amplifications. The PGA values for the 2018 earthquake coming from measures at the two local seismological stations that are on a rocky-type soil, YTMZ and PMZY, provide control points to correct the shake map (Figure 5b). The software calculates a general correction factor for results coming from the model (GMPE). A slight underestimation of PGA by the model can be noticed, consistent with Bertil’s conclusion stating that the selected GMPE underestimates accelerations for earthquakes of magnitudes around 6. The PGA calculated by the model differs only slightly from measured values (less than 5%, a PGA of 5.3% g is measured on the YTMZ station, located on a rock-like soil, whereas the estimated intensity is V).
A complementary set of shake-maps expressed in MI is produced using the GMICE from Caprio et al. [2015]. The historical database SISFRANCE (www.SisFrance.net), hosted in BRGM and extended to French overseas territories, contains information about the 1993 earthquake. It provides IM for each municipality, determined from post-seismic field survey reports and other documentation. The shake-maps in intensity (Figure 4b) were updated by these observations. To do it, the software calculates back the PGA corresponding to the observed IM values from the model (GMICE, GMPE and amplification factors for site effects), and then calculates a correction factor. There is a difference of about 1 point between intensities calculated by the model and IM; the correction on PGA values reaches 30%.
Shake-maps in MI of the 1993 EQ (a) calculated from GMPE and GMICE, (b) corrected with field intensity values (SISFRANCE).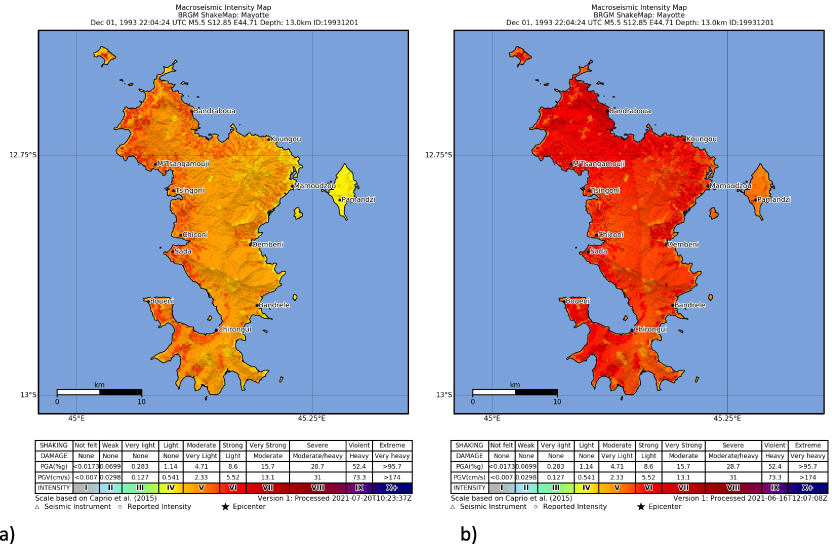
Shake-maps in MI of the 2018 EQ (a) calculated from GMPE and GMICE, (b) corrected with instrumental PGA values.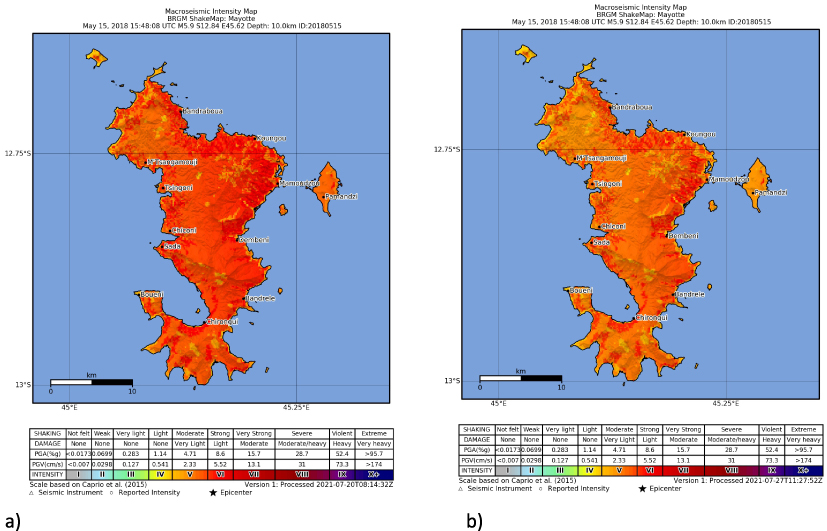
Comparison between shake-maps shows that:
- The geological site effect zoning used in this study results in strong local amplifications of MI (and in particular of IM), especially for soil of type C, that is rather common in urbanized areas,
- PGA values predicted by the GMPE from Atkinson and Boore [2006] fit well the acceleration recorded during the earthquake of May 15, 2018 (i.e. good agreement between Figures 5a and b),
- Concerning the earthquake of December 1, 1993, whereas the shake-map calculated directly from the GMPE (i.e. without any calibration with instrumental or macro seismic observations) seems consistent with the distance to the epicentre (i.e. overall attenuation of intensity of the ground motion with the distance, from west to east), it significantly underestimates MI values compared to the ones established following post-seismic observations. This results in a large discrepancy between Figures 4a and b, with stronger yet smoother values in Figure 4b.
3.3. Buildings’ response and vulnerability
The study considers only the residential building stock. According to official statistics, it counts about 64,500 units for an official population of 257,000 inhabitants in 2017. The political, demographic and economic changes that the island faced in the last decades led to a drastic evolution of the construction landscape, especially for the residential stock. Individual houses made of masonry, poor construction types made of steel sheets and light structures rapidly replaced traditional construction. Collective residential buildings are still quite rare.
The description of the characteristics of a building type, together with its spatial distribution, is necessary to produce damage maps. Then, the Risk-UE method associates a vulnerability index to each building type, depending on its structural features and additional vulnerability factors. Several technical reports provide detailed information about construction techniques and physical characteristics of local material. Site investigations helped also to examine more precisely construction features and building type repartition. Finally, four types of building cover the vulnerability information for the analysis. For each type of building, the application of the Risk-UE methods gives a range of the vulnerability index, taking into account the average characteristics of the real buildings (Table 2). Factors like the number of floors, irregularities, and effect of aggregate buildings can amplify the vulnerability. In this study, the vulnerability index is calculated considering the mean value of the Risk-UE method and additional vulnerability factors that are representative of the buildings observed during the field survey. Then the field work helped in assessing the distribution of building types in each district. Despite it being convenient to represent large stocks of buildings, this method has some limitations: local variations of the vulnerability due to additional site factors (slope for example), and induced effects of earthquake (liquefaction, landslides) are not taken into account.
Building types, distribution and associated vulnerability indexes
| Photo | Type and description | Vulnerability index Vi | % of total number of buildings (number) | |
|---|---|---|---|---|
| In 1993 | In 2018 | |||
 |
Type 1: Poor living units made of steel sheets, wood or mud bricks [no corresponding type, to be compared to the method most vulnerable type M1.1 Fieldstone] | 0.85 [0.87] | 2% (400) | 27% (17,000) |
 |
Type 2: Traditional one-story houses, brick masonry houses without steel reinforcement [M3.1 Masonry] | 0.74 [0.74] | 73% (14,000) | 2% (1000) |
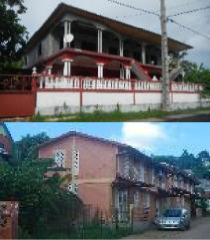 |
Type 3: Masonry houses with steel reinforcement [M3.4 Masonry with reinforced concrete slab] | 0.65 [0.62] | 25% (4800) | 71% (46,000) |
 |
Type 4: Collective residential buildings, reinforced concrete structure or concrete block masonry with steel reinforcement [M4 or RC2] | 0.58 [0.39 to 0.45] | 0% ( ∼10) | 0.2% (150) |
Corresponding Risk-UE Model building classes, and their mean vulnerability index are indicated with brackets.
Results of the simulations for different seismic scenarios
| Scenario | SM | EQ | Level of precision | Mw | Population | Total no. of buildings | ND2+ | ND3+ | %D2+ | %D3+ |
|---|---|---|---|---|---|---|---|---|---|---|
| 93-93-m | Figure 4a | 1993 | Municip. | 5.5 | 94,000 | 19,237 | 149 | 14 | 0% | 0% |
| 93-93-m* | Figure 4b | 94,000 | 19,237 | 327 | 34 | 2% | 0% | |||
| 18-18-m | Figure 5a | 2018 | 5.9 | 257,000 | 64,633 | 1345 | 163 | 2% | 0% | |
| 18-18-d* | Figure 5b | District | 257,000 | 64,633 | 1808 | 248 | 3% | 0% | ||
| Optimized | Figure 5b | 257,000 | 64,633 | 204 | 17 | 0% | 0% |
Scenarios with an asterisk (∗) means that they used shake-maps calibrated on observations. Column SM refers to the shake-map used for ground motion (reference of the figures in this article). Columns with “D2+”/“D3+” correspond to the number (“N”) and percentage (“%”) of buildings reaching or exceeding the damage grades 2 (light structural damage in masonry buildings, cracks in many walls or partitions) and 3 (moderate structural damage in masonry buildings, large cracks and some collapsed walls) respectively, according to the EMS-98 scale.
According to most recent data, poor housing represents one third of the residential stock, masonry individual houses quite exclusively complete the stock in 2018, but were quite rare in 1993 (Figure 6). This type of building is not properly addressed in the Risk-UE methodology. It was decided to affect a high value of the vulnerability index to it, considering the fact that their quality and resistance is very poor. Moreover, for moderated earthquakes, it is possible that the effects of inertia are lower than the action of wind, which such constructions regularly face. This means that they could withstand moderate earthquake shaking but they are probably very vulnerable to larger shakings or induced effect like slope destabilization. Given the number of such housing in the building stock in 2018, results in terms of damaged building should be considered with caution.
The next step consists in mapping the distribution of each building type in the different urbanized areas of the Island. Two levels of description of the building stock are used. The first level is the municipality (Mayotte has 17 municipalities), using the statistics released by the French National Institutes for Statistics [INSEE 2018], which are available from the 1980s, and comparing them to the data issued in the 2018 field survey [Sira et al. 2018]. A more detailed level considers districts that result from the subdivision of the administrative perimeter of the municipalities and present a homogeneous repartition of the different types of buildings. Crossing this geographically small district and detailed soil map provides better assessment of the damages.
Distribution of the types of buildings for nine cities in Mayotte, (a) in 1993, estimated from INSEE census data, and (b) in 2018, from data from Sira et al. [2018] and the local office for environment and construction. A map of Mayotte is given on Figure 7.
Map of Mayotte.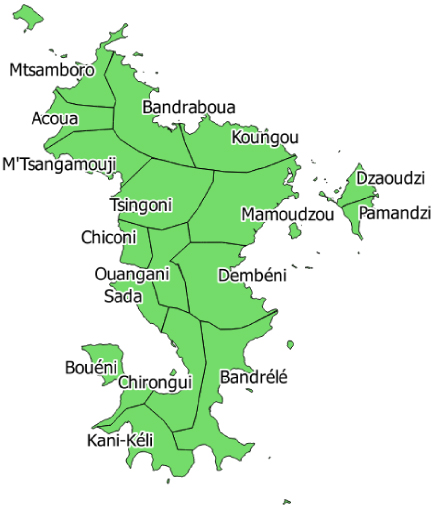
For the analysis at the district level, ESRI World Atlas images (small and medium scale TerraColor imagery mainly provided by Digital Globe and GeoEye) at 1:10.000 scale were interpreted, with sporadic and random verification by more recent high resolution imagery (mainly provided by Airbus through Google Maps) at working scale of 1:5.000. An aggregation of building types at the municipality scale, were each municipality territory forms a polygon with a specific distribution of building types provides results that can be compared with the previous approach. It shows significant discrepancies in the distribution of building types for some municipalities, even if at the scale of the entire island the distribution rate is the same. This is because aerial images do not capture all the characteristics needed to determine the vulnerability of buildings.
Using population census data from INSEE [2018] for past years, and the evolution of buildings’ characteristics, the buildings’ distribution has been assessed, at the municipality scale for the year 1993. Available data are not detailed enough to do this assessment at the scale of districts. Comparison of damage results using both scales of building distribution for the 2018 scenario confirmed that the aggregation of building’s distribution at the municipality level, even if less precise locally, keep providing satisfying results for total number of damaged buildings in the island.
4. Damage scenarios for past events
Table 3 shows the simulation results, figuring the number of damaged buildings in the two main scenarios: The 15 May 2018 earthquake and the 1 December 1993 earthquake, considering today’s population and urbanization, and assessing the urbanization in 1993. It is expressed as the number of buildings and the percentage of the total buildings stock of constructions, damaged at different grade, according to EMS-98 scale [Grunthal 1998]. A complementary scenario, called “optimized” scenario calculates back the vulnerability index for type 3 houses that best fits the post-earthquake data for the 2018 earthquake.
For all the simulated cases, the number of severely damage buildings (level D4 or D5) is close to zero, and does not reach the level of statistical significance.
The “optimized” scenario neutralizes the vulnerability of type 1 houses and effects a vulnerability index of Vi∗ = 0.52 to type 3 houses. It uses the calibrated shake-map, considering it provides the most precise information about the ground motion.
The dataset was prepared for future simulations and stored in the VIGIRISKS platform. It is available for running new simulations aimed to provide seismic damage assessment for any specific uses (preparation of emergency strategy, illustration of prevention recommendations, risk awareness), or rapid loss estimation following a major event.
4.1. From off-line damage scenario to real-time rapid loss assessment
In case of a major earthquake, the authorities need to draw up as quickly as possible a “rough picture” of the situation, in order to adequately assess the operational response (organization of assistance to the victims, delimiting sectors of search and rescue operations, etc.) and anticipate requests for reinforcement as well as longer-term actions.
In the first phases of disaster relief and crisis management, to get reliable trends quickly about the extent of the crisis is more important than precise estimates, which would require time-consuming feedback from the field. Experience demonstrates that after a destructive earthquake, it often takes many hours, even days, to obtain a realistic picture of the overall number of the human and material losses. Based on numerous feedbacks from earthquakes that occurred in Japan, Tang et al. [2019] have established empirical models describing the average temporal progression of the rate of knowledge concerning the number of deceased victims, according to the size of the earthquake. According to these models, it takes 24 h to confirm information on death toll for an earthquake causing less than 100 casualties, and up to five days for earthquakes with between 100 to 1000 deceased victims.
In this context, the local authorities and the French civil protection asked the BRGM to set up a tool for rapid and automatic assessment of the extent of losses caused by earthquakes in the territory of Mayotte (SEISAID-Mayotte system). Inspired by PAGER automatic reports produced by the US Geological Survey [Earleet al. 2009], this system is designed to quickly estimate human and material losses, and to deliver reports tailored for actors involved in crisis management, 30 min after a detected event. Reports deal with two parameters relevant to crisis management: the number of partially or totally collapsed buildings (damage levels D4 and D5) and the number of injured people. These indicators support decision-making for setting priorities for search activities and allocation of rescue resources. The SEISAID tool uses the VIGIRISKS platform’s damage assessment modules to automatically produce reports in case of earthquakes of magnitude 4 or greater. Figure 8 shows two example bulletins, corresponding to 1993 and 2018 earthquake scenarios that were detailed in the preceding sections.
SEISAID reports corresponding to 1993 and 2018 EQ (scenario mode).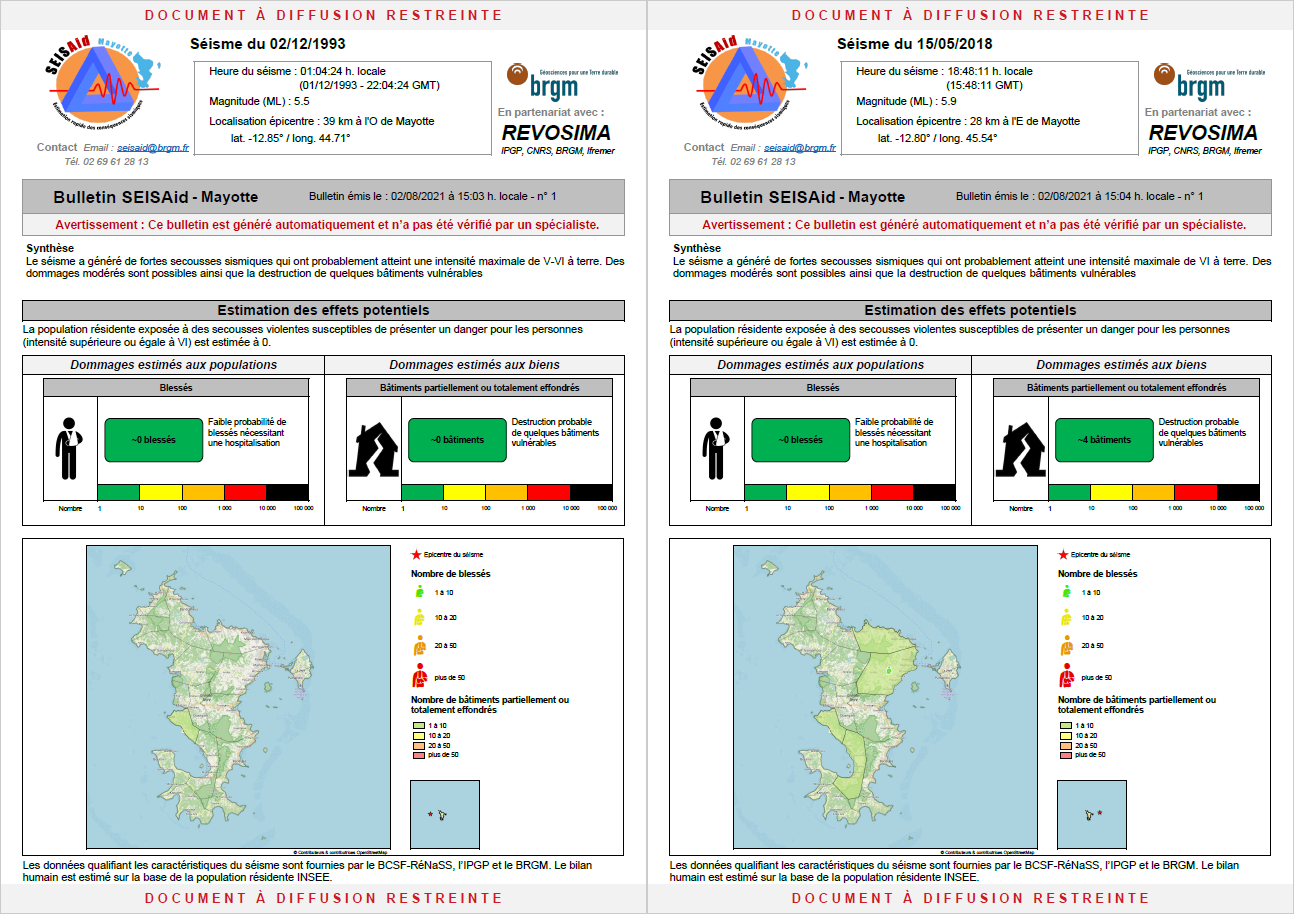
5. Discussion
The opportunity to compare simulation results with field data from post-seismic surveys is a chance (Table 4). Following the 1993 and 2018 earthquakes, field surveys produced key information for a benchmark of simulation tools. Reports about the 1993 earthquake compile field data and inhabitants’ damage declarations in technical documents in order to justify the allocation of repair funds. They contain valuable details about the observed damage and the vulnerability of constructions. The reliability of figures about damaged buildings is nevertheless questionable, since there was no systematic checking of the information at that time and the mechanism of damage declaration for insurance purpose frequently produces some biases. Authors themselves point to this limit.
Comparison of simulation and field data
| Earthquake | Simulation | Observation | |||
|---|---|---|---|---|---|
| D2+ | D3+ | Claims | D2+ | D3+ | |
| 2018 | 1345–1808 | 163–248 | 1000 | 200 | <10 |
| 1993 | 149–327 | 14–34 | 1210 (113 rebuilt) | ||
Columns with “D2+”/“D3+” correspond to the number of buildings reaching or exceeding the damage grades 2 (light structural damage in masonry buildings, cracks in many walls or partitions) and 3 (moderate structural damage in masonry buildings, large cracks and some collapsed walls) respectively, according to the EMS-98 scale. Claims refer to claims for repair.
Regarding simulation results of the 1993 earthquake, the representativeness of input data is difficult to crosscheck. Recent changes in Mayotte drastically affected the disposition of population and urbanization, making it difficult to represent precisely the real exposition to seismic risk in the past. Strong hypotheses and estimations were necessary concerning the number, type and vulnerability of buildings as well as the localization and real extension of urbanized area. The order of magnitude seems nevertheless consistent with observations. Post-event field surveys conducted estimate a total of 113 houses having been rebuilt and 1210 houses needing repair [Europact 1995]. Deeper analysis of the report shows that repair claims concerned also houses with rather small damages (some maybe only corresponding to level D1). So, the total amount of claim cannot directly be compared to the number of buildings reaching D1 or D2 level in the simulation, but probably something in between. Scenario 93-93-m, based on the non-calibrated shake-map (Figure 4a), and scenario 93-93-m*, taking into account the observations-calibrated shake-map, predict 14 to 34 building with significant damage, which is rather consistent with the number of housing rebuilt. A more precise look at the number of damaged buildings per municipality did not show good agreement, tending to support the thinking that at least locally, damages could be overestimated in repair claims. Other factors can also contribute to the discrepancies, linked to the macroseismicity values themselves. At that time, intensities were scaled according to the MSK scale, that differs slightly from the EMS98 one used for simulations. When considering the basis for intensity assessment, SisFrance does not refer to the above quoted detailed reports but on news reports, that seems to be much less detailed, and were not checked with direct field observations. Cumulated uncertainties in simulations as well as limits of data used for shakemaps should lead to high caution on interpreting the results of comparisons between these approaches.
The comparison of the scenarios obtained for the 2018 earthquake (18-18-d, 18-18-d* and “optimized”) with field observations coming from Sira et al. [2018] also shows some discrepancies. Since the type of buildings are not identical, it is not easy to compare intensity results, but the number of damaged buildings are of relevance. Field observations report 1000 claims for repairs, for damage corresponding mainly to levels D1 to D2. However, it appears that many of damaged building suffer pre-existing damage. The total number of buildings damaged to level D2 is roughly estimated to be around 200, and less than ten to level D3. These values are much lower than those estimated by the simulations, which estimate between 1300 and 1800 buildings to be impacted at damage level D2 and more. One factor accounting for these differences is the behaviour of type 1 buildings. The report shows no evidence of poor housing being extensively damaged, whereas this type of building represents the majority of damaged buildings in simulation, due to the value of the vulnerability index that has been selected. On the contrary, when type 1 buildings are neutralized (artificially setting a very low vulnerability index to them), the total number of damaged buildings is much closer to the observations. In addition, when slightly modifying the vulnerability index of type 3 buildings from 0.58 to 0.52, results show very good agreement with observations (see “optimized scenario”, Table 3). This value is still compatible with the Risk-UE methodology, and the range of variation acceptable for the vulnerability index. It seems that the vulnerability of type 3 buildings is a bit lower than when taking into account all the factors of vulnerability cumulatively.
The May 15, 2018 earthquake is part of a long sequence of shakings. The state of damage observed probably results from the cumulative effects of repeated ground motion. Consequently, one could expect that the damage state observed is greater than the damage state due to a single earthquake, as simulated. Nevertheless, there is no direct evidence that smaller earthquakes that occurred before the May 15 one did affect the vulnerability of the buildings. No significant damage has been reported in the first stage of the swarm, even if a dozen of earthquakes have been felt. It is worth mentioning that the magnitude scale is logarithmic and that the level of acceleration produced by most earthquakes during the sequence did not reach a level that produced structural impact. The impact of repeated low-level ground shaking deserve more investigations, but from the data available, it seems that the cumulative effect can be neglected when comparing the results of simulations with field observations.
Even if the observations of damages produced by a relatively moderate earthquake tends to support a rather good behaviour of the building stock, non-linearity could affect the results for stronger events, especially if the shaking triggers landslides or other induced phenomena. Consequently, the reference dataset keeps recommended values of the vulnerability index, since it use by tools dedicated to crisis management accommodates better overestimation than underestimation of damages. Recommended values benefit from larger support from field observations on a broader range of magnitude considered in the Risk-UE project, even if they are less specific to the territory. There is still a need to find an appropriate way to handle the behaviour of poor housing (type 1 buildings), which represent locally a significant part of the building stock.
It is then important to note that the method used for rapid damage modeling intrinsically bears high reliability limits. Unlike damage scenario calculations, for which the user sets the seismic parameters with precision, rapid loss assessment tools are supposed to use the data available immediately after an earthquake, which is often tainted with high uncertainty. This is especially the case for rather moderate earthquakes in regions covered by a loose monitoring network, like in the Comoros region. The parameters of the earthquake (location, depth of the epicenter, and magnitude) can evolve with time, when more data become progressively available for computation. In addition to the uncertainty inherent in the methodology itself, there are several important sources of uncertainty related to the data used, including:
- Uncertainty factors related to the rapid intensity assessment:
- Epicenter parameters (location, magnitude, depth);
- Empirical models for taking into account lithological site effects and topographical site effects (not done here);
- Empirical equations used for accounting for attenuation (GMPEs) and conversion between PGA and MI (GMICEs);
- Source and directivity effects of seismic wave propagation not taken into account.
- Uncertainty factors related to the characterization of the assets at risk and their vulnerability:
- Application of building vulnerability indices deduced at the scale of urban areas and not of individual buildings, based on an interpretation from statistical data;
- Modeling of human losses on the basis of statistical damage/victimology correlations;
- Exposed population considered as static, by ventilation in buildings of the resident population as described in the population census data.
Despite these limits, the comparison of simulations and real events proved its statistical robustness. It is therefore well suited for identifying trends a few minutes after the event, in the initial phase of the rescue, since very few reliable observations are available. However, it does not intent to provide indicators with high resolution (spatially or numerically). Calibration of shake-maps with measured values for ground acceleration is also a promising way to reduce uncertainty affecting the earthquake parameters.
6. Conclusions and perspectives
The study produced a reliable set of data for damage assessment and loss simulations that fits closely Mayotte’s geographical and physical characteristics. Its implementation into the VIGIRISKS platform and its exploitation by the rapid loss estimation tool SEISAID opens perspectives for operational support to decision making regarding prevention, preparedness and crisis management.
The approach of the study, deeply rooted in the Risk-UE methodology, is robust and consistent with other damage assessment made in mainland France and overseas territories. By construction, its use is strictly limited to statistical analysis on rather large-scale territories. Results at the scale of the entire island or at the municipality level are the most relevant. Nevertheless, uncertainties about the extension of urbanized area and the assessment of site-effects, the definition of vulnerability typology and associated indexes, as well as parameters used to calculate the ground motion affects the results in terms of damage. It is recommended to run different simulations to capture variations and obtain a range of probable results, and prefer order of magnitudes of numerical values to support the decision.
The reference case, calibrated on the ongoing swarm’s main shock (15 May 2018), confirms that damaging earthquakes can occur, and that a total number of several hundreds of damaged buildings should be anticipated even for a rather moderate earthquake (M < 6). Simulation of the 1993 event and field surveys provide additional evidences of the general vulnerability of Mayotte residential stock. This means that reducing seismic risks implies working hard on building better and reducing vulnerability.
More generally, taking into account the seismic risk of this region, the wider dissemination and adoption of good construction practices, along with the improvement in the quality of masonry building appear to be encouraging trends for leveraging a more disaster-safe and resilient territory.
Conflicts of interest
Authors have no conflict of interest to declare.
Acknowledgments
This work was supported by the Ministry for the Ecological Transition’s General Directorate for Risk Prevention.
Seismic data from Mayotte’s stations are shared within REVOSIMA, Mayottes’ seismic and volcanic monitoring network.
Glossary
BCSF-RENASS (Bureau central de sismologie français – Réseau National de surveillance sismique) : entity in charge of the seismic monitoring network part of the national seismic monitoring facility.
BRGM (Bureau de recherche géologiques et minières) : French geological survey
DEAL (Direction de l’environement et de l’aménagement) : local entity représentions the Ministry of Environment for the enforcement of the prevention policies.
DGPR (Direction générale de la prévention des risques) : Department of the French Ministry of environement in charge of the natural risks prevention policy.
DGSCGC (Direction générale de la sécurité ciile et de la gestion de crise) : Department of the French Ministy of Interiors in charge of the civil protection and crisis management.
GIM (Groupe d’intervention macrosismique) : scientific initiative that gathers researchers from different institutions in order to assess the macroseismic intensity of earthquakes occurring in France.
INSEE (Institut National des statistiques et des études économiques) : French national institute for Statistics and Economic studies, in charge of the census.
REVOSIMA (Réseau de surveillance volcanique et sismologique de Mayotte) : Scientific consortium operating the monitoring network and the marine campaigns in Mayotte. IPGP and BRGM operate REVOSIMA with Observatoire volcanologique du Piton de la Fournaise, IFREMER and CNRS. REVOSIMA is supported by a scientific consortium including IPGS, RENASS-BCSF, IRD, IGN, ENS, Université de Paris, Université de la Réunion, Université Clermont Auvergne, LMV et OPGC, Université de Strasbourg, Université Grenoble Alpes, ISTerre, Université de La Rochelle, Université Paul Sabatier, Toulouse, GET-OMP, GéoAzur, CNES, Météo France, SHOM, and TAAF. Observation data are produced by the consortium and financed by the French government.