


 CC-BY 4.0
1. Introduction
After the seismic sequence, initiated in May 2018, and characterized by hundreds of felt earthquakes and consecutive building damages [Sira et al. 2018], the evaluation of the seismic hazard in the whole of Mayotte territory became an imperative need for both crisis management and risk mitigation.
Mayotte is a cluster of volcanic islands on the southern part of the Somalia basin between Africa and Madagascar. It is part of the Comoros archipelago and comprises two main islands: Grande Terre on the west and Petite Terre on the east. Since 2011, the Mayotte territory must comply with the French Building Code regulations, which classifies it as a moderate seismicity level area (decrees 2010-1254 and 2010-1255). In May 2018, an exceptional telluric activity started ∼50 km east of Mayotte, and remains active after more than two years, with 29 events of magnitude greater than 5, the highest magnitude reaching Mw 5.9 [Cesca et al. 2020, Lemoine et al. 2020, Bertil et al. 2021, Feuillet et al. 2021]. Until June 2018, only three accelerometric stations were operating on the island and could record the earthquakes: the two RESIF-RAP stations YTMZ and MDZA [RESIF 1995] and the BRGM station MILA. During the main shock of May 15, 2018, the peak ground acceleration (PGA) reached 180 mg at the MILA station, located at Iloni on the eastern coast of Mayotte, near the top of a hill with outcropping clayey weathered formations, whereas the PGA recorded at the YTMZ station, situated on a rock site, at the same epicentral distance, was about 50 mg. These observations remind us that local geology plays an important role in modifying the characteristics of strong ground motion, both in terms of amplification and duration of seismic waves. The particularity of the superficial geological formations of Mayotte lies in their ancient volcanic origin [Nehlig et al. 2013] and the tropical conditions, which induces strong weathering of outcropping formations. The presence of those particular formations is a complex subject, which is still difficult to take into account, especially in a tropical volcanic context. While many papers show examples of weathering profile imaging [for example Anbazhagan and Sitharam 2009 in India; Wang et al. 2019, Keifer et al. 2019 in Wyoming, United States] with some of them being applied in geological contexts similar to Mayotte [Von Voigtlander et al. 2018, Nelson and McBride 2019, in Hawaï], a few of them intended to address site effects. Nevertheless, there are some precedents such as Davis [1995] who modelled the effect of the presence of a weathered layer on the seismic response of a site or Spudich et al. [1996] and Graizer [2009] who studied the directional amplification effects related to topography and the amplification effects related to the soft surface layer (weathered shale) at the Tarzana site in California. Narayan and Kumar [2015] and Kumar et al. [2017] also worked on the effects of weathering on seismic motion on a hillside via 2D modelling. In a similar manner, Wang et al. [2018] performed 3D modelling of lithological and topographic effects under weathering conditions in Hong Kong. Some authors also treated site effects in weathered areas for the estimation of induced ground motion, as is the case of Havenith et al. [2002] on the Ananevo site in Kyrgyzstan on weathered granite or of Ma et al. [2019] in Tokushima, Japan. In both cases, the authors used H/V ratios to analyze the directivity of the seismic response according to geomorphological criteria. Di Naccio et al. [2017] analyzed the amplification effects related to the shape of the topography and the presence of fractures on the surface via, in particular, the polarization analysis of H/V signals. This work on the San Gregorio site in Italy, located on fractured rock and which suffered significant damage during the L’Aquila earthquake, shows the importance of weathering in the directionality of seismic motion. All these works show the importance of weathering in seismic strong motions, both in terms of amplification, modification of the spectral content and directivity of the seismic energy. Since the 2000s, site effects have been studied on the island of Mayotte through specific site studies prior to the construction of public buildings [mainly scholarly buildings, e.g., Rey et al. 2012, Roullé et al. 2019]. Informative maps, including lithological and topographical site effect maps, were also produced in 2004 for the atlas of natural hazards on behalf of the local authorities [Audru et al. 2010]. Those maps were based on a “solid geology” low-resolution version of the geological map [Stieltjes 1988] and are now regarded as obsolete in terms of description and mapping of superficial formations. Despite this limitation, they have shown high susceptibility to site effects of the volcanic formations of Mayotte. The seismic sequence initiated in 2018 led us (i) to update the site effects mapping to account for the amplification of strong motion related to the surficial geology in crisis management tools such as shake maps and damage scenarios and (ii) to characterize site effects at the seismological station sites in order to improve the metadata of the stations used for seismic monitoring of the territory.
2. Geological context
Mayotte Island is made up of a succession of volcanic deposits: the oldest goes back to 10 My in the south and the north-west, the most recent, found in Petite Terre, has been proposed to be of Holocene age [Zinke et al. 2013], but these deposits have not been dated. The succession of eruptive phases and quiescence, which allowed weathering and erosion, have shaped the present geology of Mayotte [for detailed information on the geological history of Mayotte, see Stieltjes 1988, Debeuf 2004, Audru et al. 2006, 2010, Nehlig et al. 2013]. The tropical climate of Mayotte is characterized by high rainfall levels, with an average annual rainfall exceeding 1500 mm over the whole island (http://www.meteofrance.yt/climat/description-du-climat, last access 14/12/2021). Coupled with the age of the rocks, this is largely responsible for the strong weathering of Mayotte’s superficial formations.
In 2013, a 1:30,000 geological map of Mayotte [Lacquement et al. 2013, Nehlig et al. 2013], with focus on superficial geology and natural hazards, was produced with an attempt to better characterize weathering levels. A simplified version of this map is given in Figure 1. The main geological units that outcrop on land are basaltic, phonolitic or trachytic lavas (later referred to as lava formations), volcaniclastic deposits and large thicknesses of weathered rocks (later referred to as superficial formations). It distinguishes, among the superficial formations, the anthropic deposits, the autochthonous formations resulting from supergene weathering processes (e.g., alloterites and isalterites) and the allochthonous formations which bring together all the sedimentary deposits from erosion and transport process (e.g., alluvium, beach sands and slope formations as colluvium or screes). A conceptual diagram to explain the typical pattern of the weathering profiles of Mayotte and the relation between the geological formations of Figure 1 is given in Figure 2.
Simplified geology of Mayotte derived from Lacquement et al. [2013].
Conceptual diagram representing the typical weathering profile in Mayotte [modified from Nehlig et al. 2013]. Alloterites thicknesses are generally about few meters, whereas isalterites thicknesses can reach 20–70 m depending on the area.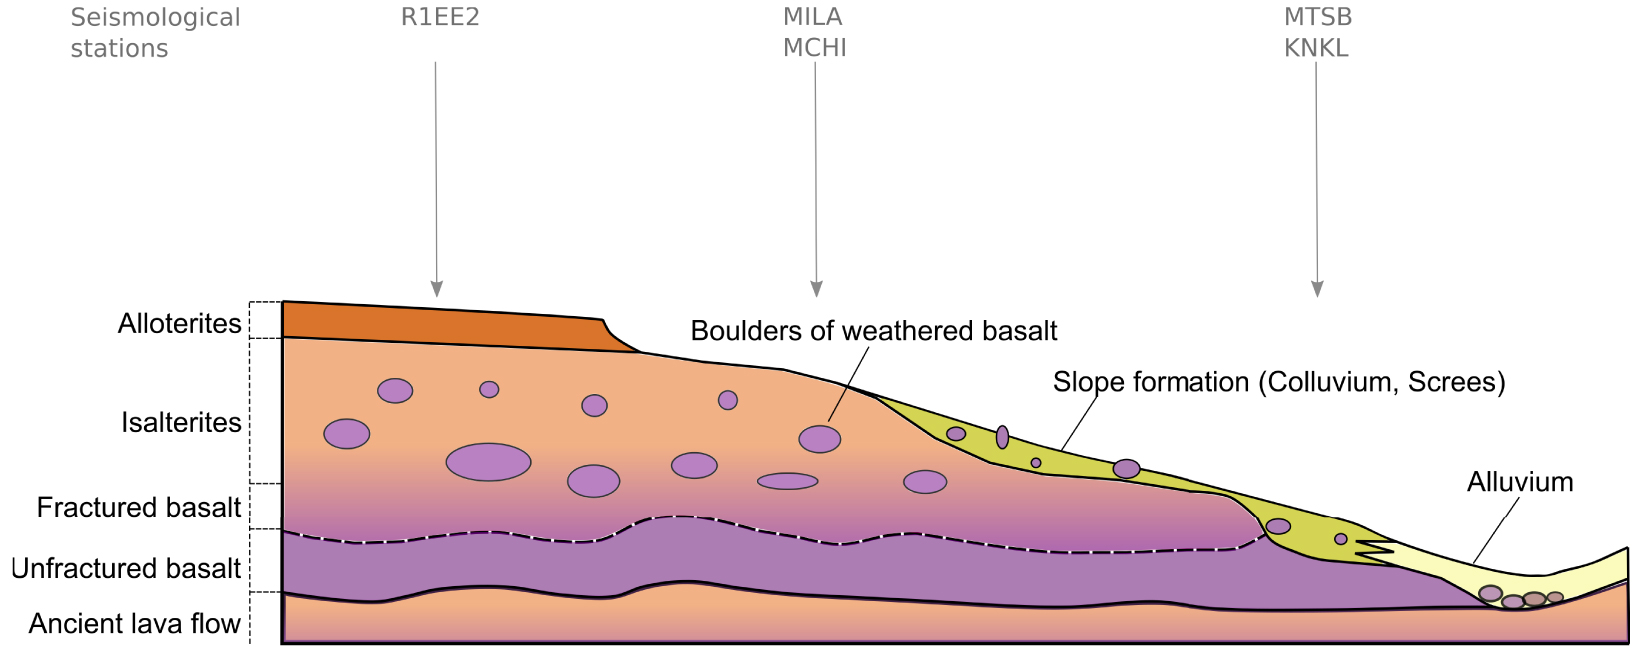
3. Data description
3.1. Earthquake records
The earthquake data used in this paper come from the records of the YTMZ, MCHI, MILA, MTSB, KNKL, PMZI and R1EE2 stations described in Bertil et al. [2021] and Saurel et al. [2022] which provide continuous data in the framework of the Mayotte seismo-volcanic monitoring network (Réseau de surveillance volcanologique et sismologique de Mayotte—REVOSIMA). The geographic location of these stations is shown in Figure 3 and these are described in terms of name, network and type in Table 1. A particular case is the TBAD station, which corresponds to a test site for the future installation of a permanent seismological station on Petite Terre to replace the PMZI temporary station. The analyzed seismic events occurred from 08/03/2018 to 09/02/2020 and include the strongest events of the seismo-volcanic crisis initiated in May 2018 (Figure 4). Their locations are extracted from the work of Lemoine et al. [2020] until May 2019 and Bertil et al. [2021] from June 2019 up to February 2020. All their magnitudes come from Bertil et al. [2021] and correspond to local Mlv magnitudes estimated from the regional localizations, generally stronger than the magnitudes calculated from the global networks. In the catalogue of Bertil et al. [2021], the comparison between the Mw value given by G-CMT [Dziewonski et al. 1981, Ekström et al. 2012] and Mlv (for Mw between 4.9 and 5.9) and between the mb value given by the International Seismological Centre [2016] and Mlv (between mb = 4.0 and 5.9) shows that Mlv overestimates Mw by 0.3 on average and mb by 0.4 on average. From this main dataset, regrouping more than 4900 events, we extracted a subset of 84 events in order to calculate H/V earthquake spectral ratios (i.e., the ratio between the Fourier amplitude spectra of the horizontal and the vertical components of seismic motion, Lermo and Chávez-García [1993]; see Supplementary Table S1). This subset of data includes (i) the 53 highest magnitude earthquakes (Mlv > 5) recorded between 08/03/2018 and 27/06/2018 for stations YTMZ and MILA (the only stations operating during this period) and (ii) 31 additional earthquakes with magnitudes between 2.8 and 5.0 recorded between 25/05/2019 and 08/02/2020 for stations YTMZ, MCHI, MILA, MTSB, KNKL, PMZI and R1EE2.
Location of the H/V noise spectral ratios data (black dot), the MASW profiles (blue dot), and the seismological stations (red dot) used in this paper.
Location of the seismic events used in this paper, from Lemoine et al. [2020] and Bertil et al. [2021]. The full set of earthquakes considered are represented in grey while the black dots indicate the subset of the data of 84 earthquakes used to calculate the H/V earthquake spectral ratios.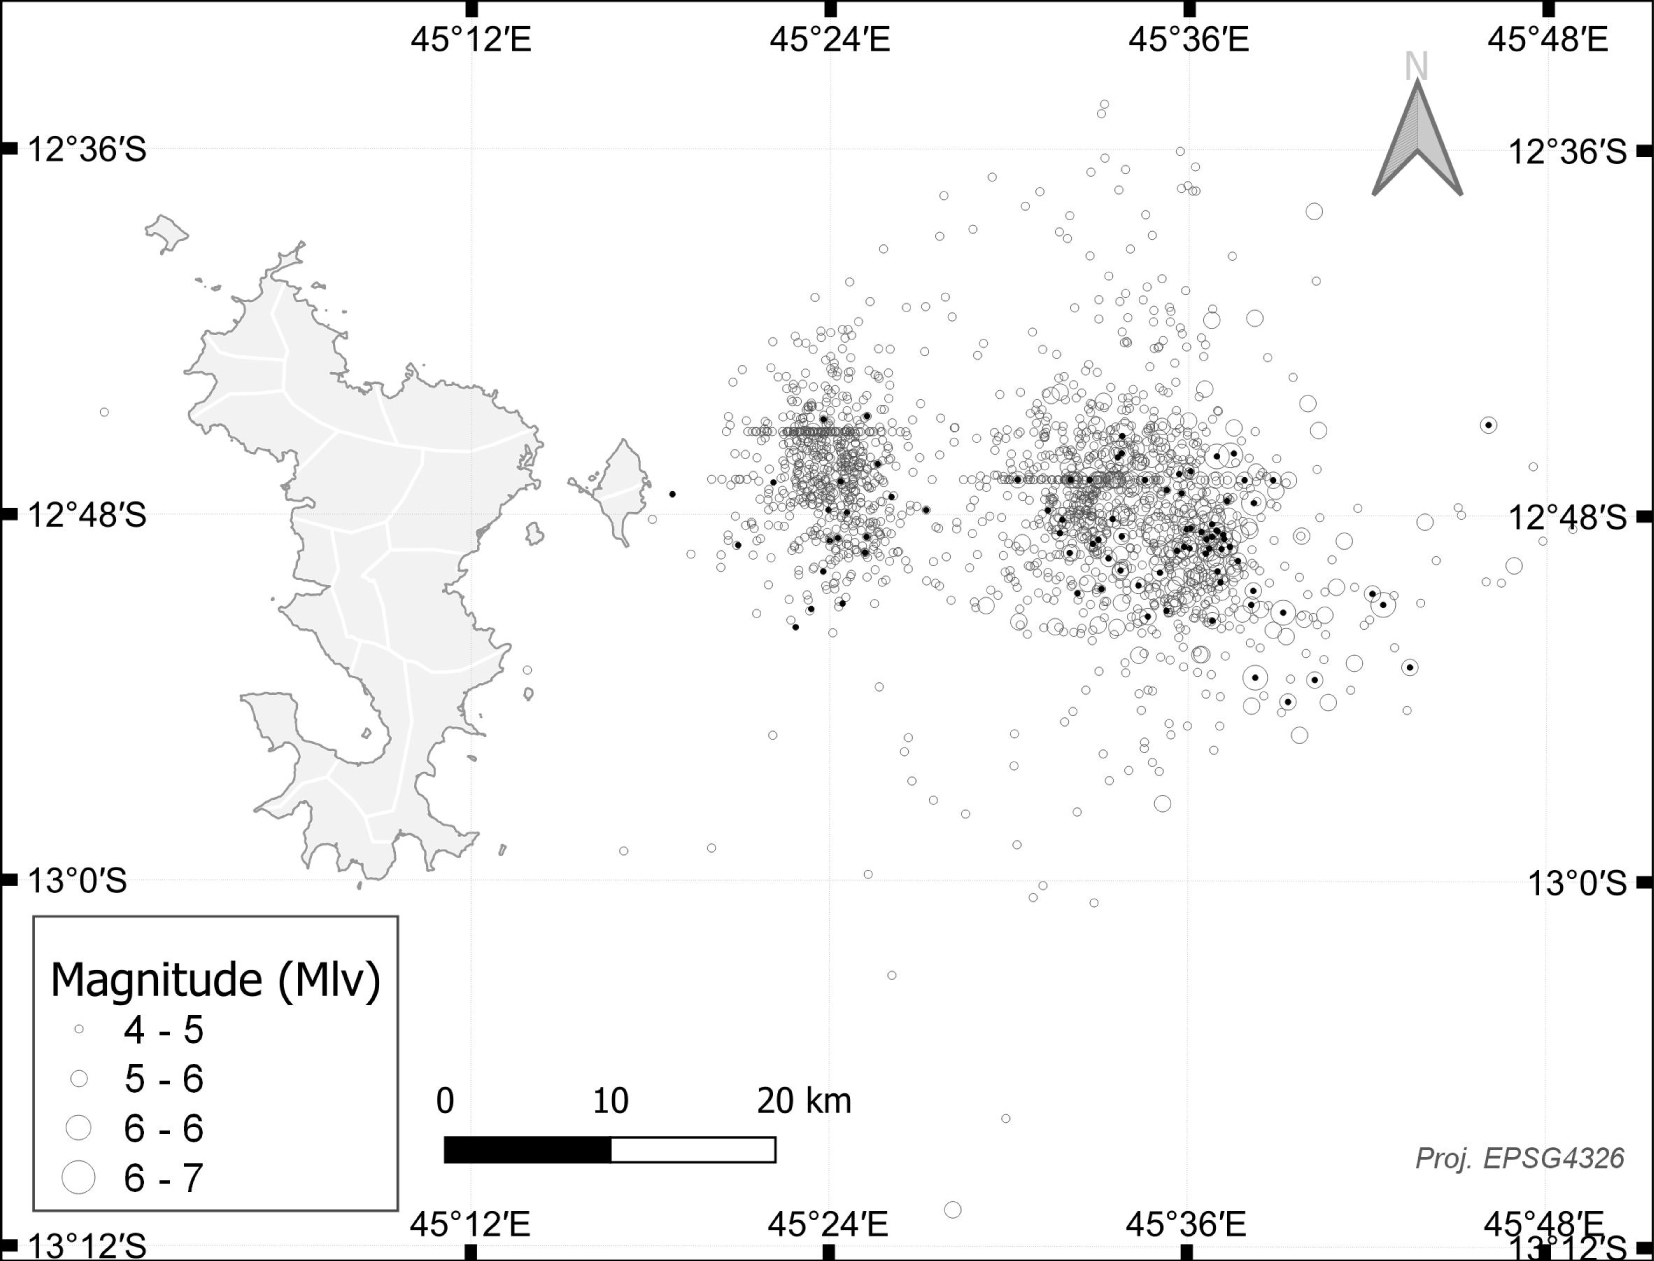
Description of seismic stations
| Stations | YTMZ | MILA | MTSB | MCHI | KNKL | TBAD | PMZI | R1EE2 |
|---|---|---|---|---|---|---|---|---|
| Network | RA | RA | 1T | ED | QM | None | 1T | AM |
| Site name | Mamoudzou | Iloni | M’Tsamboro | Chiconi | Kani-Keli | Badamiers | Pamandzi | Coconi |
| Latitude | −12.7577 | −12.8481 | −12.6804 | −12.8329 | −12.9571 | −12.770231 | −12.7993 | −12.8354 |
| Longitude | 45.2307 | 45.1928 | 45.0847 | 45.1237 | 45.1042 | 45.277658 | 45.2743 | 45.1365 |
| Sensor type | Acc | Acc | BB (HH) | BB (BH) | BB (HH) | BB (HH) | BB (HH) | RaspB |
Station types are: Acc = accelerometer; BB (HH) = broadband 0–100 Hz; BB (BH) = broadband 0–50 Hz; RaspB = Raspberry shakes. Networks references are: AM [Raspberry Shake Community 2016]; ED = http://www.edusismo.org/; RA [RESIF 1995]; 1T [Feuillet et al. 2022] and QM: CNRS-INSU Tellus SISMAYOTTE project.
3.2. H/V noise spectral ratios and MASW profiles
For 20 years, BRGM has been carrying out seismic hazard studies on sites in Mayotte Island. These studies generally include a lithological site effects analysis and have led us to acquire numerous geophysical measurements to characterize (i) the resonance frequency of the sites via the calculation of the H/V noise spectral ratio [i.e., the ratio between the Fourier spectra of the horizontal and the vertical components of the seismic noise recorded at the surface, Nakamura 1989] and (ii) the S-wave velocity profile with depth inferred from the MASW active surface wave method (Multichannel Analysis of Surface Wave). The compilation of all these data allowed us to obtain 557 H/V measurements and 117 MASW profiles distributed over the whole island (Figure 3). An exhaustive list of the public reports from which the H/V and MASW data were collected is given in Supplementary Table S2.
4. Method of analysis
4.1. Peak ground accelerations
The PGA, defined as the highest amplitude of the absolute value of a signal in acceleration between the two horizontal components of the ground motion, is a common parameter to describe strong ground motion for seismic damage evaluation and mitigation purposes. PGAs were extracted directly from the raw signals through the scwfparam module of the Seiscomp monitoring tool [Cauzzi et al. 2013]. This module uses distance and magnitude criteria to select the signals to be processed and the size of the time window. The PGA is calculated on a filtered signal cut at 40 Hz for signals with a signal-to-noise ratio superior to a fixed threshold.
4.2. H/V noise spectral ratios
We calculated the H/V noise spectral ratio following the method proposed by Nakamura [1989] to characterize the site resonance frequency. The method assumes that the spectral ratio between the horizontal and vertical component of seismic noise is a good indicator for site effect evaluation in 1D subsurface conditions. In case of high impedance contrast between soft filling and stiff basement and under the 1D assumption, the H/V peak frequency can be associated to the fundamental resonance frequency of the soft soil [e.g., Field and Jacob 1995, Bonnefoy-Claudet et al. 2006] following the equation:
| (1) |
For characterization of seismological stations, we calculated the H/V noise spectral ratios by extracting 1 h of signal from the continuous data stream of the station during the night (quiet period). The calculations were made following the guidelines from the SESAME project [SESAME 2004] using the Geopsy software [Wathelet et al. 2020]. We used the following parameters for calculations of the H/V spectral ratios: data were filtered with a bandpass filter between 0.1 and 20 Hz, the selected windows are 50 s long, and we applied a 40% Kono–Homachi smoothing on the Fourier spectra.
4.3. H/V earthquake spectral ratios
For seismological stations YTMZ, MCHI, MILA, MTSB and KNKL (see Figure 3 for stations location), the H/V noise spectral ratios were compared with the H/V earthquake spectral ratios from the subset of data comprising the 84 earthquakes listed in Supplementary Table S1. To calculate them, we followed the procedure described by Lermo and Chávez-García [1993], keeping only the S-wave part of our records. This work has been done manually. Selected window lengths vary between 13 s and 136 s, with an average length greater than 50 s for four of the five studied stations (Table 2). Discrepancies between window lengths are due to the available signal for each event at each station. The shortest windows occur when events happened in bursts. The filtering and smoothing parameters are the same as those used for the H/V noise spectral ratio calculation to obtain comparable spectral ratios.
Minimum, maximum and average S-wave window lengths in seconds used for the H/V earthquake spectral ratio calculations
| MCHI | MILA | MTSB | KNKL | YTMZ | |
|---|---|---|---|---|---|
| Minimum | 62.3209 | 44.3768 | 25.6447 | 13.5924 | 26.6476 |
| Maximum | 147.9226 | 136.0315 | 114.9714 | 57.8797 | 87.2135 |
| Average | 101.0179 | 92.7994 | 50.2577 | 35.2106 | 56.2333 |
For stations PMZI and R1EE2, we only calculated the H/V noise spectral ratio, mainly because of data availability problems due to the late installation of these stations. However, we chose to include our results to provide preliminary indications of site effects at these stations.
4.4. Azimuthal variation of H/V noise spectral ratios
We computed the azimuthal variation of H/V curves. The direction of the maximum H/V ratio in the horizontal plane is used as an estimate of the predominant polarization [Di Giulio et al. 2015]. This tool allows to study the directivity of the seismic response as a function of the morphology and geological structure of a site [Theodoulidis et al. 2018], for example as a function of slope [Del Gaudio et al. 2008], rock fracturing [Di Naccio et al. 2017], or more broadly as a function of weathering and the presence of a soft layer on the surface [Havenith et al. 2002, Ma et al. 2019]. In this paper, we only show those analyses indicating a strong directivity effect, i.e., for which the amplitude of the H/V peaks varies with azimuth.
4.5. Damping
We finally used the damping tool available in Geopsy package [Wathelet et al. 2020] to check the natural origin of the resonance frequency [Dunand et al. 2002]. Following Dunand et al. [2002] and the SESAME guidelines [2004], we consider that the damping of a natural origin peak will present very low values ( <1%). The damping test has been done in a systematic way but only the particular case of the temporary station TBAB has been presented in this article.
5. Site effects analysis at seismological station sites
5.1. Peak ground acceleration comparisons
In this paragraph, we compared the PGAs extracted from the earthquake signals listed in the Lemoine et al. [2020] catalog for the MILA, KNKL, MCHI, MTSB, MPZI and R1EE2 stations with those of the YTMZ station, which is considered as the reference station in Mayotte and which recorded the whole seismo-volcanic crisis initiated in 2018 (Figure 5). For each station and each PGA value, a PGA correction was applied to account for the difference in hypocentral distance between the considered station and the YTMZ station. For this, we applied the empirical relationship between PGA, local magnitude and hypocentral distance proposed by Bertil and Hoste-Colomer [2020] for Mayotte:
| (2) |
Comparison of PGAs between the reference station YTMZ and the considered station. Black dots give the value of PGA for each recorded event, the grey line represents the reference line for which PGAYTMZ = PGAstation, the dotted grey line represents the median amplification coefficient line. The median amplification coefficient corresponds to the ratio between PGAstation and PGAYTMZ and is indicated in the legend.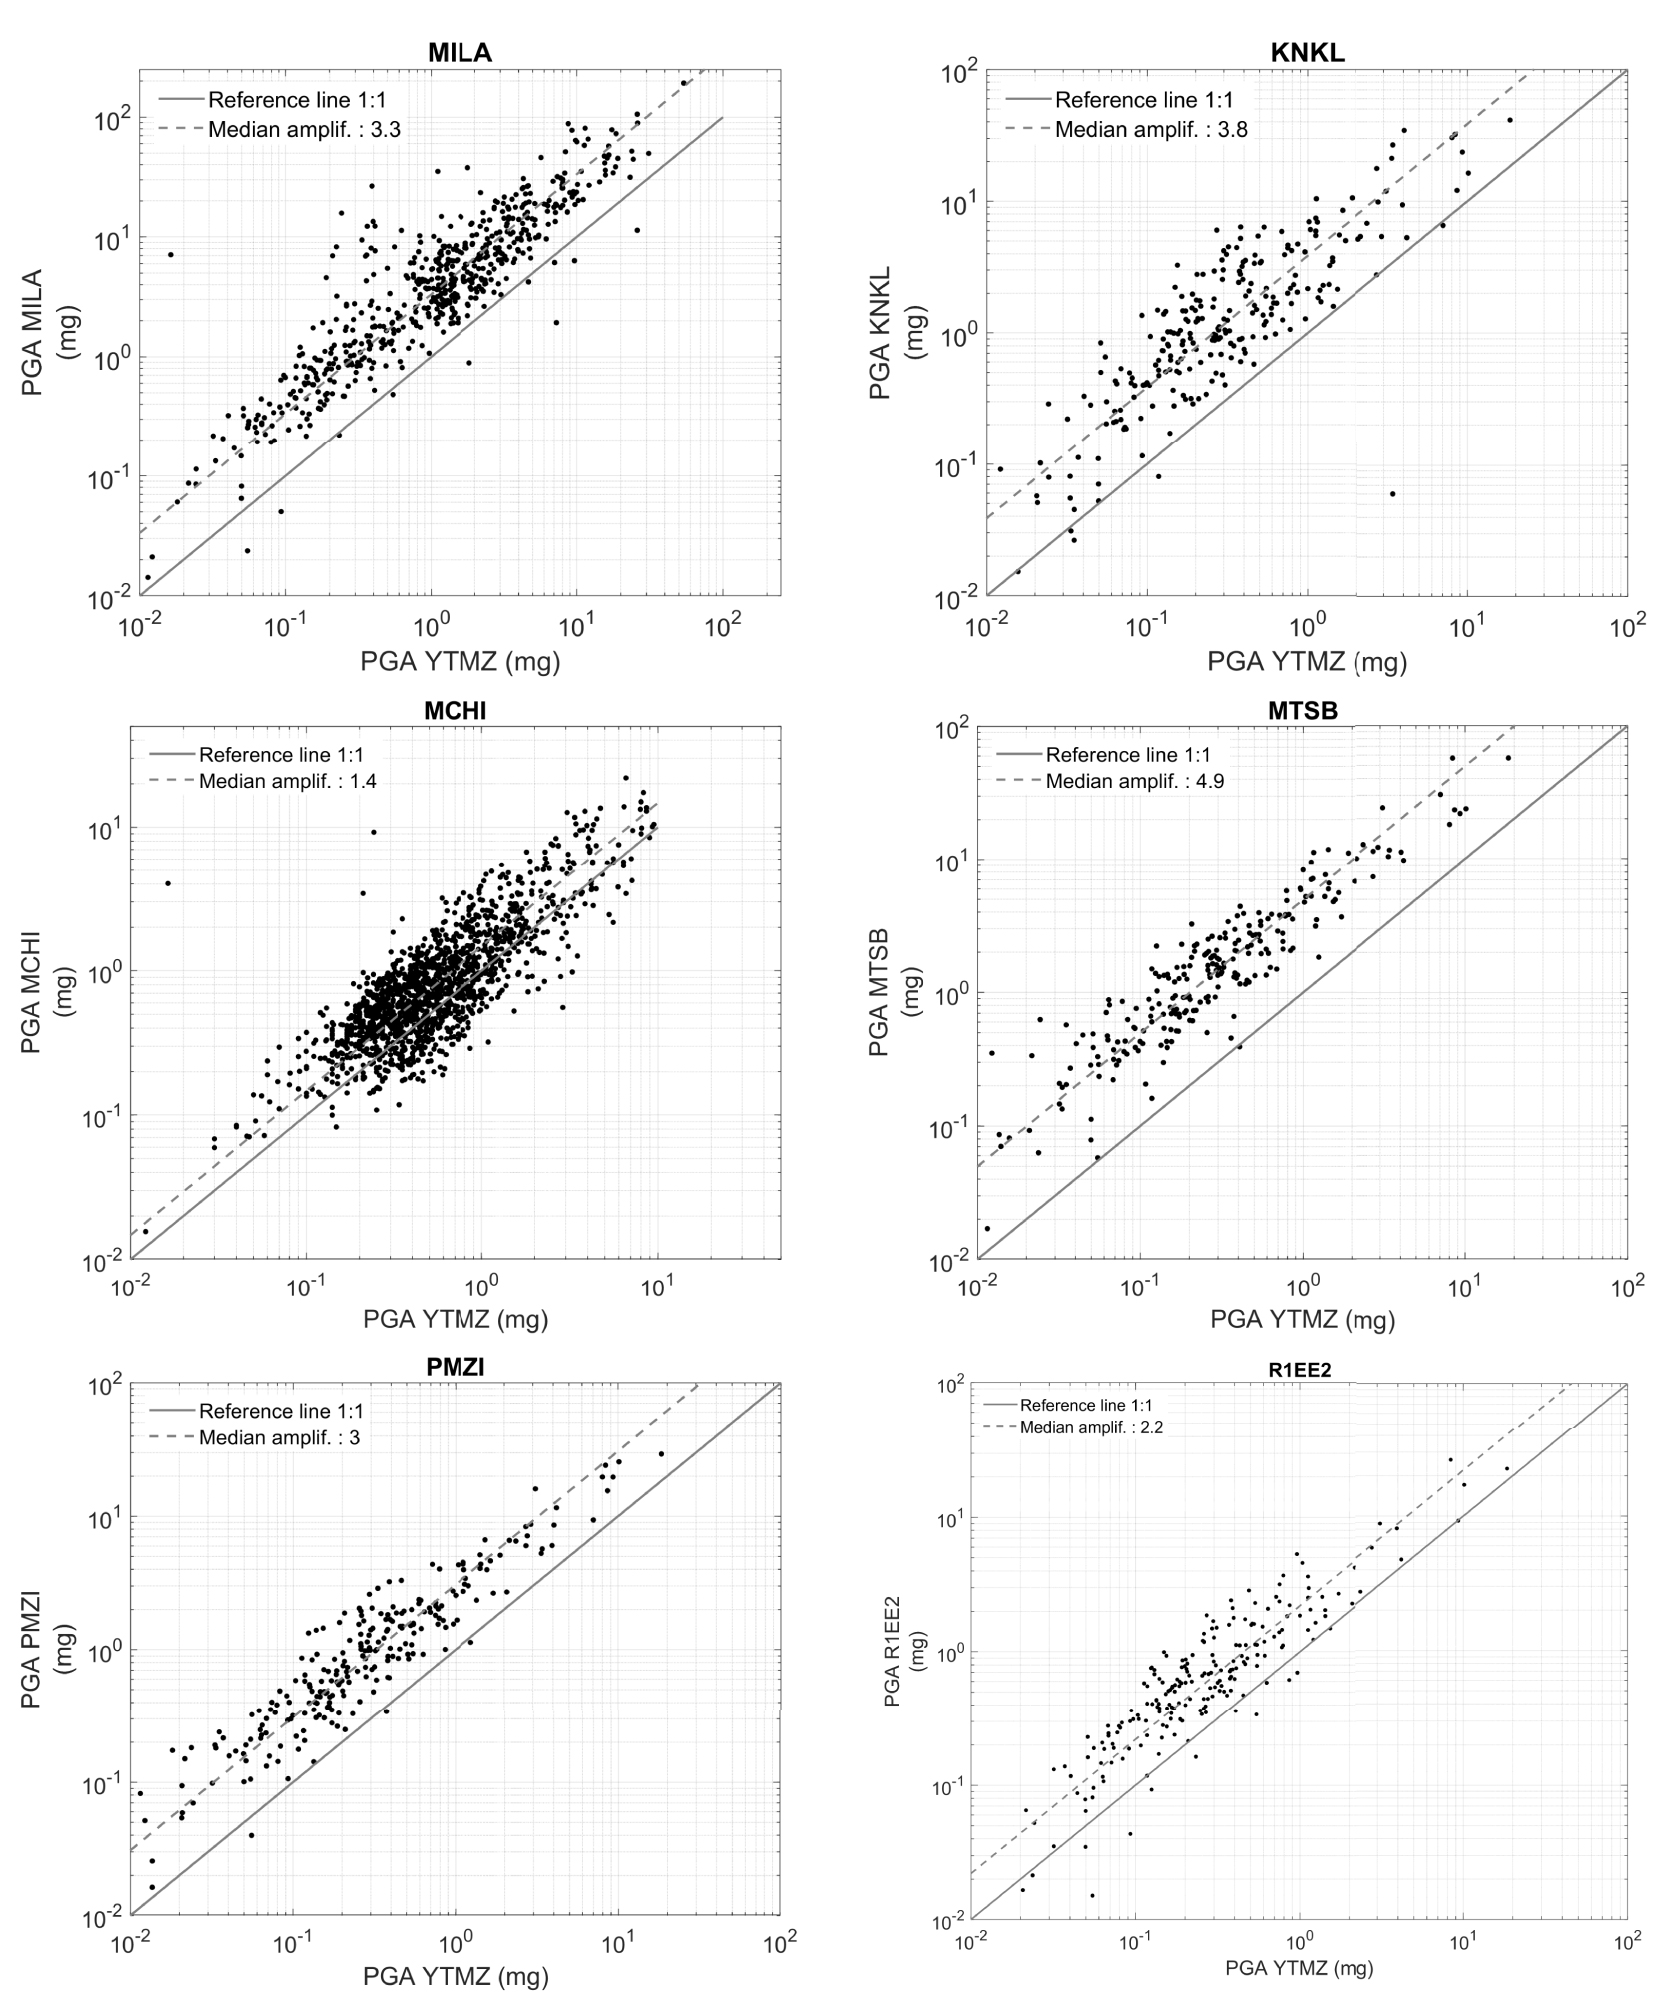
We have a good sampling of PGA values between 0.1 and 10 mg with little data above 10 mg except for the MILA station, which has recorded the strongest ground motions of the crisis. In general, we observe that the PGA values at the stations studied are mostly higher than those observed at the YTMZ station, with median amplification values ranging from 1.4 for MCHI to 4.9 for MTSB. Except for station MCHI, these coefficients are superior to the soil coefficients given by the French building code (between 1.35 for soil class B and 1.8 for soil class E). We also observe a strong variability of PGA ratios between the considered station and YTMZ, with amplifications that can go from a factor of 1 to factors greater than 8 on some earthquakes (e.g., on MILA).
5.2. Earthquake and noise spectral ratios
We then calculated the H/V noise spectral ratios for each station of the study and compared them to the H/V earthquake spectral ratio if available (Figures 6 and 7). For all the stations, H/V noise spectral ratios and H/V earthquake spectral ratios show similar shapes, particularly in terms of resonance frequency. The amplitude of the H/V earthquake spectra ratio is higher than that of the noise one as observed before [see for example Haghshenas et al. 2008, for a detailed comparisons between noise and earthquake H/V spectral ratios], especially at frequencies lower than the resonance frequency.
Comparison of H/V spectral ratios performed on earthquake and on seismic noise for stations YTMZ, MILA, MTSB, KNKL and MCHI.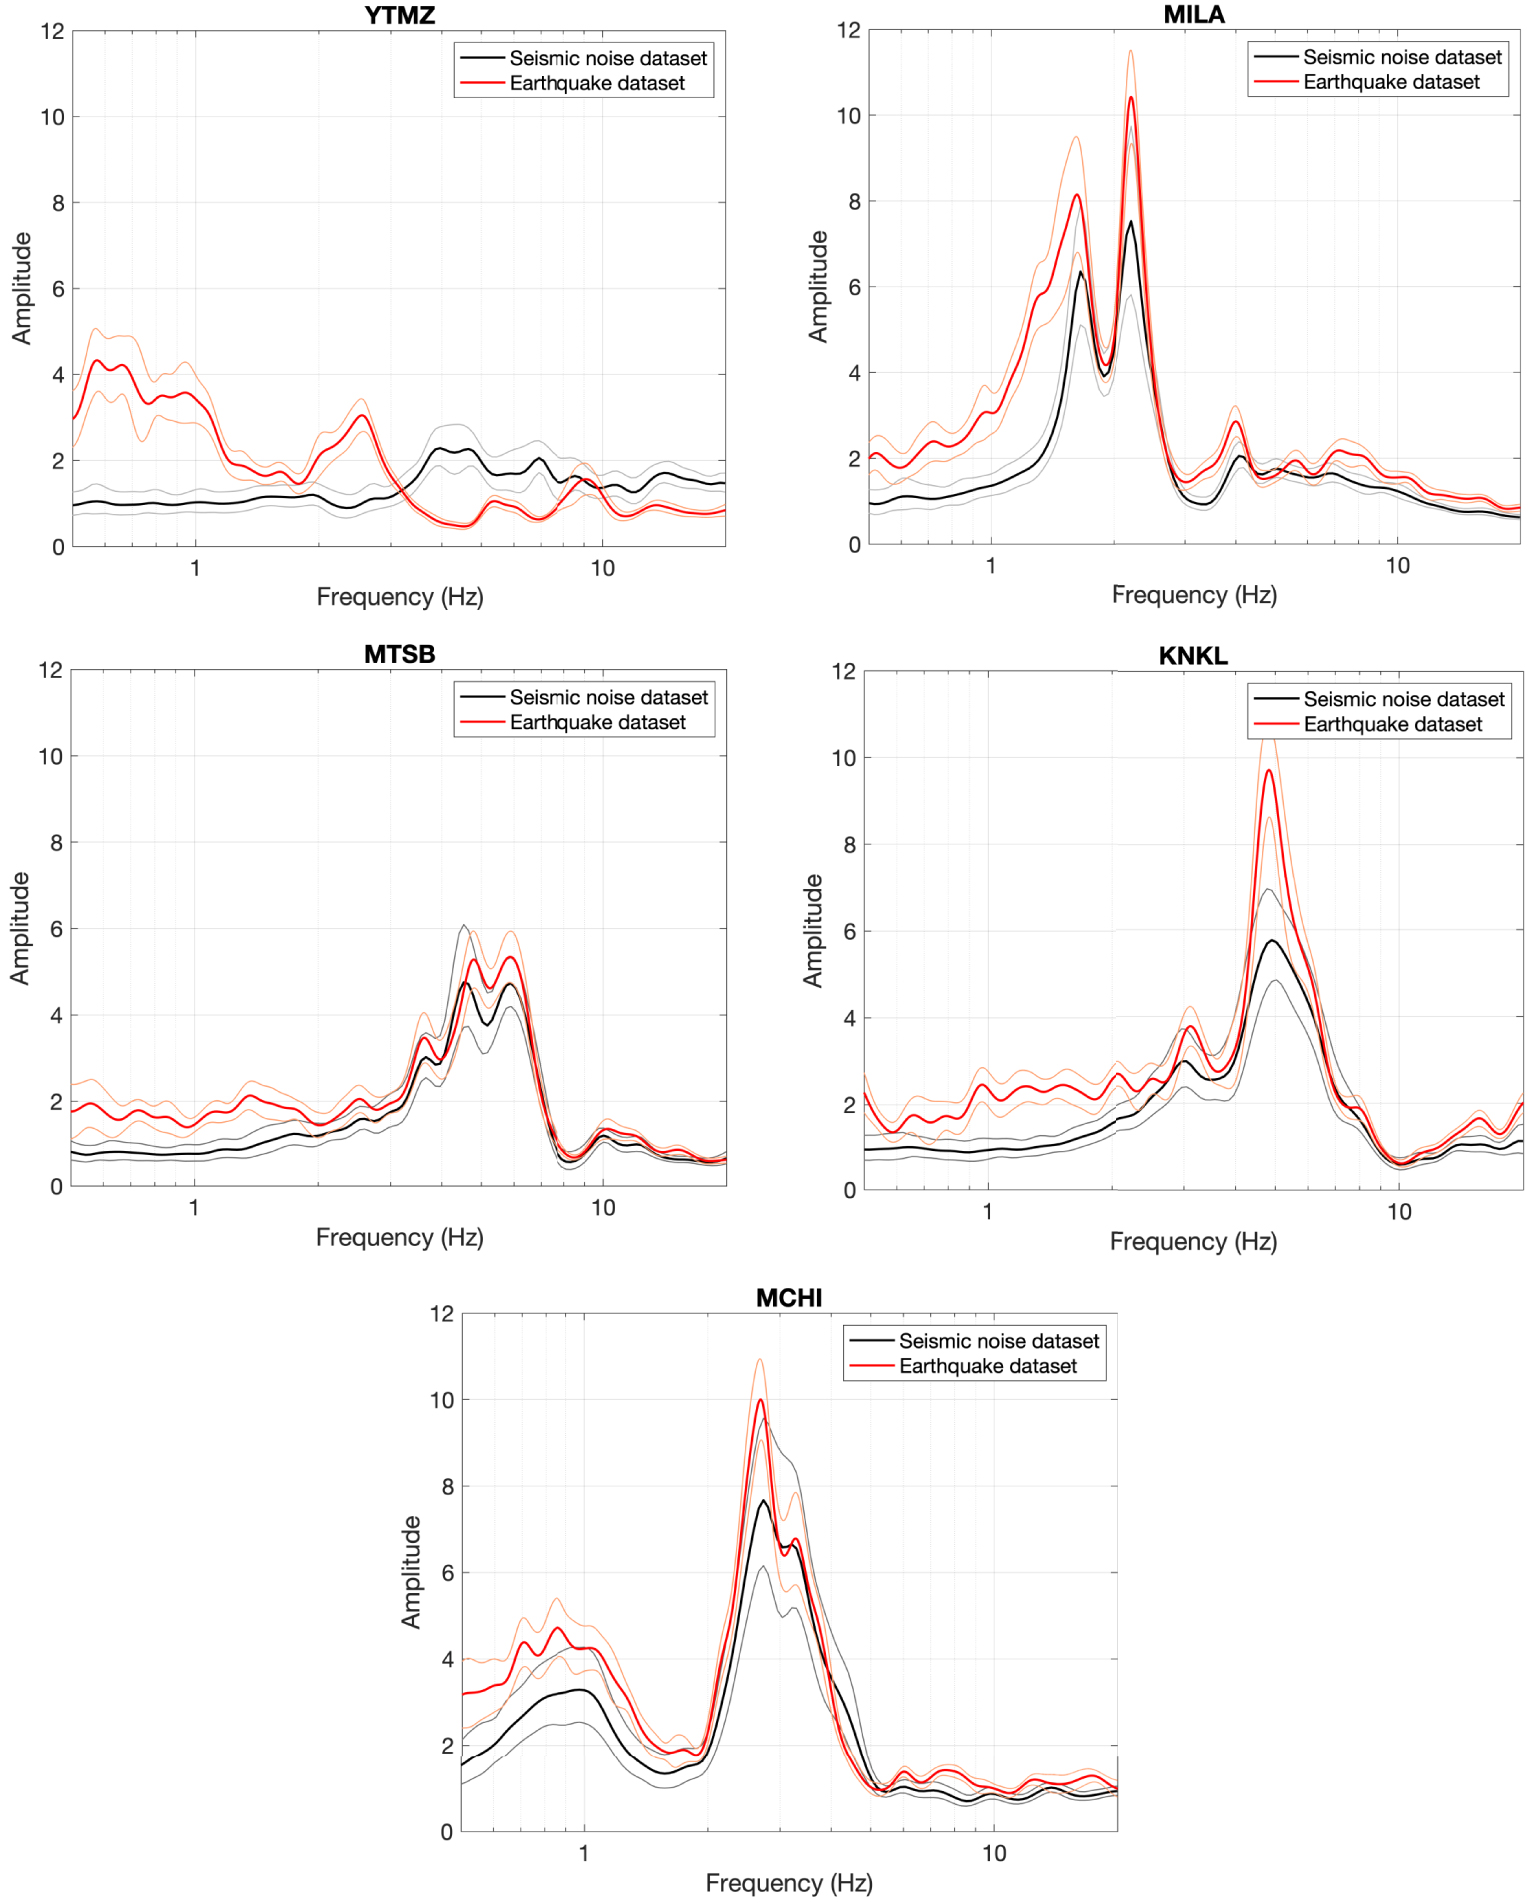
H/V noise spectral ratio for stations R1EE2 and PMZI.
The YTMZ station, located on recent volcaniclastic formations with little alteration, is considered since the beginning of the seismo-volcanic crisis as the reference station. It is a key station for monitoring the crisis since it is the only one that recorded the entire crisis. The H/V noise spectral ratio shows a value close to 1 for most of the frequency range and a slight amplification around 2.5 Hz. This amplification is not visible on the H/V earthquake spectral ratio, which shows a slight amplification at low frequencies. Although these spectral ratios are not perfectly flat and equal to 1 over the entire frequency range considered (the ideal case of a rocky site with no site effect), the observed amplifications have much lower amplitudes than those observed at the other sites. We can therefore consider that this station does not present a significant site effect and is a good reference station for Mayotte.
The MILA station, located on a hill of about 50 m height made of isalterites, presents two close peaks at 1.6 and 2.2 Hz on the H/V ratios, both for the noise and earthquake spectral ratios. MASW measurements made at the site yield an S-wave velocity of approximately 290 m/s between 0 and 15 m depth as shown in Figure 8. The VS,30 value could be estimated by extrapolating the VS(z) profile using Boore’s [2004] formula and is about 350 m/s, which would correspond to a minimum thickness of soft formation at the surface of 40 m if (1) is considered, consistent with the geological knowledge of the site. For this station, the azimuthal analysis of the H/V noise spectral ratio (Figure 9) shows a variation in the amplitude of the H/V peaks but without the disappearance of any peak, with a maximum amplitude between N060 and N170, indicating a potential geometric effect. These observations suggest a complex combination of effects related to the nature of the involved rocks and the topography as observed by Spudich et al. [1996] on the Tarzana hill during the 1994 Northridge earthquake, or on the Rognes hill which suffered severe damages during the 1909 Provence earthquake [Glinsky et al. 2019], or in a fractured rock site subjected to significant damages during the L’Aquila earthquake in Italy [Di Naccio et al. 2017], or even in landslide areas as studied for example by Del Gaudio et al. [2014] in the Terano landslide site, Italy. In all those cases, both the geomechanical characteristics of the geological layers (fracturing, presence of a fault, presence of a low velocity layer in surface), combined with a geometric effect linked to the surrounding topography, produced important amplifications of ground motion associated with strong directivity patterns. The MTSB and KNKL stations, both located at the bottom of the slope on colluvium, show a single resonance centered around 5 Hz (Figure 6), corresponding to soft material of lesser thickness than on MILA, in coherence with the alteration model proposed in Figure 2 and the known geology. For these two stations, the study of the directivity of the H/V noise spectral ratio shows a strong variability of the peaks according to the azimuth (Figure 9). This is of particular interest for the MTSB station for which we observe a H/V resonance peak of lower amplitude than the other stations and spread between 4.5 and 6.5 Hz, and for which the directivity analysis of the H/V ratio indicates a predominance of the lowest resonance frequency (around 4.5 Hz) at N080 and a predominance of the highest resonance frequency (around 6.5 Hz) at N180. This could correspond to a topography-related surface wave separation [Roten et al. 2006] with the predominance of Love waves at low frequency and N080 and Rayleigh waves at higher frequency and N180. For the KNKL station, the observed resonance seems simpler with a very strong peak at 5 Hz and the appearance of a secondary peak around 3 Hz for azimuths N040 to N080. Here again, geometric effects are possible.
MASW profiles for the seismological station MILA. The black profile was acquired on the station site whereas the grey profiles were acquired at 200 m of the station site. Each grey VS(z) profile corresponds to a different shot of the same MASW profile.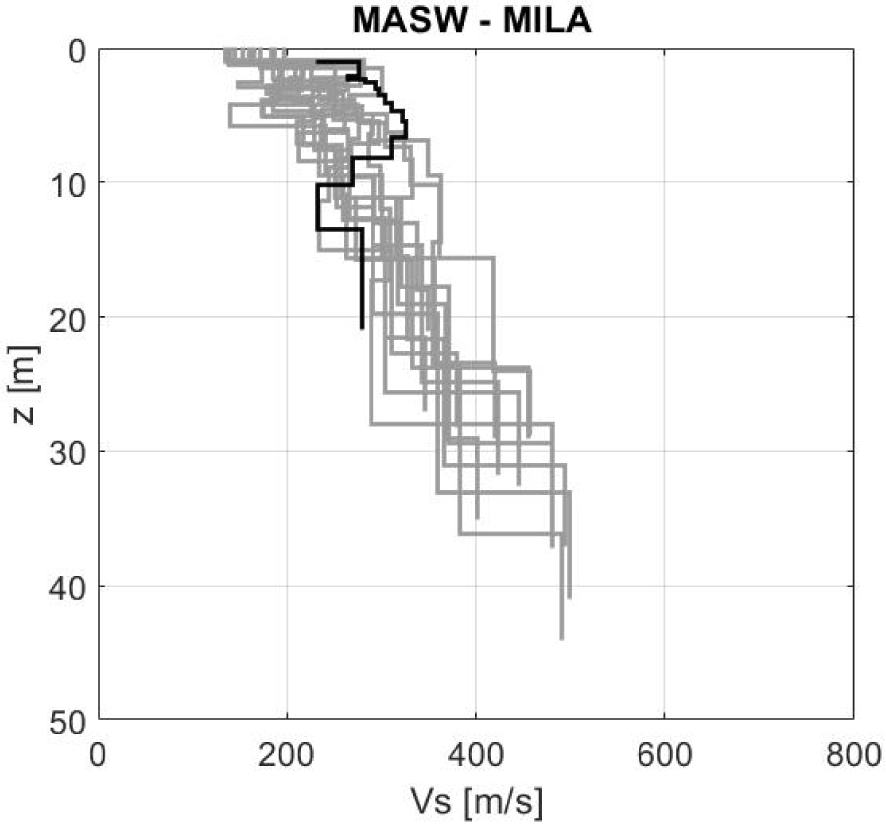
Azimuthal variation of H/V spectral ratio for stations MILA, MTSB and KNKL.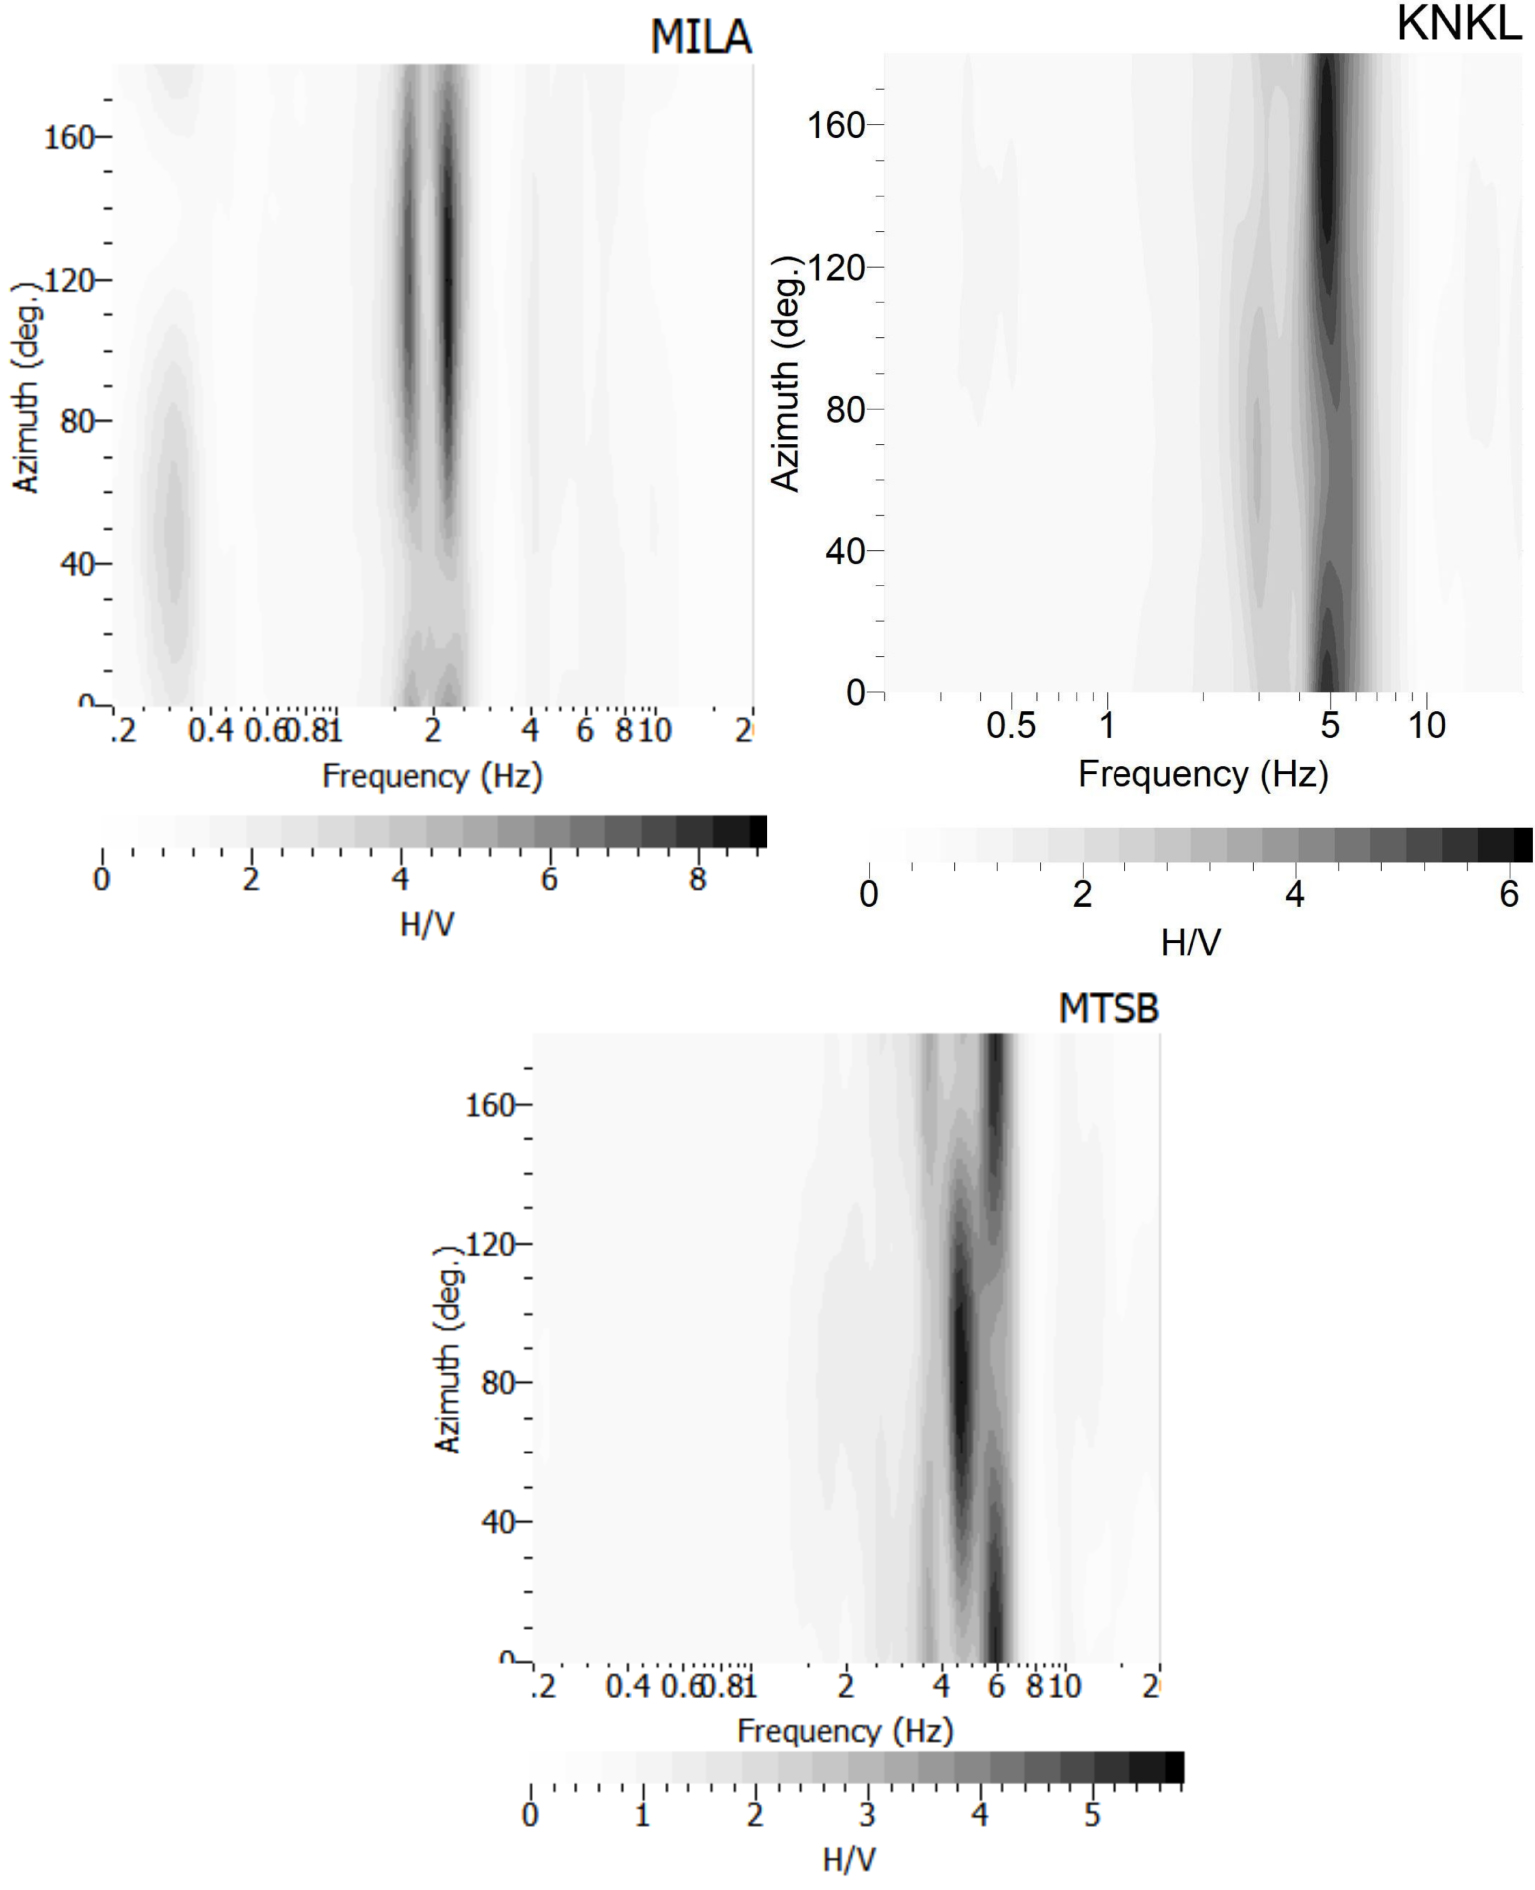
The MCHI station shows a lower frequency peak around 2.9 Hz, with a very good correspondence between the H/V noise and earthquake spectral ratios both in terms of frequency and amplitude (Figure 6). This station is located on a high plateau area filled by a large thickness of isalterites (Combani paleosurface), consistent with the observed resonance frequency, which corresponds to a filling of several tens of meters thickness (of the order of 25 m thickness according to (1) if we consider a VS value of the order of 305 m/s as indicated in Table 4, in the next section). For this station, the H/V directivity analysis (not shown here) indicates a stable peak in amplitude, independent of the azimuth considered, in coherence with the flat topography of the site.
The Station R1EE2, located on alloterites at the top of the alteration profile, has two distinct resonance frequencies (Figure 7): one, not very pronounced, around 1 Hz and the second, of higher amplitude, at 3.7 Hz. This weak low frequency amplification is also found on the MCHI station located about 1.5 km east of R1EE2 and on the H/V noise spectral ratios acquired north of the area, in Combani, in a similar geological context. The response of this station would therefore correspond to the presence of two distinct interfaces: one quite deep, around 75 m deep, and the other, more superficial, around 20 m deep, assuming a tabular environment with a surface layer of VS = 300 m/s. These hypotheses will need to be validated by a more detailed study of the 3D structure underlying the station. The PMZI station, located on the volcaniclastic formations of Petite Terre, presents a unique amplification at 2.6 Hz, probably corresponding to a rather thick soft layer (several tens of meters). The absence of MASW data in the vicinity of the area and the high spatial variability of the volcaniclastic formations do not allow us to go further in the interpretation of the data. The last station analyzed here is the Badamiers site, TBAD. It is in fact a site located to the north of Petite Terre, on the volcaniclastic formations, and potentially intended to host a permanent seismological station as part of the seismological monitoring of the Mayotte territory to replace the PMZI temporary station currently used. Although this station was installed for a short time in 2020 and therefore does not have a sufficient earthquake record dataset for a complete analysis of site effects on its site, we have chosen to show the preliminary results obtained on this site to demonstrate the importance of analyzing site effects before any permanent installation. The H/V ratio of the TBAD station (Figure 10) shows a rather peculiar pattern with peaks at 1.5 Hz, 8.3 Hz, and 12.4 Hz. The analysis of the damping on each of these frequencies confirms the natural origin of the peak at 1.5 Hz with an attenuation value of 4% and shows us that the peak at 8 Hz is of anthropic origin with a damping lower than 1% [Dunand et al. 2002, Guillier et al. 2007]. We observe the same result at 12 Hz. Looking at the H/V ratio directivity, we can see a strong H/V peak directivity at 8 Hz, with a maximum amplitude between N020 and N080. This could correspond to the signature of the thermal power plant located about 500 m north of this site, in the N040 direction.
H/V noise spectral ratio (top left), azimuthal variation of H/V spectral ratio (top right) and damping at 1.5 Hz (bottom left) and 8.3 Hz (bottom right) at the station site TBAD.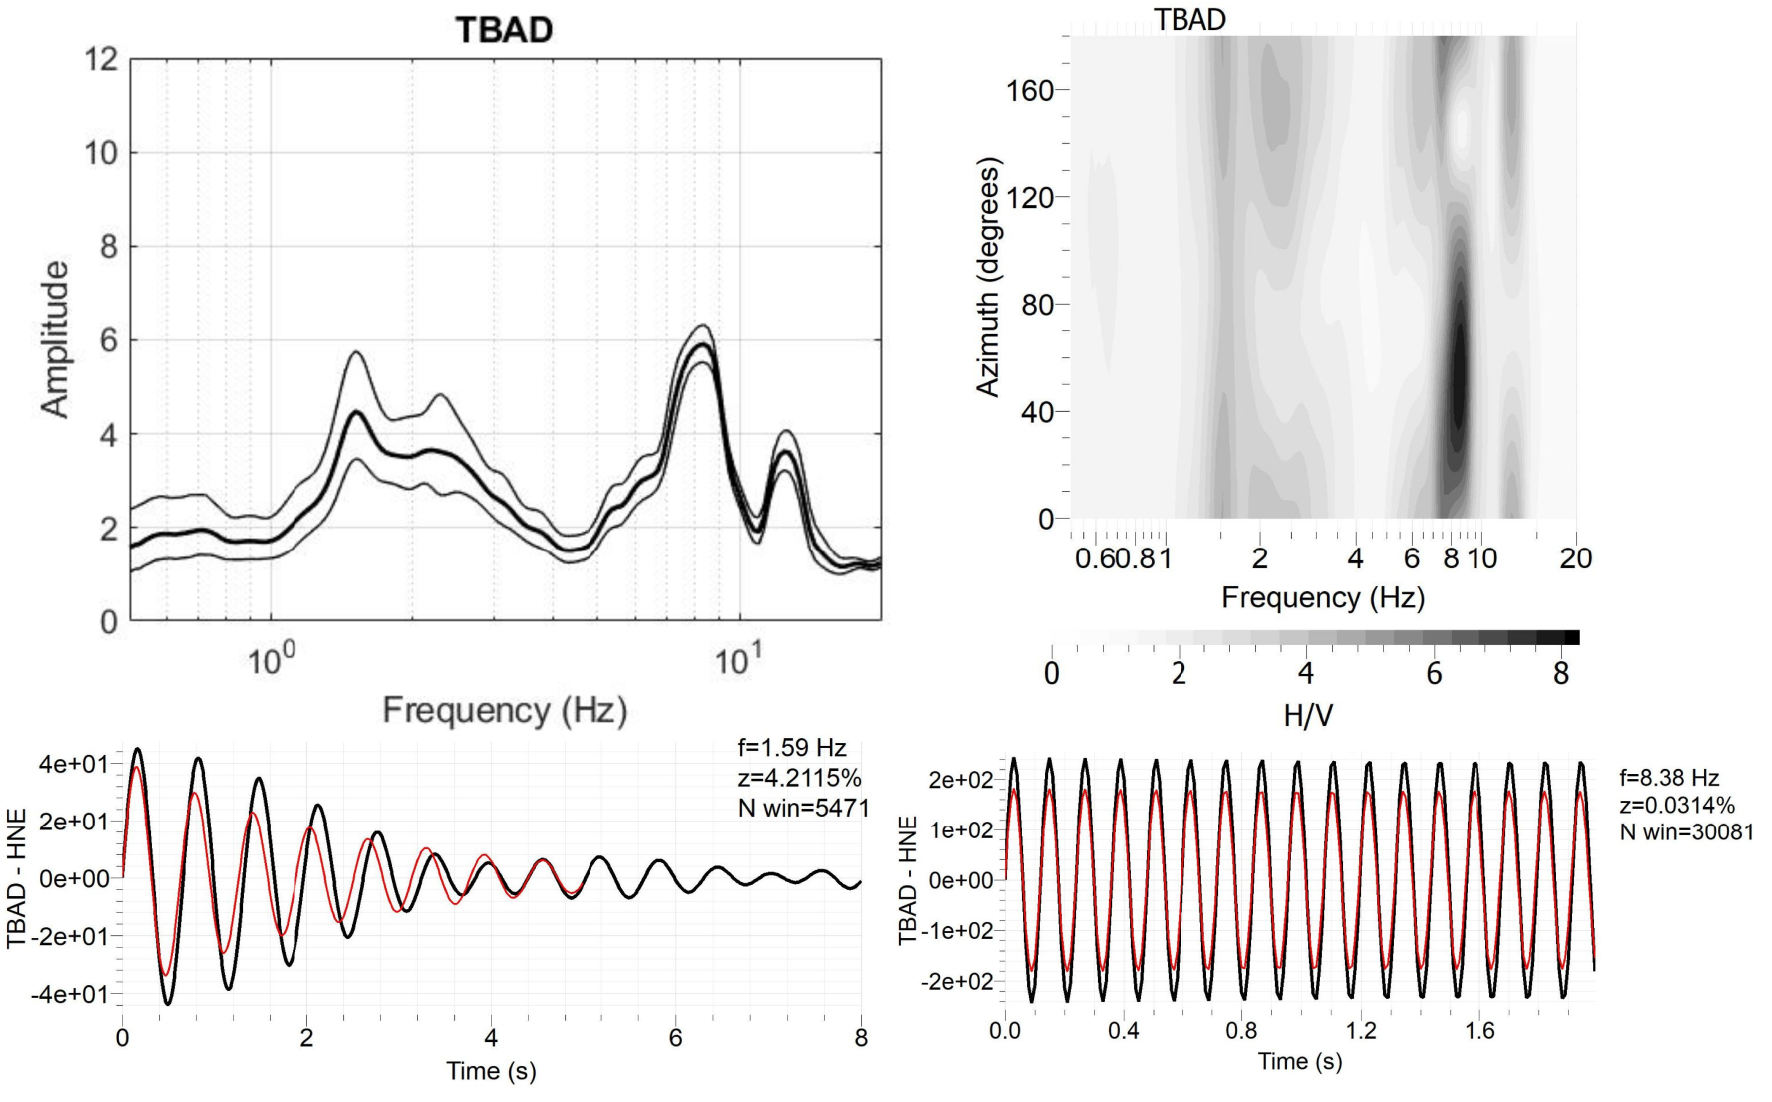
6. Preliminary geology-based site effects mapping at regional scale
The strong ground motion observations made during the seismo-volcanic crisis confirmed that the superficial geology of the island could lead to significant site effects, including on weathered volcanic formations [Bertil et al. 2019, 2021, Roullé et al. 2022]. Since the beginning of the 2000s, numerous local seismic hazard studies have shown that the Mayotte territory presents superficial geological formations likely to undergo lithological site effects [e.g., Audru et al. 2002, 2010]. This led us to produce, in the first months of the crisis, a new lithological site effects map at regional scale dedicated to the calculation of strong motion maps and damage scenarios for crisis management purposes [Taillefer et al. 2019, 2022]. This map has been upgraded since then including the analysis done in the framework of the revision of the local seismic hazard mapping of Mayotte, a study in progress on behalf of the local authorities. This paper describes the upgraded version of the preliminary map described in Taillefer et al. [2019, 2022].
For practical reasons of constrained time delays and costs, we decided to use only the available data (i.e., without carrying out additional measurement) and to base our site effects classification on the soil classes A–E derived from the European building code EuroCode 8 (EC8) [NF EN 1998-5 2005] and described in Table 3. Our site effects map is based on the 1:30,000 geological map of Mayotte Island [Nehlig et al. 2013, Lacquement et al. 2013, see Figure 1]. To complete the geological data, we compiled the geophysical data of the local seismic hazard studies realized by BRGM since 2000 (Figure 3). The H/V measurements and MASW profiles have been analyzed respectively in terms of resonance frequency f0, corresponding to the frequency of the maximum peak of the H/V spectral ratio, and VS,30 value, a site effect proxy from EC8 soil classification. This is calculated following the equation [Borcherdt 1994]:
| (3) |
Distribution of the H/V peak values (dominant resonance frequency) regarding simplified surface geology given in Figure 1. For each box, the central line represents the median, the edges of the box represent the 25th and 75th percentiles, the whiskers (dotted lines) extend to 1.5 times the interquartile ranges, and the outliers (data with values beyond the ends of the whiskers) are plotted individually (crosses). Corresponding values are indicated in Table 4.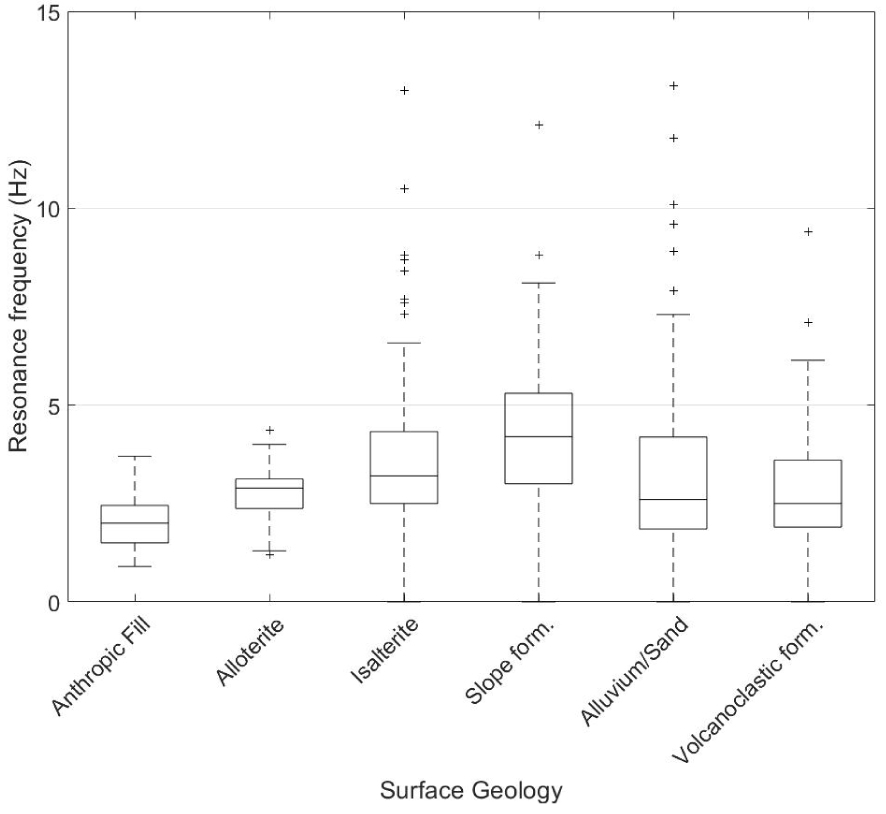
Distribution of VS,30 values regarding simplified surface geology. The box description is the same as for Figure 11. Corresponding Q25, Q50 and Q75 values are indicated in Table 4.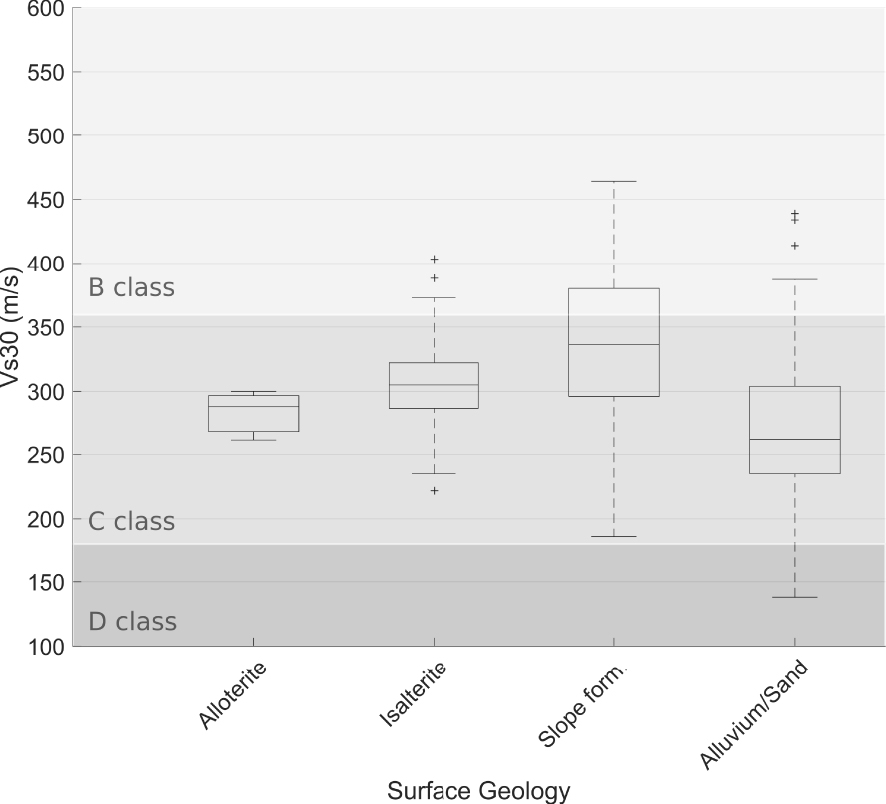
Description of the EC8 soil classes used in this paper
| Soil class | Description of soil profile | VS,30 parameter (m/s) |
|---|---|---|
| A | Rock or other rock-like geological formation, including at most 5 m of weaker material at surface | >800 |
| B | Deposits of very dense gravel, or very stiff clay, at least several tens of m in thickness, characterized by a gradual increase of mechanical properties with depth | 360–800 |
| C | Deep deposits of dense or medium-dense sand, gravel or stiff clay with thickness from several tens to many hundreds of m | 180–360 |
| D | Deposits of loose-to-medium cohesionless soil (with or without some soft cohesive layers), or of predominantly soft-to-firm cohesive soil | <180 |
| E | A soil profile consisting of a surface alluvium layer with VS,30 values of type C or D and thickness varying between about 5 m to 20 m, underlain by stiffer material with VS,30 > 800 m/s |
Statistical values for f0 and VS,30 parameters distribution (data count, Q25, Q50 and Q75) and EC8 soil class according to the simplified geology
| Simplified geology | f0 (count) | f0 (Q25) | f0 (Q50) | f0 (Q75) | VS,30 (count) | VS,30 (Q25) | VS,30 (Q50) | VS,30 (Q75) | EC8 class |
|---|---|---|---|---|---|---|---|---|---|
| Anthropic fills | 23 | 1.5 | 2.0 | 2.4 | 1 | — | — | — | As surrounding formation |
| Alloterites | 25 | 2.4 | 2.9 | 3.1 | 3 | 267 | 287 | 297 | C |
| Isalterites | 111 | 2.5 | 3.2 | 4.3 | 23 | 285 | 305 | 322 | C |
| Slope formations (colluvium, screes, breccias) | 153 | 3 | 4.2 | 5.3 | 42 | 296 | 336 | 380 | B or C or E |
| Alluvium, beach sands | 176 | 1.8 | 2.6 | 4.2 | 46 | 235 | 261 | 304 | C |
| Volcaniclastic formations | 66 | 1.9 | 2.5 | 3.6 | 0 | — | — | — | A on Grande-Terre island, B or C on Petite Terre island |
| Lava formations | 3 | — | — | — | 1 | — | — | — | A |
The first observation that can be made is that all the considered geological formations present a significant site effect with resonance frequencies globally between 1 and 5 Hz (Figure 11 and Table 4). If we consider a single layer medium characterized by shear-wave velocities between 200 and 300 m/s according to the available MASW profiles [see for example Rey et al. 2012, Roullé et al. 2019], this would correspond to thicknesses of superficial formations up to several tens of meters. These values are consistent with the geological outcrop data acquired for the achievement of the 2013 geological map where weathering profile thicknesses from 20 m to 70 m were observed [see Nehlig et al. 2013]. These observations corroborate the importance of site effects on Mayotte observed in Figure 5 both in terms of amplification and spatial extent. The spatial variability of the observed resonance frequencies can occur over distances of the order of a few hundred meters as shown by the example of the Dembeni site (Figure 13). On this example, we observe a strong variability of f0 values on the isalterite formations located on the south-western zone of the map with values ranging from 3.7 to 13 Hz in less than 200 m of distance. On the contrary, the f0 values observed on the south-eastern hill with outcropping isalterites (values ranging from 2.2 to 3.5 over a distance of 200 m) are rather stable. A detailed knowledge of the geometry and geomechanical characteristics of those weathered formations would be necessary to better understand such variability patterns. The analysis of the VS,30 parameter distribution (Figure 12) shows a quite similar trend for the four analyzed geological formations with most of the VS,30 distribution (i.e., the interval between Q25 and Q75) ranging from 230 to 380 m/s. The autochthonous altered volcanic formations (alloterites and isalterites), which form the upper weathering profile on top of the fractured lava formations (see Figure 2 for a conceptual presentation of a characteristic weathering profile in Mayotte Island), present values around 270–320 m/s. Both their lithological characteristics, geometry, and VS,30 values lead us to consider them as a C soil class. The allochthonous formations classified as slope formations (mainly colluvium) present higher VS,30 values between 300 and 380 m/s. These formations drape the sides of the reliefs: their thickness is prone to increase downstream and can reach 10 m at particular areas of accumulation. They present different facies from fine colluvium to boulder colluvium with strong lateral variations of facies and thickness. At the bottom of the reliefs, these formations tend to rest directly on bedrock with a clear contact between the two formations. Those formations are thus difficult to classify following EC8 criteria since they can be considered either as B, C or even E soil class in certain configurations. At present, neither geological nor geomorphological information permits us to distinguish the different possible configurations: so we decided to keep a B, or C or E classification in our preliminary map but this point should be clarified in future works. The alluvium and beach sands, on the other hand, present VS,30 values mainly between 235 and 304 m/s (Q25–Q75 interval) with a median value of 261 m/s, which corresponds clearly to a C soil class. The visible spread towards higher values of VS,30 (above 300 m/s) corresponds to areas at the edge of the basins where the alluvial deposit is thinner. For geological formations without sufficient VS,30 measurements to lead to a simple EC8 classification (anthropic fills and lava or volcaniclastic formations), we proceeded by expert analysis. Thus, as the anthropic fills present variable mechanical characteristics and relatively small thicknesses and a very small area (less than 1% of the entire area of the island), we preferred to assign them an EC8 soil class similar to the surrounding geological formation. As for the lava formations, corresponding to the least altered volcanic deposits of the island and essentially present on the coasts, the tops of crests and the bottoms of gullies, we considered them as bedrock, that is to say, as an A soil class.
Dominant resonance frequencies f0 observed at the Dembeni site on a simplified geological map and topographic background. The location of the site is indicated by a rectangle in the map at the top right. The colours correspond to the geological formations shown in Figure 1. The shading used as a base map corresponds to the IGN DEM at a 5 m resolution.
Finally, the case of volcaniclastic formations is more complex. They consist mainly in the phreatomagmatic projections of Petite Terre and Mamoudzou, which are characterized by ash deposits that are often poorly consolidated but very heterogeneous both in terms of granulometry and lithology. The f0 resonance frequency values issued from the H/V measurements available to date indicate the presence of lithological site effects on these formations (Figure 11 and Table 4), but the spatial distribution of the H/V measurements, mostly around the airport area on Petite Terre, does not allow us to confirm that observation on a more expanded area. In addition, the reference station YTMZ used to monitor the seismo-volcanic crisis and situated in Grande Terre, is also located on these formations and does not present a significant site effect (Figure 6). This station being preponderant in the calculation of the strong motion maps, we decided to assign the A soil class to all the volcaniclastic formations located on Grande Terre Island and a B or C soil class for the specific deposits of phreatomagmatic projections of Petite Terre. This decision ensures that strong motions are not overestimated during the real-time shake map calculation process, based on the acceleration values observed at terrestrial seismological stations and which takes into account station site conditions. Work in progress for the local authorities of Mayotte, with a forthcoming H/V and MASW survey on Petite Terre, should make it possible to modulate this classification in the future. The EC8 soil classes assigned to each surficial geological formation defined in Figure 1 allowed us to build a preliminary lithological site effects map (Figure 14) based on a simplified geology of the island and usable for real-time calculation of strong motion maps (shakemaps) and damage maps (SEISAID releases) in case of significant seismic event [Auclair et al. 2015, Guérin-Marthe et al. 2021]. The results show that only 6% of the Mayotte territory can be considered as EC8 site class A (rock site). Consequently, the urban areas are mainly located on soils prone to site effects, which could imply severe consequences in terms of seismic risk. This map was built from existing and partial data, especially in terms of spatial distribution. It therefore needs to be improved to better take into account the geometric complexity and spatial variability of the geological formations, for example for volcaniclastic formations. Work is currently underway as part of a project to revise the local seismic hazard on behalf of the local authorities. The idea is to integrate information on the weathering thickness and geometry of surface formations via additional in-situ geophysical measurements and analysis of airborne EM data. This study could lead us shortly to revise the preliminary lithological site effects map presented in this paper.
Geology-based lithological site effects map in terms of EC8 soil classes. The corresponding surface areas for each soil class are indicated in the legend.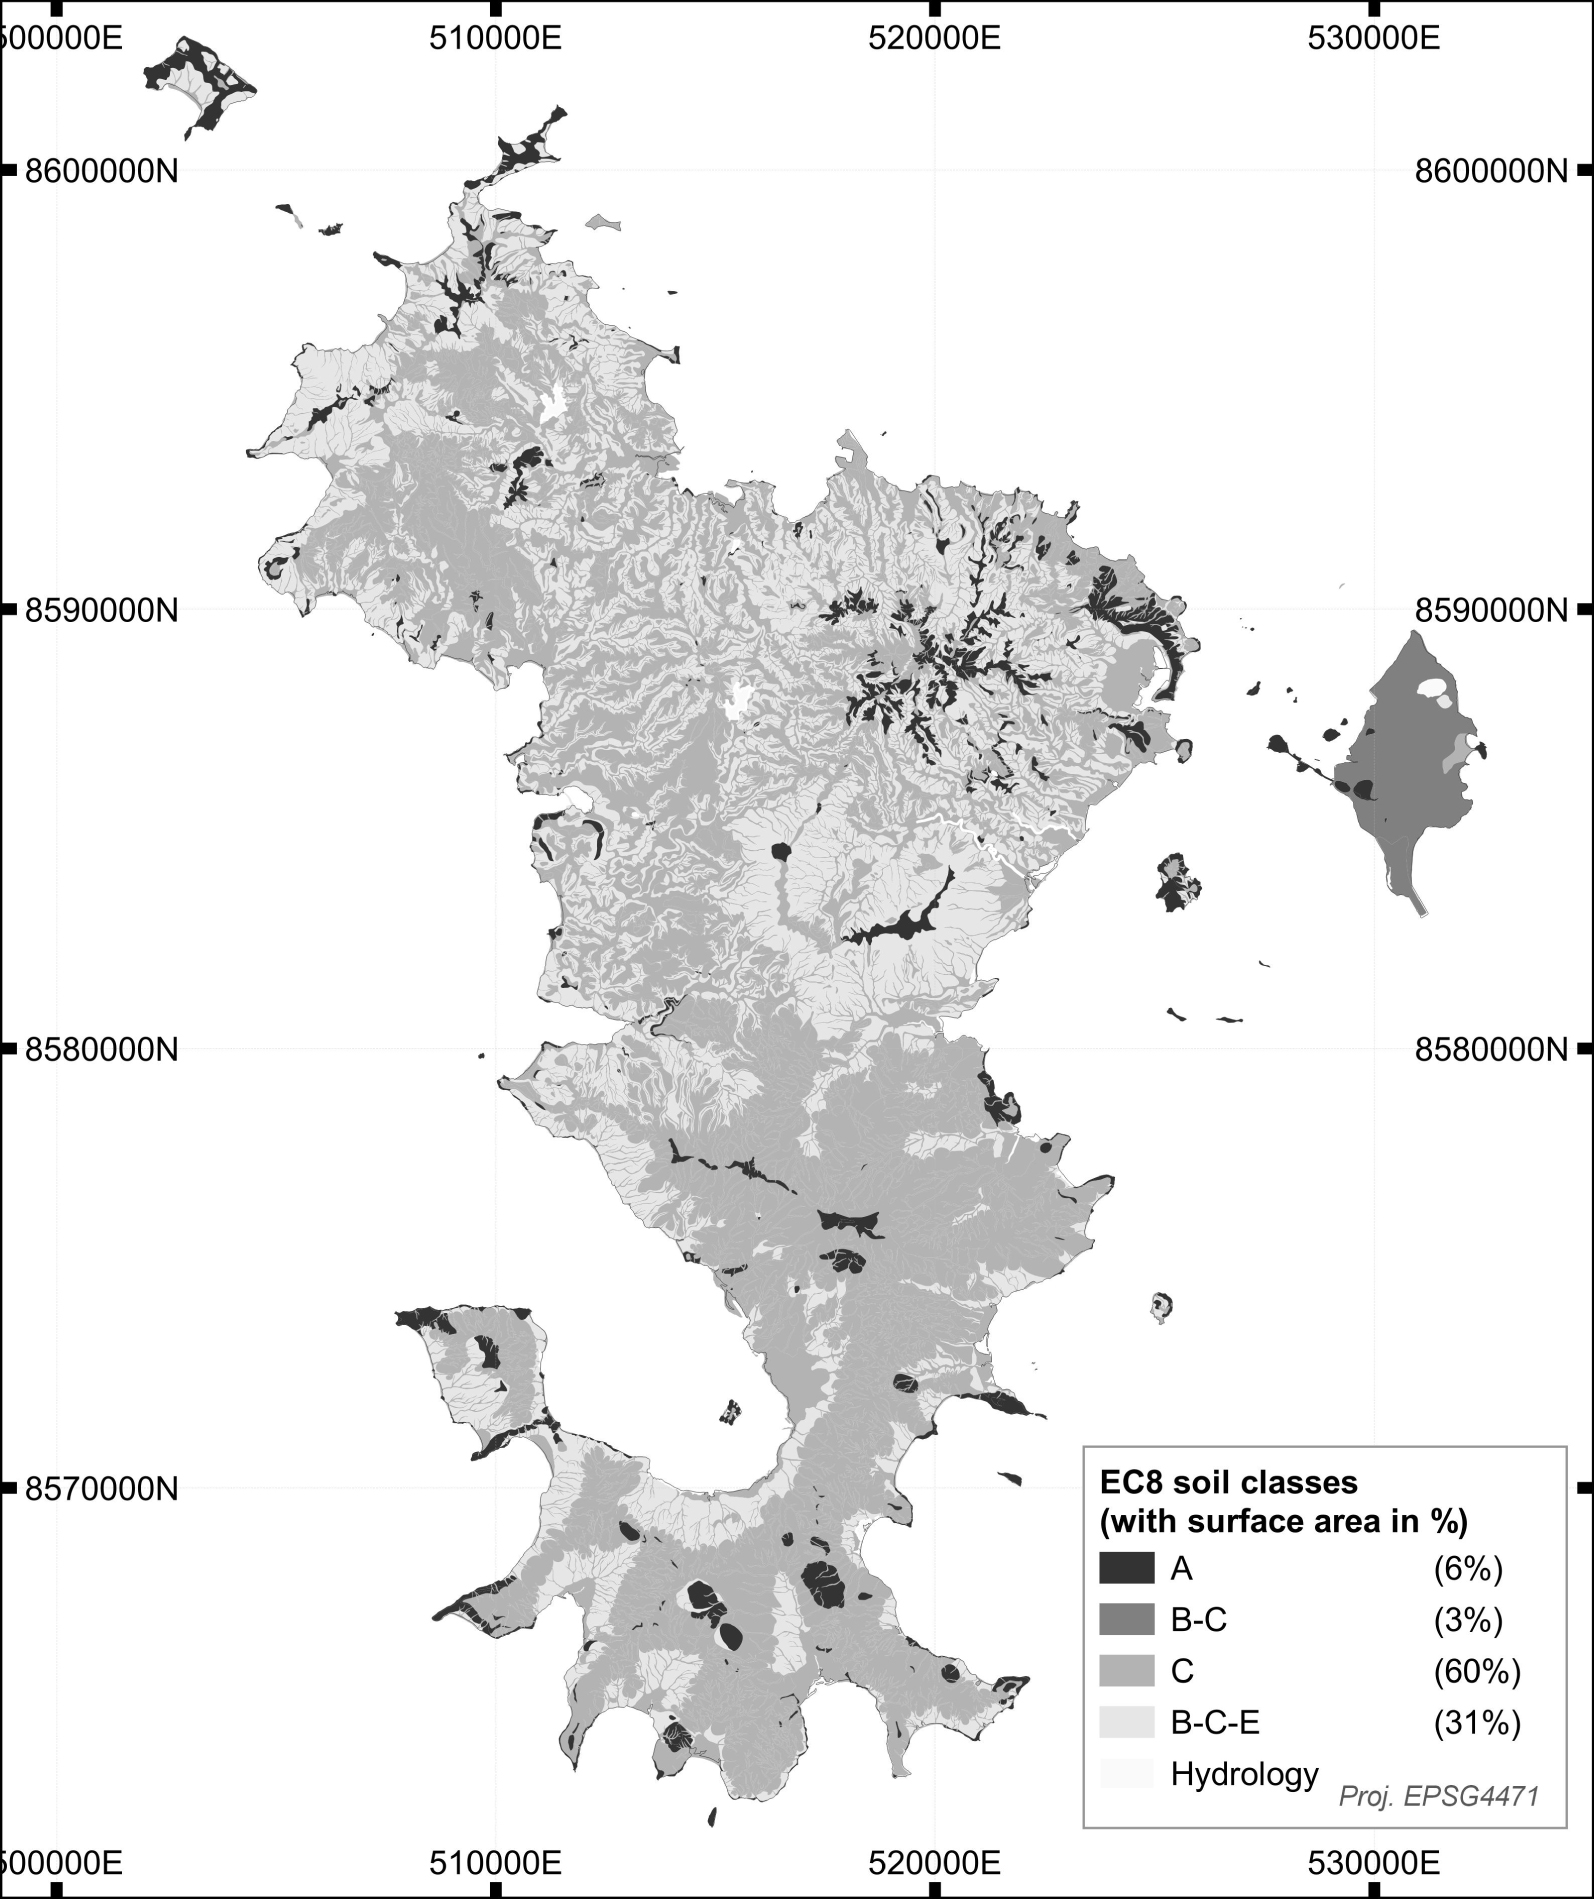
7. Discussion and conclusion
The seismo-volcanic crisis initiated in May 2018 in Mayotte led us to assess the strong motions on the territory for crisis management and seismic monitoring purposes via the calculation of strong motion and damage maps (for risk scenarios, shake maps, seismological bulletins, etc …). In this context, an estimation of the site effects, potentially responsible for a local amplification of the seismic motion, is essential.
We first reanalyzed all the H/V and MASW data acquired in the last 20 years by comparing them to the recent geological map of the surface formations of Mayotte, which takes into account the levels of weathering of the various outcropping geological formations [Lacquement et al. 2013, Nehlig et al. 2013]. The results show that the alteration of volcanic rocks in Mayotte induces generalized site effects since all the geological formations for which we have data show a clear resonance (Figure 4, Table 4) and low values of VS,30 (Figure 5, Table 4).
These results are based on weak ground motion (seismic noise) and need to be validated by comparison with strong ground motion observations. The seismo-volcanic crisis initiated in 2018 has allowed the constitution of an unparalleled set of strong ground motion data for the study of the response of highly weathered volcanic formations under seismic load. The first analyses show the importance of the amplifications observed on the analyzed seismological stations, with median amplification factors of 1.4 to 4.9 for the PGA compared to the reference station YTMZ (Table 5). In addition, the analysis of the H/V spectral ratios showed the possible combination of lithological effects linked to the presence of soft layers on the surface and topographical effects linked to the geometry of the site (relief in particular), as is the case, for example, at the MILA station, which recorded the strongest motions (180 mg) during the main earthquake of 15∕05∕2018 (Mw = 5.9). However, the work done here presents several limitations since it only covers PGA values between 0.1 and 10 mg with little data above 10 mg (except for the MILA station) and present a strong bias in azimuthal covering since most of the analyzed event epicenters are located full east. It would be interesting to pursue the data collection and analysis to complete those preliminary results. Further works on this exceptional dataset should advance our understanding of site effects in a highly weathered volcanic environment with direct operational application in Mayotte but also in the West Indies, the highest seismic hazard zone in France.
Summary of the information characterising the sites of the seismological stations studied in this paper
| Stations | YTMZ | MILA | MTSB | MCHI | KNKL | TBAD | PMZI | R1EE2 |
|---|---|---|---|---|---|---|---|---|
| Network | RA | RA | 1T | ED | QM | None | 1T | AM |
| Site name | Mamoudzou | Iloni | M’Tsamboro | Chiconi | Kani-Keli | Badamiers | Pamandzi | Coconi |
| Superficial geology | Volcaniclastic formation | Isalterites | Colluvium | Isalterites | Colluvium | Volcaniclastic formation | Volcaniclastic formation | Alloterites |
| Lithological effect | No | Yes | Yes | Yes | Yes | Yes | Yes | Yes |
| Suspected topographical site effect | Yes | Yes | Yes | |||||
| Resonance frequencies (Hz) | 1.6 and 2.2 | 5 | 1 and 2.8 | 4.8 | 1.5 | 2.6 | 1 and 3.7 | |
| Median PGA ratio between the station and YTMZ | 1 | 3.3 | 4.9 | 1.4 | 3.8 | Not calculated | 3.0 | 2.2 |
| VS,30 (m/s) | 350 | |||||||
| Estimated EC8 class | A | C | B–C–E | C | B–C–E | B–C | B–C | C |
For each station, we indicate: the station code, its corresponding network, the name of the site, the simplified surface geology (Figure 1) from the 1:30,000 geological map of Mayotte [Lacquement et al. 2013], the presence or absence of a lithological and topographical site effect on the station, the associated resonance frequency, the median PGA ratio between the site and the reference station YTMZ on the analyzed earthquakes, and the measured VS,30 value, if available. In case of double H/V peaks, both frequencies are indicated and the dominant one (with the maximum amplitude) is underlined.
Beyond the analysis of this exceptional strong ground motion dataset, we also proposed a preliminary lithologic site effects map based on the 1:30,000 geological map produced in 2013 and EC8-derived soil classes estimated from the existing geophysical database (Figure 7). It shows that 94% of the Mayotte territory is likely to present a site effect linked to its superficial geology. This map is intended to be used in the framework of crisis management and seismic monitoring. Nevertheless, it presents several limitations:
- a poor spatial distribution of collected geophysical data, including a lack of data inland and in the south of the island, outside the main urban areas (Figure 2);
- a lack of knowledge of the 3D geometry of the interfaces of interest, which does not allow us, for example, to distinguish between soil classes B, C and E at the colluvium level (Figures 6 and 7);
- a lack of knowledge of the spatial variability of the geological formations concerned, which does not allow us, for example, to objectively characterize the volcaniclastic formations present especially on Petite Terre (Figure 7).
The mapping carried out will therefore evolve as knowledge of the Mayotte subsoil improves, particularly in terms of the thickness of surface layers and their geomechanical characteristics. Finally, the importance of the site effects observed on the strong recordings analyzed in this paper leads us to recommend a systematic characterisation of the site parameters of the seismological stations in place within the REVOSIMA framework, following the recommendations of the European SERA project [Cultrera et al. 2021, Di Giulio et al. 2021] on the key parameters to be estimated as a priority and the protocols to be used to obtain good quality information. The most relevant indicators identified by Cultrera et al. [2021] are: the fundamental resonance frequency, the shear-wave velocity profile, the time-averaged shear-wave velocity over the first 30 m, the depth of both seismological and engineering bedrock, surface geology and soil class. A systematic calculation of the Frequency-Scaled Curvature proxy developed by Maufroy et al. [2015] should also provide information on whether a site is prone to such effect or not. In our case, the synthesis of the site characteristics from our work (Table 5) shows that a dedicated geophysical measurement campaign would provide the main missing proxy, namely the velocity profile VS(z) and the resulting parameter VS,30, and thus complete the site metadata of each station to obtain a standardised characterisation according to European quality criteria.
Conflicts of interest
Authors have no conflict of interest to declare.
Acknowledgments
We thank all the technicians, engineers and researchers who participated in the installation and operation of the Mayotte seismological stations. RESIF data centre provides data of RA and 1T networks stations (YTMZ, MILA, MTSB and PMZI). We thank IPGP for having shared the data of QM network station KNKL, EDUSISMO (www.edusismo.org) for having installed and maintained the station MCHI, and IRIS data centre and Raspberry Shake SA data centre for having provided R1EE2 data.
We also thank J.-M. Saurel for providing the TBAD data.
This work was funded by the Ministry of Environment (Ministère de la Transition Ecologique—MTE), the Department of the Environment, Planning and Housing (DEAL) of Mayotte, and the Ministry of Research (Ministère de l’Enseignement Supérieur et de la Recherche et de l’Innovation) through the BRGM own funds.
Detailed comments provided by Julie Régnier, Vincent Famin and one anonymous reviewer greatly improved the manuscript.