


 CC-BY 4.0
1. Introduction
The special IPCC report on climate extremes [Seneviratne et al. 2012] and its 6th assessment report [Ara Begum et al. 2022] highlighted the need to improve our understanding of processes and space–time dynamics of hydrological extremes, to be able to forecast and limit their impacts within the broader challenge of climate change mitigation. Although the role of groundwater in hydrological extremes is well-documented, surface–groundwater interactions are rarely identified well enough for a given watershed to be taken into account while trying to properly understand the hydrological behaviour of a catchment, and this is particularly true for extremes. Aquifers are often described as the buffering or storage elements of the catchments, able to store water and to release it with a delay [Van Loon 2015]; in other words, they have the slowest response, among water cycle elements, to climate events, with a filtering effect of the climatic signal [Lo and Famiglietti 2010; Wossenyeleh et al. 2021]. During droughts, this phenomenon results in aquifers supporting low flows by releasing water: this has been observed in numerous studies in many contexts [Tague and Grant 2009; Käser and Hunkeler 2016; Hayashi 2020; Tobin and Schwartz 2020; Anderson et al. 2021]. As for floods, they are more rapid phenomena in which the role of aquifers is more ambiguous: the buffering effect can consist in storing excess water and mitigating high flows [Chinnasamy 2016], but Kirchner [2003] highlighted that in many catchments, the flood flows are often mainly composed of groundwater that is mobilised by the excess recharge of aquifers, which was confirmed by local studies [Guérin et al. 2019; Wittenberg et al. 2019]. Flood events can even be caused by a rapid increase of water table levels in aquifers, which is known as groundwater flooding [Abboud et al. 2018]. The flood event in the Somme basin in 2000–2001 was concomitant to a rise in the groundwater table of more than 10 m [Pointet et al. 2003], with a large part of flood water carrying the isotopic signature of the chalk aquifer [Négrel and Petelet-Giraud 2005].
From a hydrological modelling perspective, taking into account the behaviour of aquifers is crucial for simulating and forecasting extremes. But this behaviour is heavily dependent on the local geological context [Eltahir and Yeh 1999; Soulsby et al. 2006; Bloomfield et al. 2015]. Existing coupled modelling approaches often involve complex distributed models to take into account these idiosyncrasies, with difficult parametrisation and costly computation [see, e.g. Barthel and Banzhaf 2015, for a review]. To develop simpler approaches that can be easily used in data-scarce or knowledge-scarce contexts, a prior assessment of the nature of the relationship between groundwater and surface water, in terms of hydrological events, must be made. When and where they are available, physical descriptors of the aquifer can provide indicators [Carlier et al. 2018; Wirth et al. 2020]. However, groundwater level time series, measured by piezometer networks, are real-time images of the state of aquifers: along with a minimal analysis of hydrogeological maps, they should be useful in assessing the nature of the river–aquifer interaction. Once the latter is established, these groundwater level time series could help to constrain a hydrological model, thereby possibly improving its performance, its robustness facing new conditions, its ability to represent flood peaks and low-flow recessions and its realism from a process representation point of view.
The development of a surface–groundwater joint modelling approach is conditioned by the choice of the right groundwater level measurement points—i.e. piezometers—according to the aim of the modeller. Indeed, to improve streamflow simulation and forecast, the additional information brought to the model should be relevant. For this work, we created a database of streamflow and groundwater level time series from 107 catchments and 355 piezometers, spread throughout mainland France and we computed annual low-flow and high-flow statistics. Through a simple correlation study, we assessed whether groundwater signal is representative of low flows, high flows or none of them. The dataset was then split into 14 groups, with homogeneous geological characteristics, to obtain synthetic regional information that can be used both by hydrologists and hydrogeologists in their particular context.
2. Presentation of the dataset
The 14 groups of catchment/piezometers pairs with the spatial extents of associated aquifers, according to the BDLISA [Brugeron et al. 2018] national reference map. Only formations regarded as permeable by BDLISA are shown, which can hide some local aquifer formations, especially bedrock formations.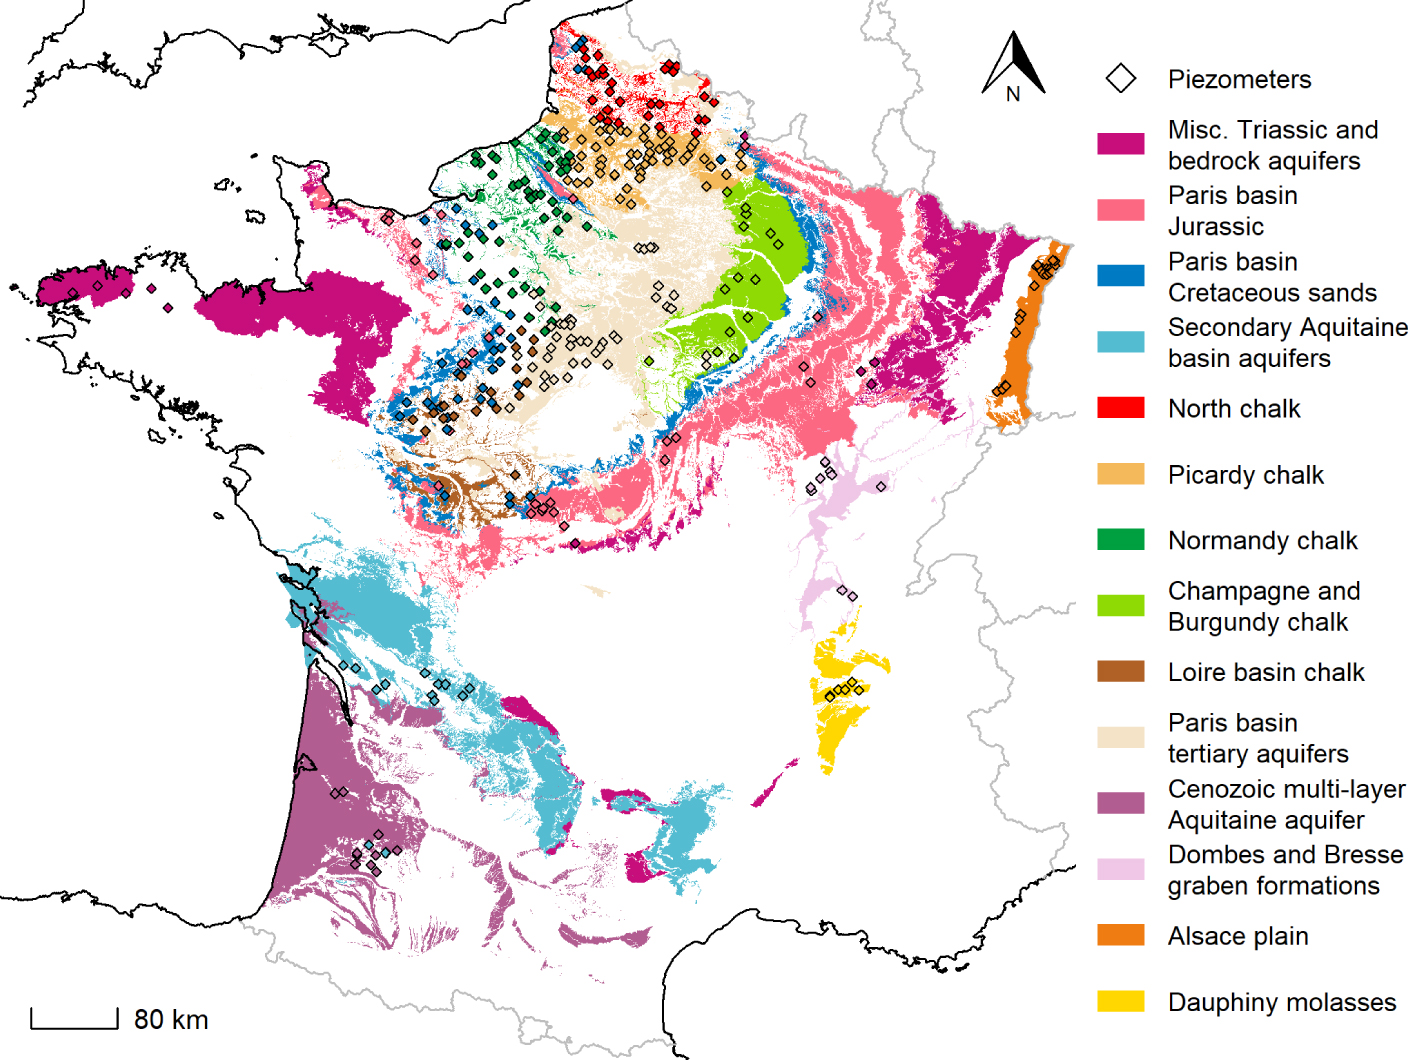
The French mainland territory hosts a wide diversity of climatic and geological contexts, which induces a large variety of hydrological and hydrogeological configurations and behaviours, as shown in Figure 1. The largest aquifers are located in two major sedimentary basins, the Paris basin and the Aquitaine basin, which host piles of secondary and tertiary formations. The Paris basin Late Cretaceous chalk aquifer and the tertiary limestone Beauce aquifer are among the largest ones in Europe, with major concerns about water use conflicts during droughts or groundwater-induced floods [Pinault et al. 2005; Lalot et al. 2015]. On the outer parts of the Paris basin, smaller aquifers such as Perche Cenomanian sands and Vosges Triassic sandstones are also crucial resources for drinking water supply or biodiversity support in rivers. These regional sedimentary aquifers are generally monitored by a network of long-term piezometers. Alluvial plains also host relevant and monitored aquifers, such as the Alsace alluvium or the Bresse graben gravels. Finally, regions in which the geology is dominated by metamorphic and plutonic formations, such as Britanny, host small local aquifers in fractured bedrock, some of which are monitored and can therefore be taken into account for the present study.
Data were taken from two national databases managed by the Ministère de la Transition Écologique (MTE): Banque Hydro [Leleu et al. 2014; Brigode et al. 2020; Delaigue et al. 2021] for streamflow and ADES [Chery and Cattan 2003; Chery et al. 2008; BRGM 2021] for groundwater level. Thousands of measurement points are available in these databases, with significant differences in data quality and time extent: an initial selection through visual inspection of time series was made to eliminate points with less than 20 years of available data and affected by anthropogenic influence, such as dams or major withdrawals for catchments and known significant pumping for piezometers—modelling the influence of human activities on catchments is outside the scope of the present study. Catchments in which more than 10% of precipitations fall as snow were also discarded, to avoid taking into account the memory effect of the snow cover.
After this first selection, catchment/piezometer pairs were created. First, each piezometer was assigned to a formation of the French national hydrogeological reference database, BDLISA [Brugeron et al. 2018]. Then, for each catchment, only piezometers whose hydrogeological formation is outcropping within the catchment borders were selected. Along with the criterion of 20 years of available data with less than 10% of missing points, a contemporaneity criterion was added: streamflow and groundwater level time series must have at least 10 years in common of available data, with less than 10% of missing points. Streamflow data are available at daily time step and groundwater level are available with variable time steps—daily, 10 days or monthly; for the study, all data were aggregated at monthly time steps.
Figure 2 shows the resulting dataset, comprising 107 catchments and 355 piezometers throughout the French territory, with a higher concentration in the Paris basin due to data availability. Each catchment is associated with 1 to 50 piezometers and one piezometer can be associated with 1 to 5 catchments, which results in 456 catchment/piezometer pairs to be evaluated. In a given catchment, several piezometers can monitor the same aquifer—the most relevant piezometer to represent this aquifer must be selected, through criteria like the quality of data or the local hydrogeological context—or different aquifers—the question is, in this case, more about which aquifer is relevant for hydrological modelling in this catchment. Similarly, the same piezometer can be paired with several catchments, because of nested catchments or because they are located on a watershed.
Map of database points: 107 catchments and hydrometric gauges and 355 piezometers.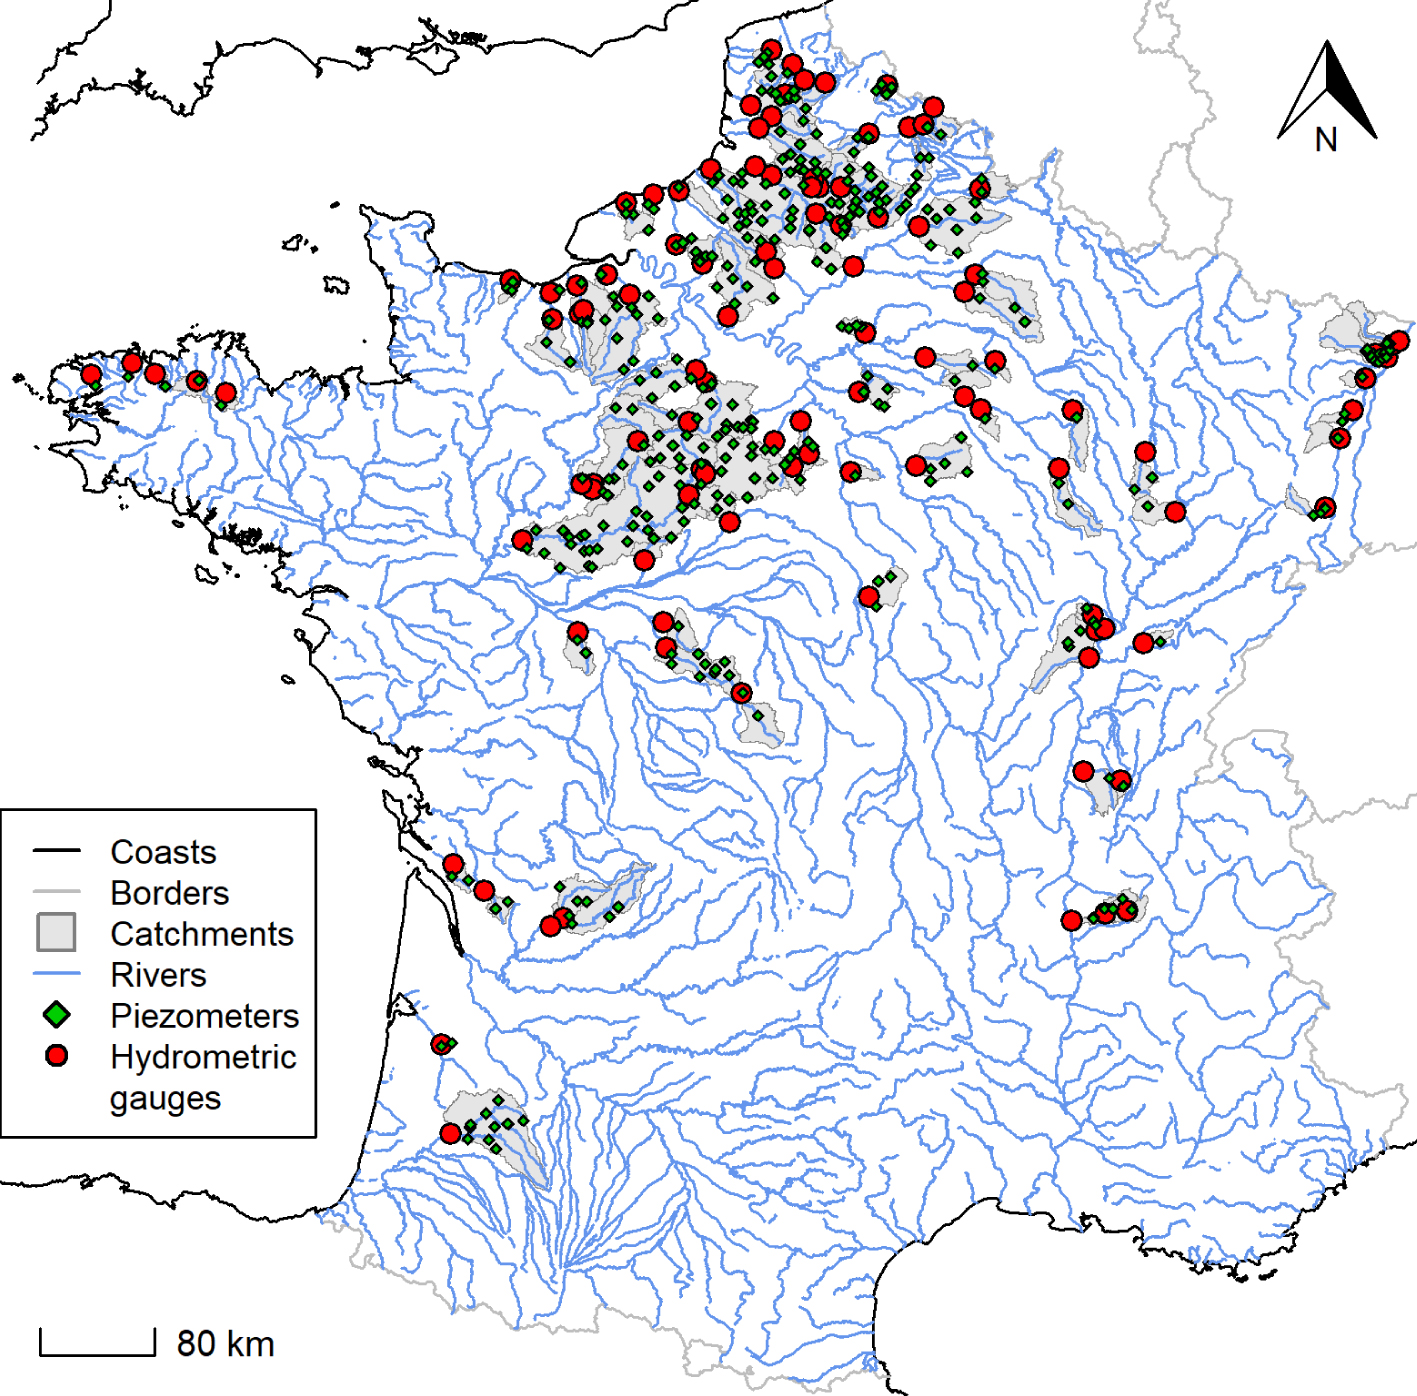
In order to reach regionally relevant conclusions, 14 groups of catchment/piezometers pairs were created, with homogeneous geological characteristics. Aggregated formations of BDLISA were used as grouping factors, but larger groups had to be created to avoid groups that are too small. In particular, Triassic and bedrock formations, despite having major differences in geological characteristics, were merged as a miscellaneous group of old rocks aquifers. The chalk aquifer of the Paris basin, which represents the majority of catchment/piezometer pairs due to the exceptional availability of monitoring data on its outcropping area, was split into 5 regional groups with homogeneous geological descriptors. The resulting groups are shown in Figure 1.
3. Methods
To assess the relationship between streamflow and groundwater level time series from the perspective of drought and flood events, we studied the correlation between yearly indicators of extreme events. We used the annual statistics QMNA and zMNA for droughts and QMXA and zMXA for floods [Allier et al. 2019]. QMNA is defined, for every year, as the minimum value of monthly means of streamflow; zMNA is the same indicator for groundwater level. QMXA and zMXA represent the maximum values of respective monthly means of the same time series. These statistics are preferred to the yearly minima or maxima of daily values because they are representative of the long-term dynamics of the time series, more than an isolated high-flow or low-flow event. Furthermore, the monthly aggregation makes the indicators less likely to highlight mistaken measurements or abnormal data. As control indicators, yearly mean streamflow Qm and groundwater level zm were also computed.
However, the calendar year is not the most adapted cut for computing these yearly indicators. Indeed, December and January can host both the end of the drought season and the start of the flood season—see, e.g. January 2018 with both a decadal flood event in the Seine basin and a persisting drought in the upper Loire basin [MTE 2018]. To compute the flood indicators QMXA and zMXA, the classic hydrological year from October 1st to September 30th was used [Linton 1959], since very few flood events happen at the end of summer. For droughts, a symmetrical dry hydrological year was used, from April 1st to March 31st, with the corresponding statement: most French rivers have above-average flows at the end of winter. Yearly means Qm and zm were computed using calendar years.
After computing these yearly extrema indicators, a correlation study was performed: are low and high groundwater levels correlated, respectively, with low and high streamflow? To assess this, for each catchment/piezometer pair, three values of Spearman correlation [Spearman 1907] were computed: between QMNA and zMNA, between QMXA and zMXA and between Qm and zm. These values were then grouped into the 14 groups of piezometers described in Section 2 to perform a regional analysis. Spearman correlation was preferred to other computations, such as Pearson correlation, since the groundwater level–streamflow relationship is generally non-linear [Eltahir and Yeh 1999]. To produce maps, for piezometers that are used in several catchments, the maximum value of each indicator was taken among the corresponding catchment/piezometer pairs.
4. Results and discussion
Maps of the resulting correlations between droughts, floods and average statistics of streamflow and groundwater level, shown at piezometer locations. For piezometers compared to several catchments, the maximum correlation was conserved.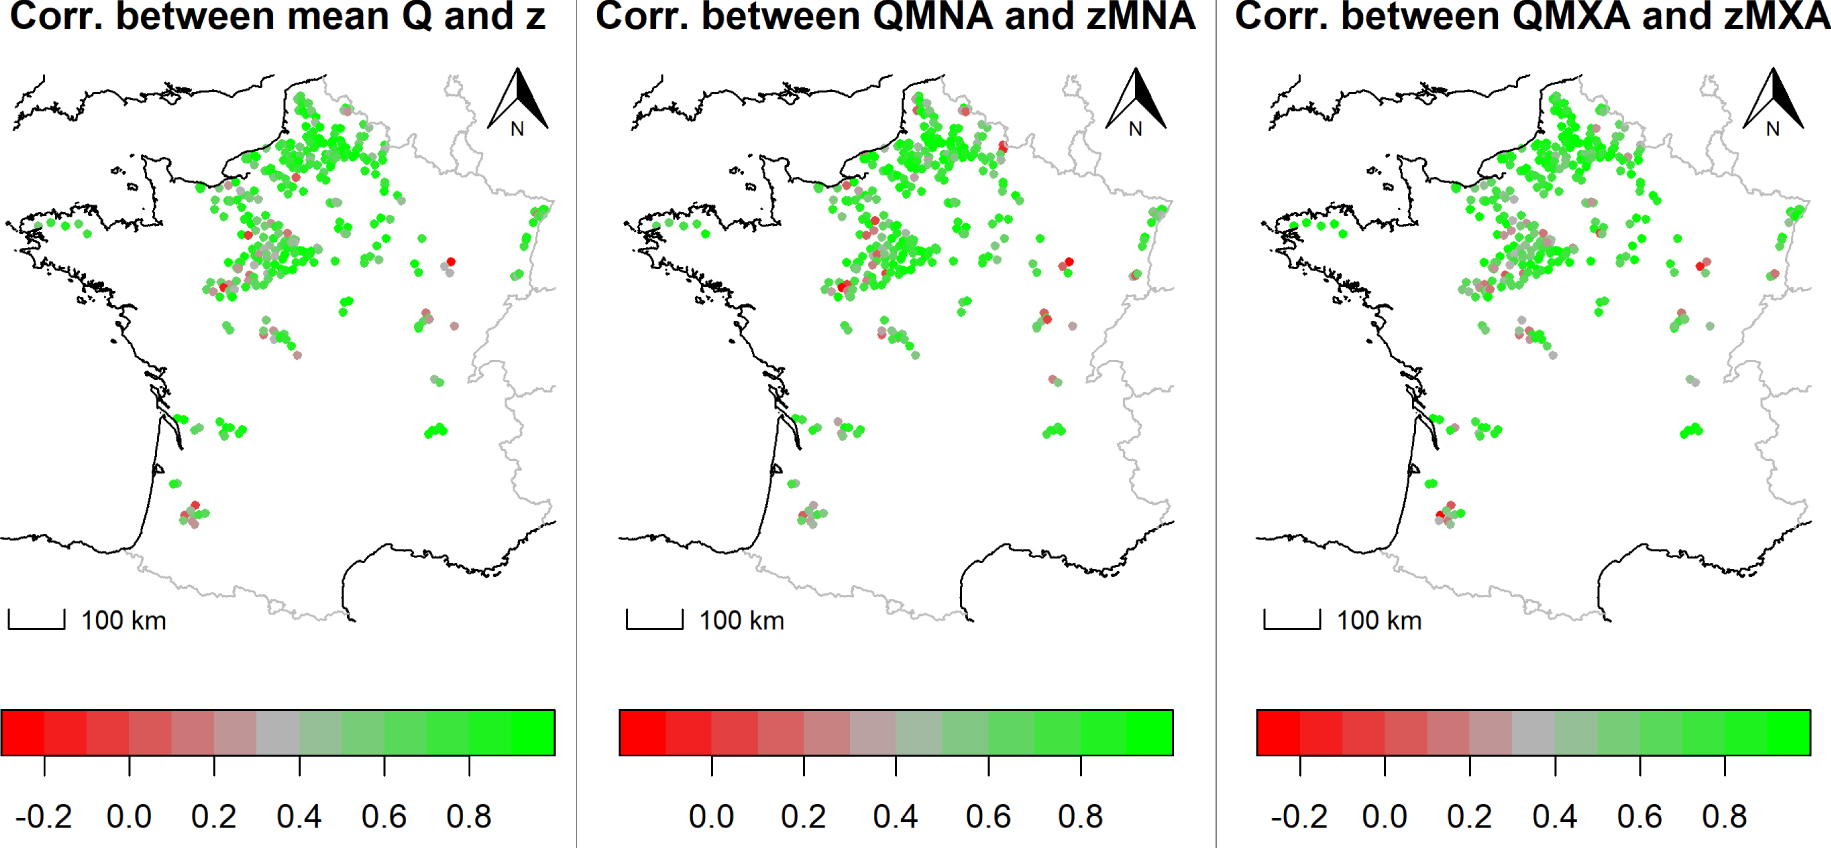
The geographical distribution of results can be seen in Figure 3. It appears that most of the correlation values are high, above 0.7. The correlation between mean streamflow and mean groundwater level is, in most cases, slightly higher than the extrema correlations. Several regions host the lowest values: in the western part of the Paris basin, several points show non-significant negative correlations for means and droughts, but not for floods. Low values can be also observed in the Saone basin, in the upper Meuse catchment and in the Aquitaine basin. All these regions present a large variability in the correlation between points, which is caused by the overlap of several aquifers monitored by different piezometers: this highlights the necessity of taking into account the geological context and the various properties of the aquifers present in the catchment. In other words, the geographical distribution of the results does not highlight any clear regionally variable trend that could be extended to other neighbouring piezometers or catchments.
This is why the analysis of the geologically homogeneous groups, shown in Figure 4, appears to be more relevant to reaching a more general conclusion. First, the ensemble distribution depicted in grey on the top of the plot shows that the correlation distributions are wide and similar for the three indicators. More than three out of four catchment/piezometer pairs have a correlation above 0.5, with a median of approx. 0.75, while several values below 0 are observed for each indicator distribution. The 14 groups can be classified according to the typology below, in line with their correlation distribution: high if most values are above 0.8; low if most values are under 0.6; uncertain if the distribution is in-between or too wide to fit into these categories.
Resulting correlations arranged according to geological and regional group of piezometers. Colours correspond to those used in Figure 1. The grey dashed vertical line represents the median of the ensemble, visible in the gathered group on the top.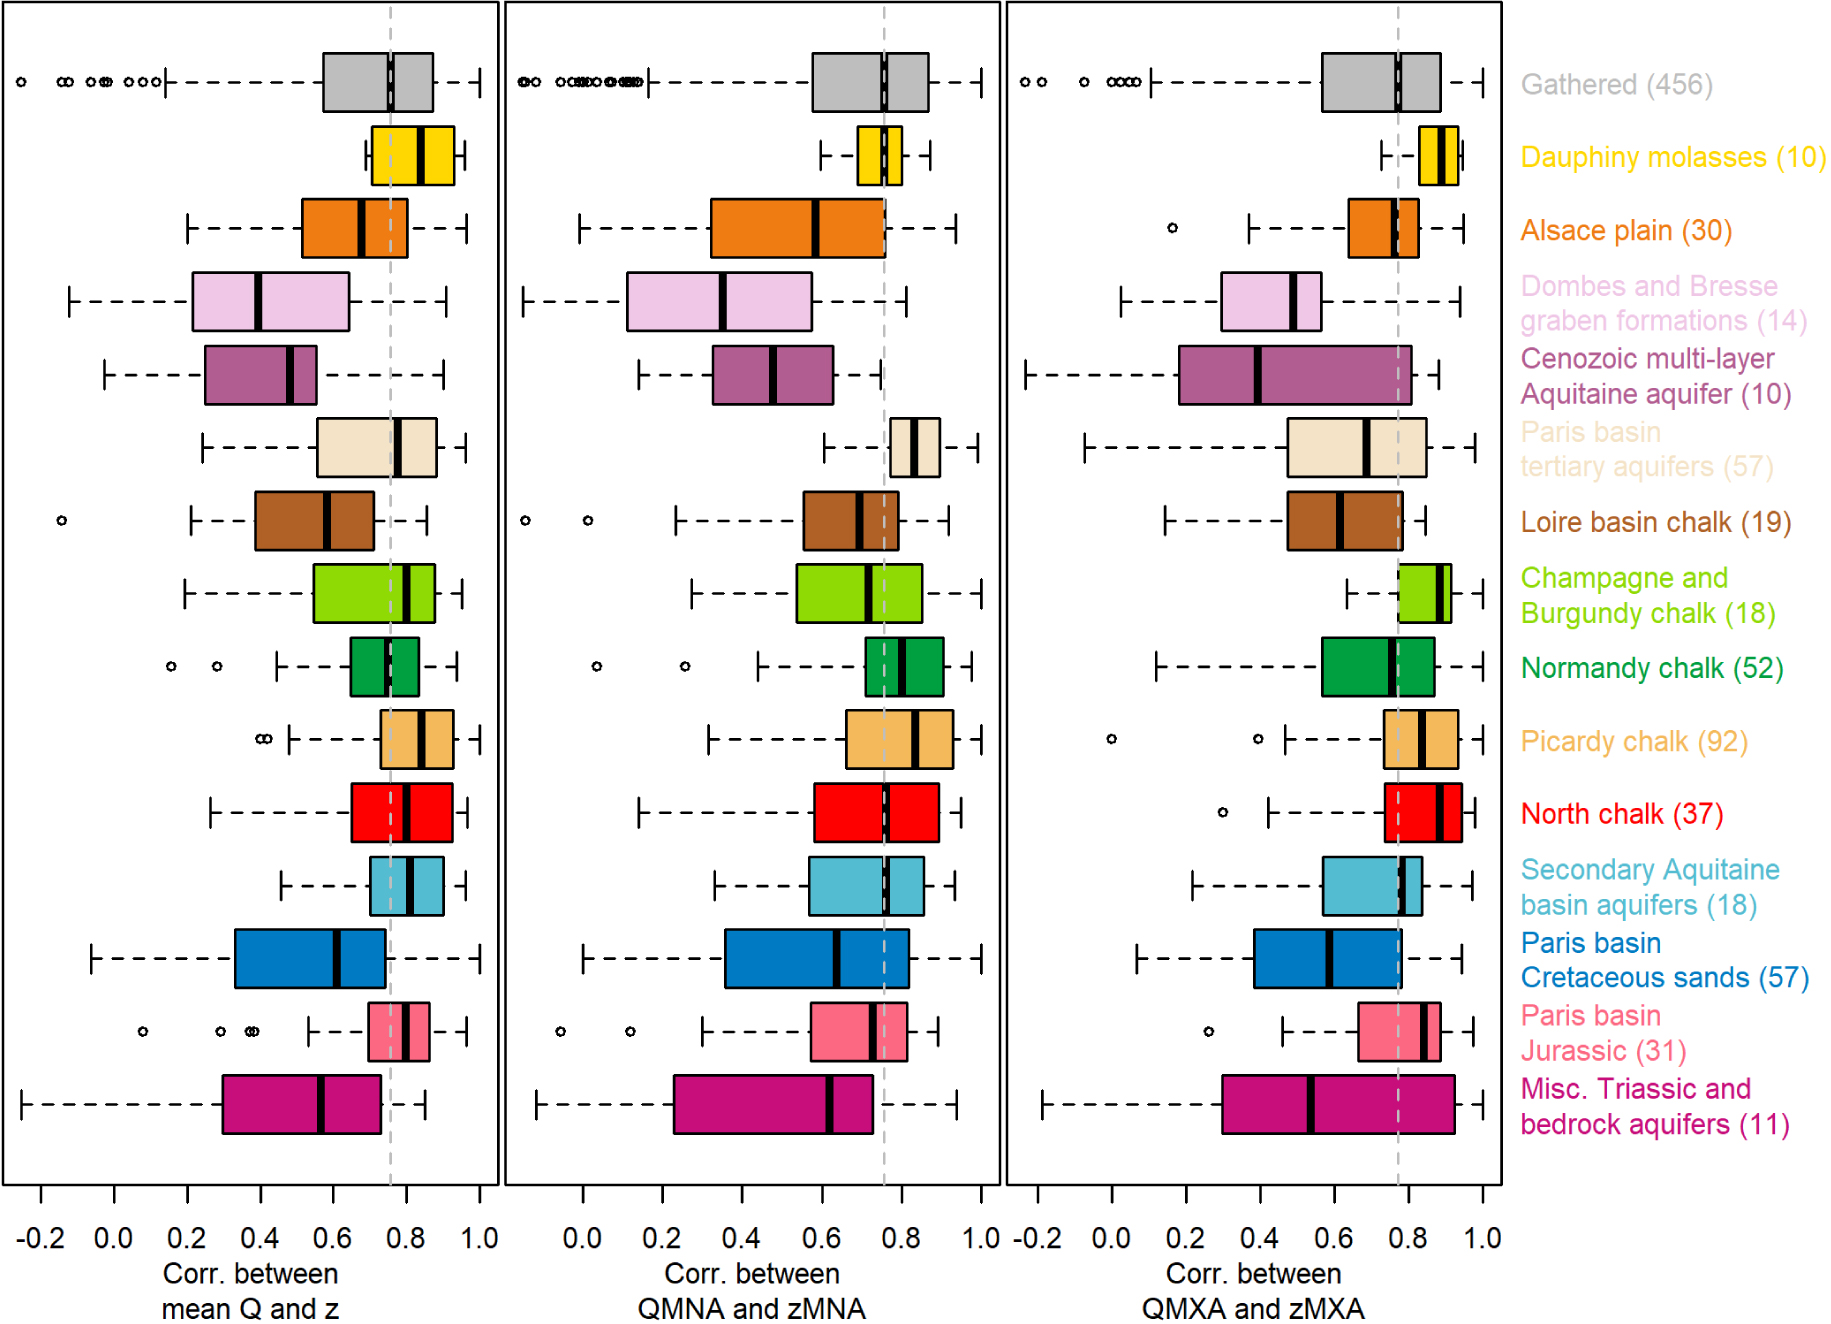
Groups with high correlations for droughts and floods: Dauphiny molasses and Picardy chalk;
Groups with high correlations for floods and uncertain behaviour for droughts: Alsace plain, Champagne and Burgundy chalk, North chalk, Paris basin Jurassic;
Groups with high correlations for droughts and uncertain behaviour for floods: Paris basin tertiary aquifers, Normandy chalk, Secondary Aquitaine basin aquifers;
Group with low correlations for droughts and floods: Dombes and Bresse graben gravels;
Groups with uncertain behaviour for both floods and droughts: Paris basin Cretaceous sands, Triassic and bedrock aquifers, Cenozoic multi-layer Aquitaine aquifer, Loire basin chalk.
These group results can be linked to certain already known properties of aquifers. In particular, the large Paris basin chalk aquifer is known to be far from homogeneous for its permeability or karstification [Roux and Martin 2006]: the group analysis highlights this diversity with very different behaviours between the Loire basin and Picardy, for instance. Most of the Dombes and Bresse graben gravels are often covered by less permeable formations, such as silts—see the cartography in Brugeron et al. [2018]—which limits their interactions with rivers, especially in small catchments like the ones studied in the database. The Dauphiny molasses aquifer has an exceptionally high permeability [Dubar et al. 1994], which makes it reach the highest correlation values of the groups studied. The Paris basin Jurassic aquifers are mostly karstified in their outcropping areas [Nicod 1995], with a quick response to flood events and little ability to store water and support low flows, which explains their better correlation with floods. The Beauce aquifer, which represents the majority of points in the Paris basin tertiary group, has a known role in supporting low flows [Monteil 2011], which explains the exceptionally high correlation observed for drought indicators, but a more ambiguous role for floods, with a broader distribution correlation for QMXA and zMXA.
Despite being based on the aquifer division and categorisation in the BDLISA database [Brugeron et al. 2018], the group classification used in the present study is imperfect, since the group choice was influenced by data availability. It is clear that groups with a too-wide diversity of geological contexts, such as the two Aquitaine basin groups or the miscellaneous Triassic and bedrock aquifers, have the widest distributions of correlation values. No clear trend can be highlighted for these groups, while for more homogeneous ones—such as the regional chalk groups—less equivocal conclusions can be drawn. Data availability also has an influence on the correlation values: even though the dataset creation criterion of 10 years of contemporaneous data between streamflow and groundwater level, cited in Section 2, avoids computing correlations on a too-small number of points, higher values of Spearman correlations are more likely to be reached on 10 points than on longer time series. But this does not seem to be a systematic bias in our analysis, since regions that have been monitored for a long time—Beauce, Burgundy chalk—reach higher correlation values than regions for which data are scarcer—such as the Aquitaine basin or the Bresse graben.
To study its spatial variations, we assumed the river–aquifer relationship to be constant through time. However, this connection is also dependent on local contexts, such as the nature of the river streambed and the related hydrodynamical parameters [Baratelli et al. 2016]. Even though we deal with relatively small time extents—in the majority of cases, correlations are computed on less than 20 years—a particular flood or drought event can modify the riverbed properties and, therefore, have an influence on the river–aquifer relationship. The present results can be considered valid as long as no exceptional morphogenic event, likely to break the stationarity hypothesis, is observed in the catchment.
5. Conclusion
In this article, we used a national database of streamflow and groundwater level data to assess the relationship between these two physical quantities, through a correlation study between yearly extrema indicators. Results show that in most cases, the intensity of groundwater level events is well correlated with the magnitude of droughts and floods, with large spatial heterogeneity. Subgroup analysis according to the geological context shows clearer patterns: some regional-scale aquifers have a univocal response to both low-flow and high-flow events, while others respond only to one type of event, and some do not seem to follow a trajectory that can be linked to streamflow events.
Although it is very simple, without any modelling hypothesis, the analysis provides indications as to whether groundwater level data are likely to add useful information to a hydrological model, using a relatively small number of data. Indeed, the implementation of a coupled river/groundwater modelling is generally a complex and substantial task and this kind of prior analysis helps in assessing the relevance of such an establishment for operational modelling purposes, such as flood and drought forecasting. For instance, the remarkable correlation between low groundwater levels and hydrological drought events in the Beauce region and its tertiary aquifer shows the necessity of including in a model the underground component of the water cycle—see, e.g. Flipo et al. [2012] for an example of coupled modelling. Another interesting case is the chalk aquifer, because of the spatial variability of its behaviour—it was identified as the main habitat of hydrological monsters [Le Moine and Andréassian 2008], i.e. catchments in which streamflow is particularly difficult to simulate and forecast for hydrological models. The chalk area may also benefit from modelling approaches using groundwater level information, but not in all regions. It is also noteworthy that several aquifers, despite being of major importance for regional water resources, exhibit equivocal relationships with surface water—for instance Cenomanian Perche sands and Vosges Triassic sandstones.
The database and data gathering represents the largest part of the present work and we intend to share it as openly as possible to facilitate more thorough analyses. In particular, the correlation computation of yearly indicators hides the lag between groundwater level and streamflow extrema. Preliminary results that are not detailed here show that most piezometers are late with respect to streamflow, i.e. droughts and floods happen before low and high groundwater levels. The database may also be used to conduct a large sample evaluation of groundwater/river coupled modelling approaches, in order to develop generalisable tools for operational hydrological simulations and forecasts. As a final recommendation, we encourage the development of long-term and high-frequency groundwater level measurements in gauged catchments, for surface hydrologists to be able to conduct thorough coupled modelling studies.
Conflicts of interest
The authors declare no competing financial interest.
Dedication
The manuscript was written through contributions of all authors. All authors have given approval to the final version of the manuscript.
Acknowledgments
This work is part of the CIPRHES project, funded by the French national research agency ANR (grant #ANR-20-CE04-0009), and a PhD funded by the French Ministry of Environmental Transition (MTE). We would like to thank Delphine Allier (BRGM) for the help in selecting the test dataset and Jean-Baptise Boissonnat (INRAE Antony) and BenoÃőt Génot (INRAE Antony, now at U.R.B.S.) for the database maintenance. We extend our warmest thanks to Dr. Léonard Santos (INRAE Antony) and Dr. Paul Royer-Gaspard for their careful proofreading that considerably improved the article. Last but not least, maps could not have been produced without the precious expertise of Olivier Delaigue (INRAE Antony).