


 CC-BY 4.0
1. Introduction
At the relatively oxidised redox conditions of present day Earth’s upper mantle [e.g., Frost and McCammon 2008; Stagno et al. 2013], the magmatic gas phase delivered to the atmosphere by shallow degassing, mantle-sourced magmas is dominated by oxidised molecular combinations of the elements H, C, O and S, e.g., by water (H2O) carbon dioxide (CO2) and sulphur dioxide (SO2) [e.g., Gerlach and Nordlie 1975; Symonds et al. 1994; Giggenbach 1996; Fischer and Chiodini 2015]. However, volcanoes also release a variety of reduced gas species such as molecular hydrogen (H2) and hydrogen sulphide (H2S) that, while making up a relatively small fraction of the magmatic gas phase, convey information on a variety of magma-related topics and processes [e.g., Moussallam et al. 2019a; Moretti and Stefánsson 2020]. For example, studying the release of H2, H2S and other reduced gas species (e.g., carbon monoxide, CO) from modern subaerial volcanoes helps setting constraints on the composition of the early atmosphere in the Hadean and the Archean [e.g., Kasting et al. 1993; Gaillard et al. 2015], and to predict the temporal evolution and progressive oxygenation of the atmosphere through geological time [e.g., Holland 2002; Gaillard et al. 2011; Gaillard and Scaillet 2014]. Measuring H2 and H2S in combination with their oxidised complements H2O and SO2 brings information on the redox conditions of magmatic gases [e.g., Ellis 1957; Matsuo 1962; Gerlach 1979, 1982, 1993a, b; Shinohara et al. 1993; Ohba et al. 1994; Symonds et al. 1994; Burgisser and Scaillet 2007; Oppenheimer et al. 2018; Moussallam et al. 2019a, 2022], and can potentially allow constraining oxygen fugacity of the source magmas. H2 and H2S in volcanic gases can also effectively contribute to volcano monitoring [e.g., Kern et al. 2022]. For example, H2S is a key component of the hydrothermal gases released by quiescent, closed-conduit volcanoes [e.g., Giggenbach 1980], so that monitoring the H2S/SO2 ratio is critical to detecting (and interpreting) the magmatic unrest that proceeds volcanic activity resumption [e.g., Surono et al. 2012; Moussallam et al. 2014b; Stix and de Moor 2018; de Moor et al. 2019], and to distinguish internally triggered (volcano-related) gas changes from those caused by external factors (e.g., rainfall and/or water level changes) [Moretti et al. 2020; Moune et al. 2022]. A model for estimating magmatic variables (temperature and redox) from the combined analysis of H2S/SO2 and H2/H2O ratios in volcanic plumes has recently been proposed that promises to become a useful volcano monitoring tool [Moussallam et al. 2022]. Volcano-released H2 and H2S are dispersed into the atmosphere through volcanic plumes, where concentrations at ppm levels are typically observed, well in excess of those typical of ambient air [of respectively ∼0.5 ppm and ∼0.1–0.3 ppb; Seinfeld and Pandis 2016]. Such in-plume H2 and H2S measurements [e.g., Aiuppa et al. 2005, 2011] are useful to interpreting reaction mechanisms and rates, and ultimately lifetime of reduced compounds, during oxidative atmospheric processing, both near-vent [e.g., Martin et al. 2006; Roberts et al. 2019] and in the colder, more distal plumes [e.g., Aiuppa et al. 2007]. Although observations indicate H2 and H2S are conserved during atmospheric dispersion over short timescales (seconds to days) [e.g., Aiuppa et al. 2007, 2011], these species are ultimately oxidised directly (by molecular oxygen, O2) or indirectly (via O2-derived radicals, such as hydroxyl radicals) during longer atmospheric transit, thus controlling the reducing power (e.g., the ability to act as atmospheric O2 sinks) of volcanic gases [e.g., Stolper et al. 2021].
Despite their importance in such a variety of subjects, and notwithstanding that excellent reviews are available on magmatic and hydrothermal gases in general [e.g., Giggenbach 1980, 1996; Symonds et al. 1994; Chiodini and Marini 1998; Fischer and Chiodini 2015; Henley and Fischer 2021], no specific study has so far been devoted to reviewing abundance and source mechanisms of H2 and H2S in volcanic gases. Also, estimates of global H2 and H2S fluxes from subaerial volcanism remain subject to large uncertainties, owing to the sparse and limited dataset existing. For example, although natural (geogenic) H2 emissions have received increasing attention recently [e.g., Zgonnik 2020], with Earth degassing being though to sustain a cumulative global H2 flux of 6 [Gilat and Vol 2012] to 23 [Zgonnik 2020] Tg/yr, there are only two studies in the literature that specifically address the quantification of volcanic H2 emissions from two persistent active volcanoes [Etna in Sicily, ∼0.00065 Tg/yr; Aiuppa et al. 2011; and Erebus in Antarctica, ∼0.001 Tg/yr; Moussallam et al. 2012]. As such, current inventories of volcanic H2 fluxes to the atmosphere [0.2 to 0.7 Tg/yr; Warneck 1988; Canfield et al. 2006; Stolper et al. 2021] are subject to large uncertainties. Likewise, the volcanogenic contribution to the global natural H2S flux (∼7.7 Tg/yr) is similarly poorly understood, with most estimates converging at ∼1 Tg/yr [see review by Watts 2000] but with total range being as large as 1 to 37 Tg/yr [Halmer et al. 2002].
Here, we review our current understanding of the processes that govern H2 and H2S abundance in volcanic gases. To this aim, we present an updated volcanic gas composition catalogue that we have put together from available literature information. We also use this catalogue, in combination with recently improved global volcanic SO2 and CO2 fluxes [Carn et al. 2017; Aiuppa et al. 2019; Fischer et al. 2019], to present an improved quantification of global volcanic H2 and H2S fluxes.
2. Dataset
We compiled a dataset of 747 gas analyses by complementing recent [Aiuppa 2015; Aiuppa et al. 2017; Moussallam et al. 2019a, 2022] and older [Symonds et al. 1994; Giggenbach 1997] volcanic gas catalogues with newly published gas results. This dataset is not exhaustive, e.g., it is not meant to cover the entire mass of information present in the geological literature. Yet, we are confident our dataset is well representative of the compositional range of volcanic gases globally (see below).
The full dataset is available as Supplementary Tables 1 and 2. The dataset includes data for both high temperature (T > 600 °C; Supplementary Table 1) magmatic gases and for lower temperature (T⩽600 °C; Supplementary Table 2) mixed (magmatic–hydrothermal) fluids. The 600 °C threshold, although somewhat arbitrary, is justified by the statistical distribution of the global volcanic arc gas population [Aiuppa et al. 2017], and is consistent with the threshold used in similar recent studies [Moussallam et al. 2019a, 2022]. Some hydrothermal (temperature close to boiling) gas samples are also used but are limited to those volcanoes that have recently erupted and/or that have detectable SO2—this latter gas is typically absent in hydrothermal fluids “strictu sensu”, that are covered by other reviews [e.g., Giggenbach 1980, 1987; Chiodini and Marini 1998; Fischer and Chiodini 2015; Stix and de Moor 2018]. The dataset is further categorised depending on tectonic setting in arc and non-arc volcanic gases, the latter including gases released by intraplate and continental rift volcanism [Aiuppa et al. 2021]. The Etna magmatic gases are plotted separately in view of the relatively enigmatic nature of volcanism at this specific locality.
The dataset combines compositional data for both fumaroles (Sample type “F” in Supplementary Tables 1 and 2) and for atmospheric gas plumes (Sample type “PL” in Supplementary Tables 1 and 2). We refer to the original studies (data sources in Supplementary Tables 1 and 2) for details on sampling and analytical procedures. Broadly speaking however, fumarole data (F) have been obtained by direct sampling (Sample Methodology “DS” in Supplementary Tables 1 and 2) [Symonds et al. 1994], in which fumarolic effluents are captured in-pre-evacuated gas flasks partially filled with a reactive solution [a NaOH solution in most applications; Giggenbach 1996]. Incondensable gases (like H2) are concentrated in the head space (later analysed in the lab. via Gas Chromatography), while condensable gases (such as H2S) trapped by the solution are analysed by wet chemistry methods (typically by ion chromatography). Uncertainty in DS-derived gas concentrations is typically low (<5% in most studies). Plume results (PL) are based on in-situ, near real-time gas concentration measurements with the Multi-GAS (Sample Methodology “MG” in Supplementary Tables 1 and 2), a widely used multi-sensor unit that analyses H2 and H2S (among other species) with specific electrochemical sensors [Aiuppa et al. 2005; Shinohara 2005]. In such a case, the Multi-GAS measured in-plume concentrations have been converted in air-free gas concentrations listed in Supplementary Tables 1 and 2. Typical associated uncertainty is ⩽15–20%.
It is important to remind that, where available, magmatic gas compositions are reported in the form of “restored” magmatic gas compositions at equilibrium temperature (identified by Sample type “F, R” in Supplementary Table 1). These restored gas compositions have been extracted mostly from Symonds et al. [1994], and have been obtained by the authors by applying (to measured fumarolic gas compositions) the procedure introduced by Gerlach [1993a]. This numerical procedure (i) identifies the causes of disequilibrium in volcanic gases (often due to sampling/conservation artefacts; e.g., air addition and oxidation), and (ii) iteratively removes the cause(s) of disequilibrium until an restored equilibrium gas (at a given equilibrium temperature) is obtained [Gerlach 1993a; Symonds et al. 1994].
Our dataset, illustrated in a H2O/10–CO2–5⋅ST space (where ST is total sulphur, or SO2 + H2S) (Figure 1), demonstrates the large heterogeneity of volcanic gas compositions found in previous inventories [e.g., Symonds et al. 1994; Aiuppa 2015], and represents well the well-established [e.g., Symonds et al. 1994; Gerlach 1982] chemical diversity between arc and within-plate/rift magmatic gases, with the former being typically more hydrous [e.g., Fischer 2008; Taran and Zelenski 2015] and the latter extremely variable in terms of their CO2/ST signatures [e.g., Aiuppa et al. 2021]. The two magmatic gas populations exhibit some overlap, as previously found [e.g., Aiuppa 2015]. The lower temperature (T⩽600 °C) mixed gases are even more compositionally heterogeneous (Figure 1), and while many gas samples overlap with the magmatic gas range, many others plot in the CO2-rich, S-poor compositional domain (top left portion of Figure 1), indicating some extent of sulphur loss [scrubbing; Symonds et al. 2001] during gas–water–rock hydrothermal interactions in the subsurface [e.g., Aiuppa et al. 2017].
Triangular plots illustrating the compositional variability in the gas catalogue used (data from Supplementary Tables 1 and 2).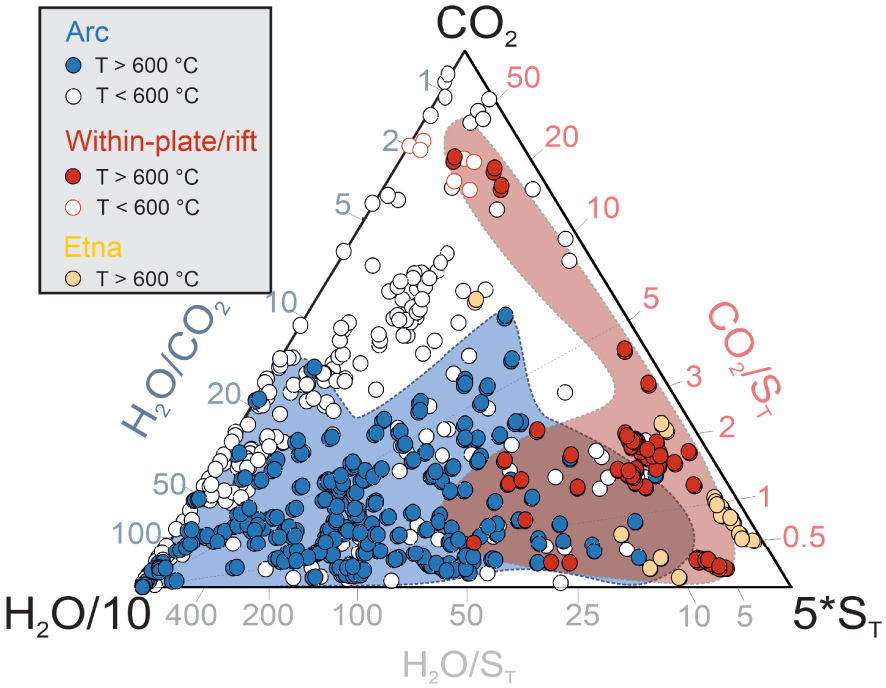
3. Results
3.1. Hydrogen and hydrogen sulphide abundances in volcanic gases
H2 and H2S are usually minor (<1 mol%) to trace (<0.1 mol%) components of volcanic gases [e.g., Giggenbach 1996], although H2 concentrations exceeding 10 mol% have occasionally also been reported [see review of Zgonnik 2020] and H2S becomes increasingly important (e.g., a major species, >1 mol%) in low temperature hydrothermal steam samples [e.g., Giggenbach 1980, 1997].
In our volcanic gas catalogue, H2 and H2S concentrations span several orders of magnitude, from ultra-trace (<10−6 mol%) to major (>1 mol%) levels (Supplementary Tables 1 and 2). In Figures 2a and b, the whole H2 and H2S concentration dataset (in mol%) is illustrated as a function of measured gas outlet temperature.
Scatter plots illustrating the dependence of (a) H2 and (b) H2S concentrations on measured discharge temperature (data from Supplementary Tables 1 and 2). Symbols as in Figure 1. In this and following figures, error bars are not shown as smaller than the data symbols.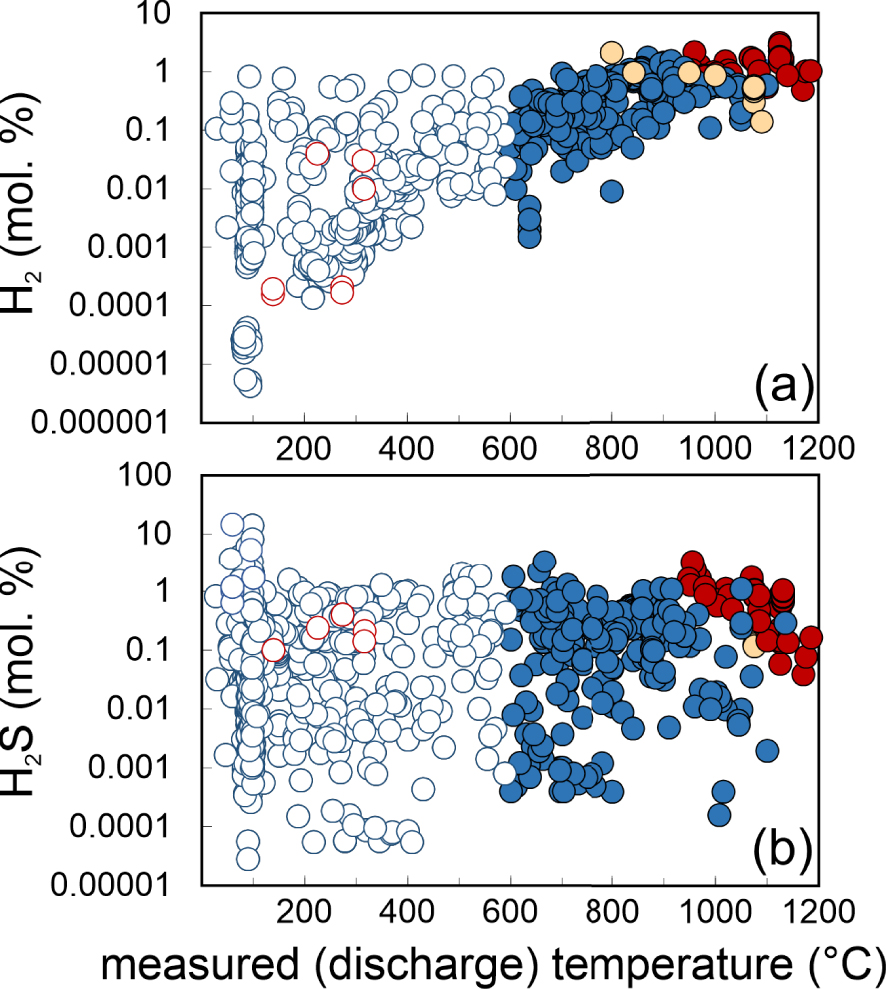
Figure 2a shows that volcanic gas H2 concentrations exhibit a marked temperature dependence, particularly at T > 600 °C. H2 concentrations are the highest (0.49–3.1% levels) in the hot (T > 1000 °C) magmatic gases [Gerlach 1979, 1980, 1982, 1993a, b; Symonds et al. 1994] from within-plate (e.g., Kilauea) and continental rift (e.g., Nyiragongo, Erta Ale) volcanoes. In arc magmatic gases, H2 concentrations decrease with decreasing temperature, from 0.1–1.7 mol% at 800–1100 °C to 0.002–0.38 mol% at ∼600 °C. Etna’s magmatic gases plot at the boundary between arc and non-arc gases (H2 range: 0.14–2.1 mol%). The temperature dependence is more scattered in mixed (magmatic–hydrothermal) gases, in which H2 varies from as low as 4 × 10⁻⁶ mol% to as high as 0.867 mol%. Close-to-boiling fumaroles (T < 100 °C) are especially diverse in their H2 contents that span more than 5 orders of magnitude.
H2S concentrations show no obvious temperature dependence in the global volcanic gas catalogue (Figure 2b). The H2S-richest samples are again found in the “restored” magmatic gas analyses from within-plate and continental rift volcanoes (H2S range: 0.04–3.2 mol%; mean 0.9 ± 0.55 mol%). The range of H2S concentrations in arc magmatic gases is vast, from 0.00016 to 3.3 mol%. The mean arc gas H2S concentration (0.25 ± 0.55 mol%) is lower than for non-arc volcanic gases (0.9 ± 0.55 mol%), but given the large spread of values the two populations are essentially overlapping. Colder (T⩽600 °C) magmatic–hydrothermal gases exhibit an even larger range of values, including the lowest (0.000028 mol%) and highest (14 mol%) values of the entire dataset. As for arc magmatic gases, no obvious pattern with temperature is observed (Figure 2a).
4. Discussion
4.1. Ratios between redox couples
A standard practise used when interpreting volcanic gas H2 and H2S concentrations is to normalise them to their oxidised counterparts H2O and SO2 [Gerlach 1980; Giggenbach 1996, 1987]. This practise developed on since early demonstrations [Ellis 1957; Matsuo 1962] that high temperature volcanic gases approach a state of thermodynamic equilibrium, in which ratios between redox couples are controlled by equilibria:
| (1) |
| (2) |
However, as demonstrated in later work by Giggenbach [1987, 1996], the full equilibrium assumption is unlikely to hold in lower temperature gas samples, where different extents of re-equilibrations of the different redox couples (e.g., reactions (1) and (2)), as well as admixing with external (meteoric, atmospheric) fluids [Taran and Zelenski 2015] and reaction with wall-rocks [Henley and Seward 2018; Henley and Fischer 2021], become likely eventualities. In such conditions, a conservative approach is to deal with specific redox reactions individually, e.g., to use plots that compare, for each specific redox couple, the analytically determined and equilibrium ratios. This approach, initially elaborated by Giggenbach [1987, 1996] and Chiodini et al. [1993], is followed below, where we update their results and corroborate their conclusions using the more complete, today available gas catalogue (Supplementary Tables 1 and 2).
At discharge conditions (P = 1 bar), and at equilibrium, reactions (1) and (2) imply that ratios between redox couples will exhibit the following dependences on redox (as expressed by oxygen fugacity, fO2) and temperature (in K):
| (3) |
| (4) |
The presence of redox sensitive elements in either the silicate melt/rock matrix (where iron is typically available in both +2 and +3 valence states) or in the gas phase (where sulphur is present in sufficient amounts in both −2 and +4 valence states) has long been proposed [e.g., Giggenbach 1987; Gerlach 1993a] to act as a buffer for oxygen fugacity in volcanic gases [see Moretti and Stefánsson 2020; Moretti 2021; Moretti and Neuville 2021, for examples of recent reviews]. Gerlach [1993a, b] proposed that gas speciation in high temperature (>900 °C) magmatic gases is buffered by equilibrium redox exchange between gas and coexisting silicate melt. The same buffers can also operate at sub-solidus conditions, e.g., if gas reacts and equilibrates with the host rock matrix in which iron is present in minerals with two distinct oxidation states [e.g., Giggenbach 1987]. It was however found that, in such lower temperature conditions, the buffering role of sulphur in the gas phase (where H2S and SO2 are simultaneously present) becomes increasingly effective [e.g., Giggenbach 1987, 1996], although the competing roles of homogeneous (gas-only) and heterogenous (gas–mineral) reactions in controlling the volcanic gas redox budget remained debated [e.g., Henley and Fischer 2021] (see below).
Irrespective of the buffering medium (either melt, rock, or gas), fO2 in (3) and (4) can conveniently be replaced by the temperature dependences imposed by the redox buffers [e.g., Eugster 1977; Frost 1991, see recent reviews by Cicconi et al. [2020], Moretti and Neuville [2021]]. The predicted (3), mineral-buffered or gas-(H2S/SO2) buffered, H2/H2O ratios are graphically illustrated in Figure 3a. The same mineral buffered SO2/H2S ratios are illustrated in Figure 3b. These model trends implicate that, in mineral-buffered conditions (e.g., when gas redox is buffered by heterogeneous redox budget exchanges with either the melt or the host rocks), H2 is expected to become increasingly abundant (relative to H2O), and H2S increasingly depleted (relative to SO2), with increasing temperature (Figure 3). At fixed temperature, H2/H2O ratios are expected to decrease (and SO2/H2S to increase) as redox evolves from more reducing (e.g., redox buffered at the Fayalite–Magnetite–Quartz (FMQ) mineral buffer) to more oxidised (as expressed by the hematite–magnetite (HM) mineral buffer) conditions. Results of a comparison between modelled and measured (volcanic gases) ratios are summarised below (Figure 3).
Temperature dependence of (a) H2/H2O and (b) SO2/H2S molar ratios in our volcanic gas catalogue (data from Supplementary Tables 1 and 2). Symbols as in Figure 1. The thick coloured lines are the predicted temperature dependences of the ratios imposed (at 1 bar) by the most common mineral and gas buffers. These are obtained by using Equations (3) and (4) and oxygen fugacity buffered by either the melt/rock matrix or sulphur species in the gas phase. The mineral buffer [see Frost 1991, for the relevant fO2–T relationships] curves illustrated are: HM: Hematite–Magnetite; NNO: Nickel–Nickel Oxide; FMQ: Fayalite–Magnetite–Quartz; GB: FeO–FeO1.5 buffer [Giggenbach 1987]. The dashed line in (a) labelled H2S/SO2 corresponds to the sulphur gas buffer of Giggenbach [1987], and is obtained by solving Equation (6) (at 1 bar) assuming equimolar amounts of H2S and SO2 (H2S/SO2 = 1) (a similar line at fixed H2S/SO2 of 0.1 is also shown in panel (b)). The DP line is for gas ratios predicted using the empirically derived fO2 versus temperature dependence typical of hydrothermal systems [e.g., D’Amore and Panichi 1980]. Thin light blue curves labelled H&F are the gas ratios predicted by the gas–mineral reactions of Henley and Fischer [2021] (the model runs illustrated in their original Figure 5 are shown). The majority of the mixed (magmatic–hydrothermal; T < 600 °C) gases plot in panel (a) along a compositional array (grey dashed area) that overlaps with both (i) the H2S/SO2 buffer lines, and (ii) the heterogenous (gas–mineral) equilibria of Henley and Fischer [2021]. Many gas samples have higher H2/H2O ratio compositions than predicted by either homogenous [Giggenbach 1987] or heterogeneous [Henley and Fischer 2021] reactions, likely indication preservation (quenching) of higher-T equilibria. High-T magmatic gases plot in between the NNO and FMQ mineral buffers, suggesting buffering from source silicate melt. See text for discussion.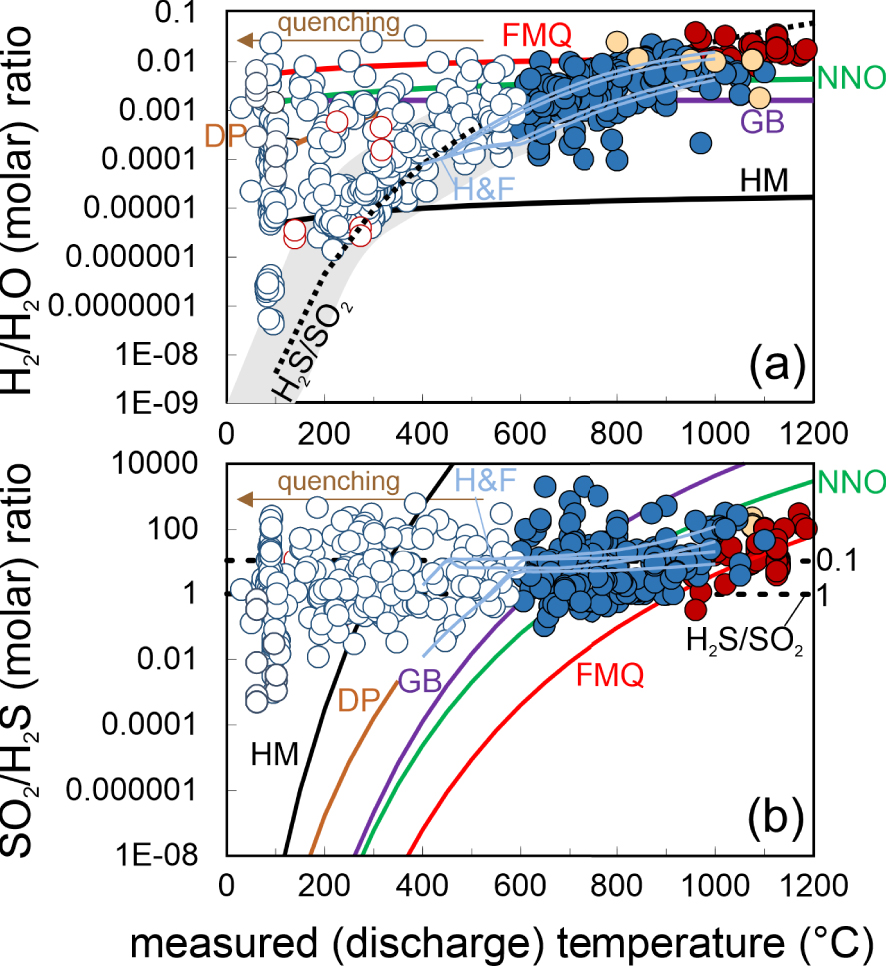
4.1.1. High-temperature magmatic gases
The measured volcanic gas H2/H2O ratios, as derived from the analytically determined gas concentrations, are illustrated in Figure 3a (and listed Supplementary Tables 1 and 2). Comparison with modelled compositions (see above) shows that the hot (T > 900 °C) non-arc magmatic gases [Gerlach 1980, 1993b; Symonds et al. 1994] have “restored” gas compositions that convert into H2/H2O (and SO2/H2S ratios; see Figure 3b) overlapping those predicted at equilibrium (3) and (4) in a melt-buffered gas system at ∼FMQ, see Figures 3 and 4. As previously found [Gerlach 1980, 1993a, b] therefore, the H2 and H2S contents of such gases appear to be controlled by heterogeneous (melt–gas) redox exchanges. High temperature (T > 900 °C) arc magmatic gases likewise approach the melt-buffered model lines, but the majority of them plot at lower H2/H2O (and higher SO2/H2S) ratios relative to non-arc magmatic gases, close to the NNO (Nickel–Nickel-Oxide) mineral buffer model line (Figure 3). This apparent more oxidised (lower H2/H2O ratios) signature of arc gases is also well represented in Figure 4, and we will return to this point in later sections (cf. Section 4.3).
(a) Scatter plot of SO2/H2S versus H2/H2O molar ratios in our volcanic gas catalogue (data from Supplementary Tables 1 and 2). Symbols as in Figure 1. The thick coloured lines are the predicted gas molar ratios (from Equations (3) and (4)) for fO2s calculated using the temperature dependences imposed by the FMQ, NNO, GB and HM mineral buffers (calculations are run over a range of temperatures, as expressed by the isotherms: dashed lines, in °C). The DP line is derived by using (for fO2 in Equations (3) and (4)) the empirical fO2 versus T dependence in hydrothermal systems [D’Amore and Panichi 1980]; thin light blue curves labelled H&F are the gas ratios predicted by the gas–mineral reactions of Henley and Fischer [2021] (the model runs illustrated in their original Figure 5 are shown). (b) An expanded version of (a) illustrating the nominally SO2-free field of hydrothermal steam samples (in the 100–350 °C temperature range). The magmatic to mixed (magmatic–hydrothermal) samples in our catalogue, having detectable SO2, plot to the right of the hydrothermal field. Their SO2/H2S versus H2/H2O population is well reproduced by both homogenous [gas-phase only; dashed black lines; Giggenbach 1987] or heterogeneous [Henley and Fischer 2021] reactions. However, the H&F models predict progressively decreasing SO2/H2S ratios at increasing mineral–gas reactions (and with decreasing temperatures), while the majority of the gas samples define a vertical array that is more consistent with gas oxidations (e.g., decreasing H2/H2O ratios) during closed-system gas cooling in a S gas-buffered regime [dashed vertical back line, the H2S/SO2 gas buffer of Giggenbach 1987].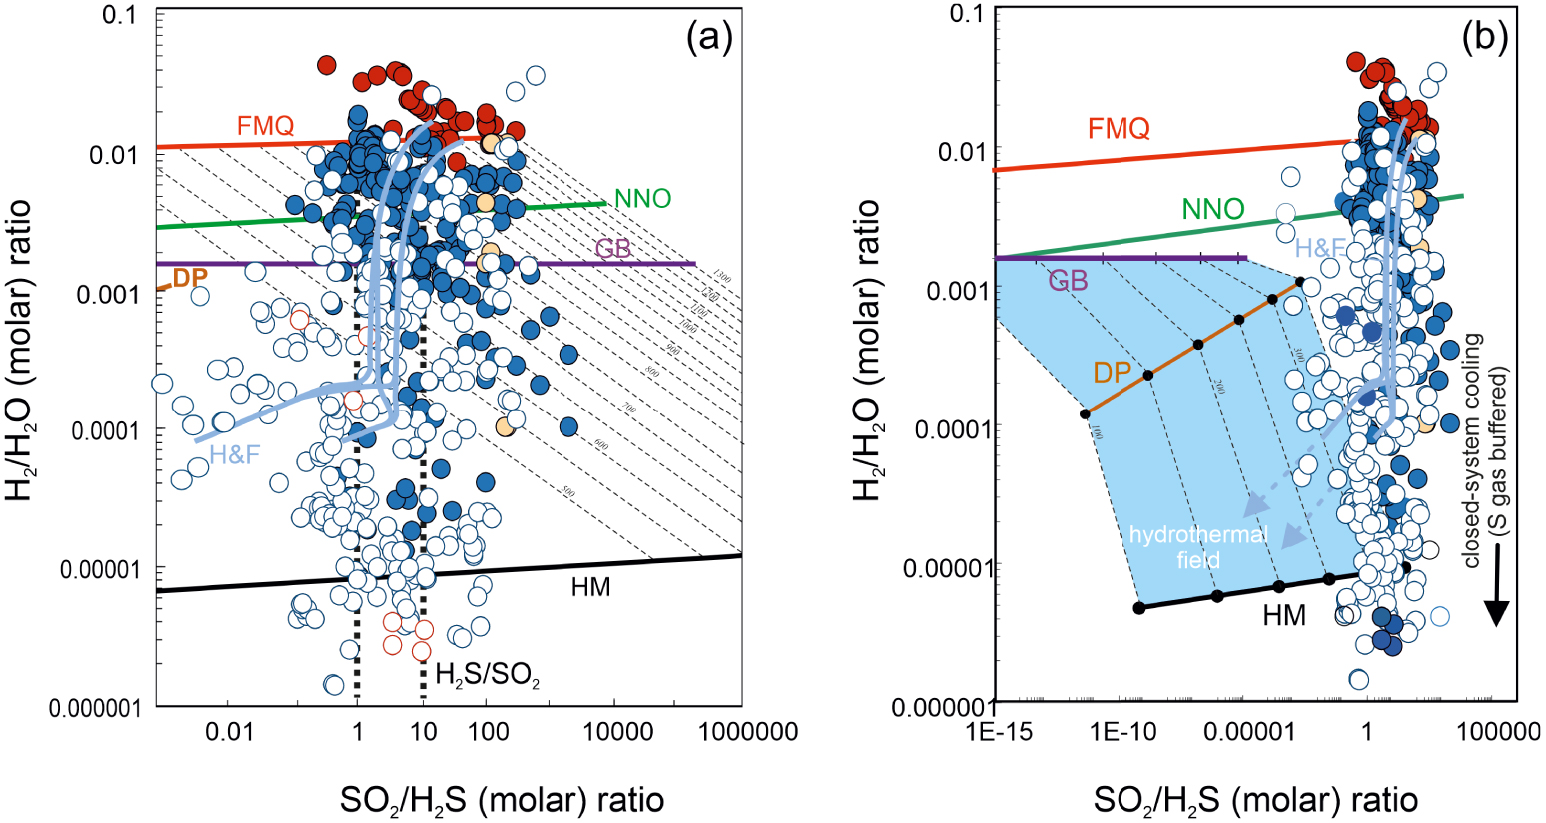
4.1.2. Mixed magmatic–hydrothermal gases
Lower temperature magmatic gases (600 °C < T < 900 °C) and mixed (magmatic–hydrothermal) gases (T < 600 °C) overall identify a compositional tendency of decreasing H2/H2O ratios with decreasing temperature (Figure 3a). This trend (qualitatively identified by the grey shaded region of Figure 3a) is manifestly steeper than the temperature dependences imposed by any of the mineral fO2 buffers (solid lines). Giggenbach [1987, 1996] took this as evidence of a marginal (if any) control exercised by redox budget exchanges between gases and silicate melts (in the supra-solidus regions) and/or with wall rocks (in the sub-solidus region). Rather, Giggenbach [1987, 1996] proposed that the H2/H2O ratios versus temperature dependence exhibited by volcanic gas samples (Figure 3a) can satisfactory be explained by homogeneous (gas-phase only) redox reactions taking place during gas expansion and cooling, according to reaction:
| (5) |
| (6) |
The resulting model-derived (Equation (6)) temperature dependence of the H2/H2O ratios (dashed line labelled H2S/SO2; Figure 3a) nicely reproduces the volcanic gas compositional array (grey band). Notably, this ability of coexisting H2S and SO2 to buffer gas phase redox is entirely consistent with the temperature invariant, analytically determined SO2/H2S ratios (Figure 3b). Giggenbach [1987] concluded that the conversion of SO2 to H2S during gas cooling, as implicated by the mineral buffer curves (Figure 3b), is inhibited by the rapid transit of magma sourced gases through host rocks, preventing gas–rock reactions to become effective (to achieve equilibrium). The temperature-invariant, measured SO2/H2S gas compositions in our dataset (Figure 3b) indeed suggest that sulphur speciation is little affected by gas–mineral reactions during cooling, although data align along a nearly horizontal trend at SO2/H2S of ∼10 (H2S/SO2 of ∼0.1) rather than ∼1 [as implicated in the original H2S/SO2 gas buffer of Giggenbach 1987, 1996] (Figures 3b, 4).
An alternative view to that of Giggenbach [1987] has recently been proposed by Henley and Fischer [2021]. The authors, based on field evidence arising from rock alteration assemblages found at extinct (now eroded) andesitic volcanoes [Henley and Berger 2011; Henley et al. 2015], proposed that gas H2/H2O and SO2/H2S ratios are controlled by heterogeneous (mineral–gas) rather than homogenous (gas-only) reactions. The authors presented a comprehensive multi-component thermochemical modelling of gas–solid equilibria of magmatic SO2 reaction with primary rock-forming minerals. The key reaction invoked by the authors is:
| (7) |
| (8) |
The equilibrium constant of reaction (7):
| (9) |
| (10) |
If either homogeneous (gas-only; Equation (5)) or heterogenous (gas–mineral; Equations (7)–(8)) reactions prevail (during ascent and cooling of magmatic gases from source to surface) cannot be unambiguously resolved from our model versus natural samples comparison. In principle, there is no reason to exclude both reaction mechanisms can indeed co-operate in a volcanic system in space and time. The heterogeneous (gas–mineral) reactions satisfactorily explain the transition of magmatic gases into nominal SO2-free hydrothermal gases (dashed light blue arrows in Figure 4b), and are expected to prevail in mature hydrothermal systems where the transit of gas is sufficiently slow to insure gas–mineral titration effectively takes place, leading to SO2-to-H2S conversion and sulphur loss to hydrothermal minerals. In more active magmatic systems, vice versa, it is well possible that gas transit through the host rocks is fast enough to prevent large SO2 scavenging from reactions with minerals. Our mixed (magmatic–hydrothermal) gases all contain detectable SO2, and the SO2/H2S ratios are relatively temperature invariant (Figures 3b and 4a,b), implying the gas may remain closed to reactions with host rocks in many cases, in which case reaction (5) would keep a major control on gas chemistry and redox.
Neither homogeneous nor heterogenous reactions can explain the high H2/H2O ratio signature of many relatively low-temperature (T < 400 °C) gas samples (Figure 3a). These H2-rich compositions imply that re-equilibration (upon gas cooling) may eventually not take place at all, causing the surface discharge of relatively cold gases to preserve quenched, higher-temperature equilibrium conditions (see arrow labelled “quenching” in Figure 3). Ultimately, the extent of (gas or gas–mineral) re-equilibration will range from minimal to total in natural systems, depending on the local conditions and specific ascent/cooling histories of gases, as on their route to the surface.
4.2. Use of hydrogen and hydrogen sulphides as geothermometers
The strong temperature dependence of H2 concentrations (Figure 2a) and H2/H2O ratios (Figure 3a), combined with relatively temperature-invariant SO2/H2S ratios (Figures 3b, 4a,b), suggest that gas chemistry and redox are often internally buffered (by the gas-phase reaction (5)). One possible way to test if/to what extent fast-reacting H2 rapidly attains equilibrium in an internally buffered volcanic gas phase (e.g., whose redox is controlled by the H2S–SO2 gas buffer) is to use Equation (5) to estimate Apparent Equilibrium Temperatures [AETs; e.g., Matsuo 1962; Ohba et al. 1994; Moussallam et al. 2019a, 2022], and compare these with measured (discharge) temperatures. Deriving such AETs from measured H2, H2O, SO2 and H2S compositions [e.g., Moussallam et al. 2019a, 2022] is especially important at open-vent volcanoes [Shinohara et al. 2011, 2015, 2018], in which gas observations are typically taken in “cold” atmospheric volcanic gas plumes, whose source vents are inaccessible to direct temperature measurements [this contrasts with closed-conduit volcanoes in which gas venting temperatures are measured concurrently with gas sampling at the fumarolic outlet; e.g., Ohba et al. 1994]. Such information on magma source temperatures can be recorded in the composition of the plume at condition that gas-melt equilibria (i) are established at magma T–P-redox conditions, and (ii) conserved during gas cooling and mixing during atmospheric dispersion. Assumption (ii) is indeed verified by observations/models that suggest quenching of magmatic gas composition in volcanic plumes [in which source H2/H2O and SO2/H2S ratios are conserved during plume aging; Aiuppa et al. 2007, 2011].
Our gas catalogue here offers an opportunity to test condition (i) above and, ultimately, to verify if internal (gas-phase) redox buffering prevails in magmatic systems (over heterogeneous reactions).
We initially illustrate in Figure 5a the temperature dependence of the equilibrium constant of reaction (5) (expressed in the form of Log K5), as derived from thermodynamic data in Ohba et al. [1994]. This equilibrium line (solid black line in Figure 5a) is contrasted against analytical values of Log K5, as derived by solving (for each sample in Supplementary Tables 1 and 2) Equation (6) using analytically determined H2/H2O and H2S/SO2 ratios (water fugacity, fH2O, is calculated from measured XH 2O and assuming 1 bar total pressure and ideal gas behaviour). This comparison shows that the “restored gas analyses” output analytical Log K5 values that perfectly overlap with the equilibrium curve: this merely reflects the accuracy of the gas restoration procedure of Gerlach [1980]. More significant is the observation that unrestored magmatic gases (600 °C < T < 1100 °C) have analytically determined Log K5 that match closely equilibrium Log K5 values: for these samples, approach to equilibrium is proved by the close match between measured (discharge) temperatures and AETs (Figure 5b). Some mixed hydrothermal-magmatic gases also plot along (or at least very close to) the model equilibrium curve (Figure 5a), indicating that equilibrium conditions can still be achieved during gas cooling at temperatures of <600 °C (and as low as ∼200 °C; Figures 5a, b). However, in such a temperature range, and increasing number of samples output analytically derived Log K5 that diverge from the equilibrium line (Figure 5a): in these samples, AETs exceed measured (discharge) temperatures by several hundred degrees in some cases, again indicating quenching of higher temperature (magmatic) conditions, and or disequilibrium conditions. These are the same samples that in Figure 3a diverge from the main compositional-temperature array (grey band) toward higher H2/H2O ratios.
(a) Temperature dependence of the equilibrium constant of reaction (5) (expressed in the form of Log K5), as derived from thermodynamic data in Ohba et al. [1994]. The equilibrium line (solid black line) is contrasted against analytical values of Log K5, as derived by solving (for each sample in Supplementary Tables 1 and 2) Equation (6) using analytically determined H2/H2O and H2S/SO2 ratios (water fugacity, fH2O, is calculated from measured XH2O and assuming 1 bar total pressure and ideal gas behaviour). (b) Apparent equilibrium temperatures (AET) [Matsuo 1962; Ohba et al. 1994; Moussallam et al. 2022] derived from Equation (6) and analytically determined H2/H2O and H2S/SO2 ratios for individual gas samples. High-temperature gases plot along the 1:1 line, e.g., they match closely measured discharge temperature (x-scale), implying equilibrium conditions. (c) The difference between Apparent equilibrium temperatures (AET) and measured temperatures (MT) approach 0 in high-T gas samples, while AETs exceed MTs at lower temperatures (implying quenching of higher-T equilibria. (d) A magnified version of (c), demonstrating AET and MT differ by < ±20% at T > 600 °C.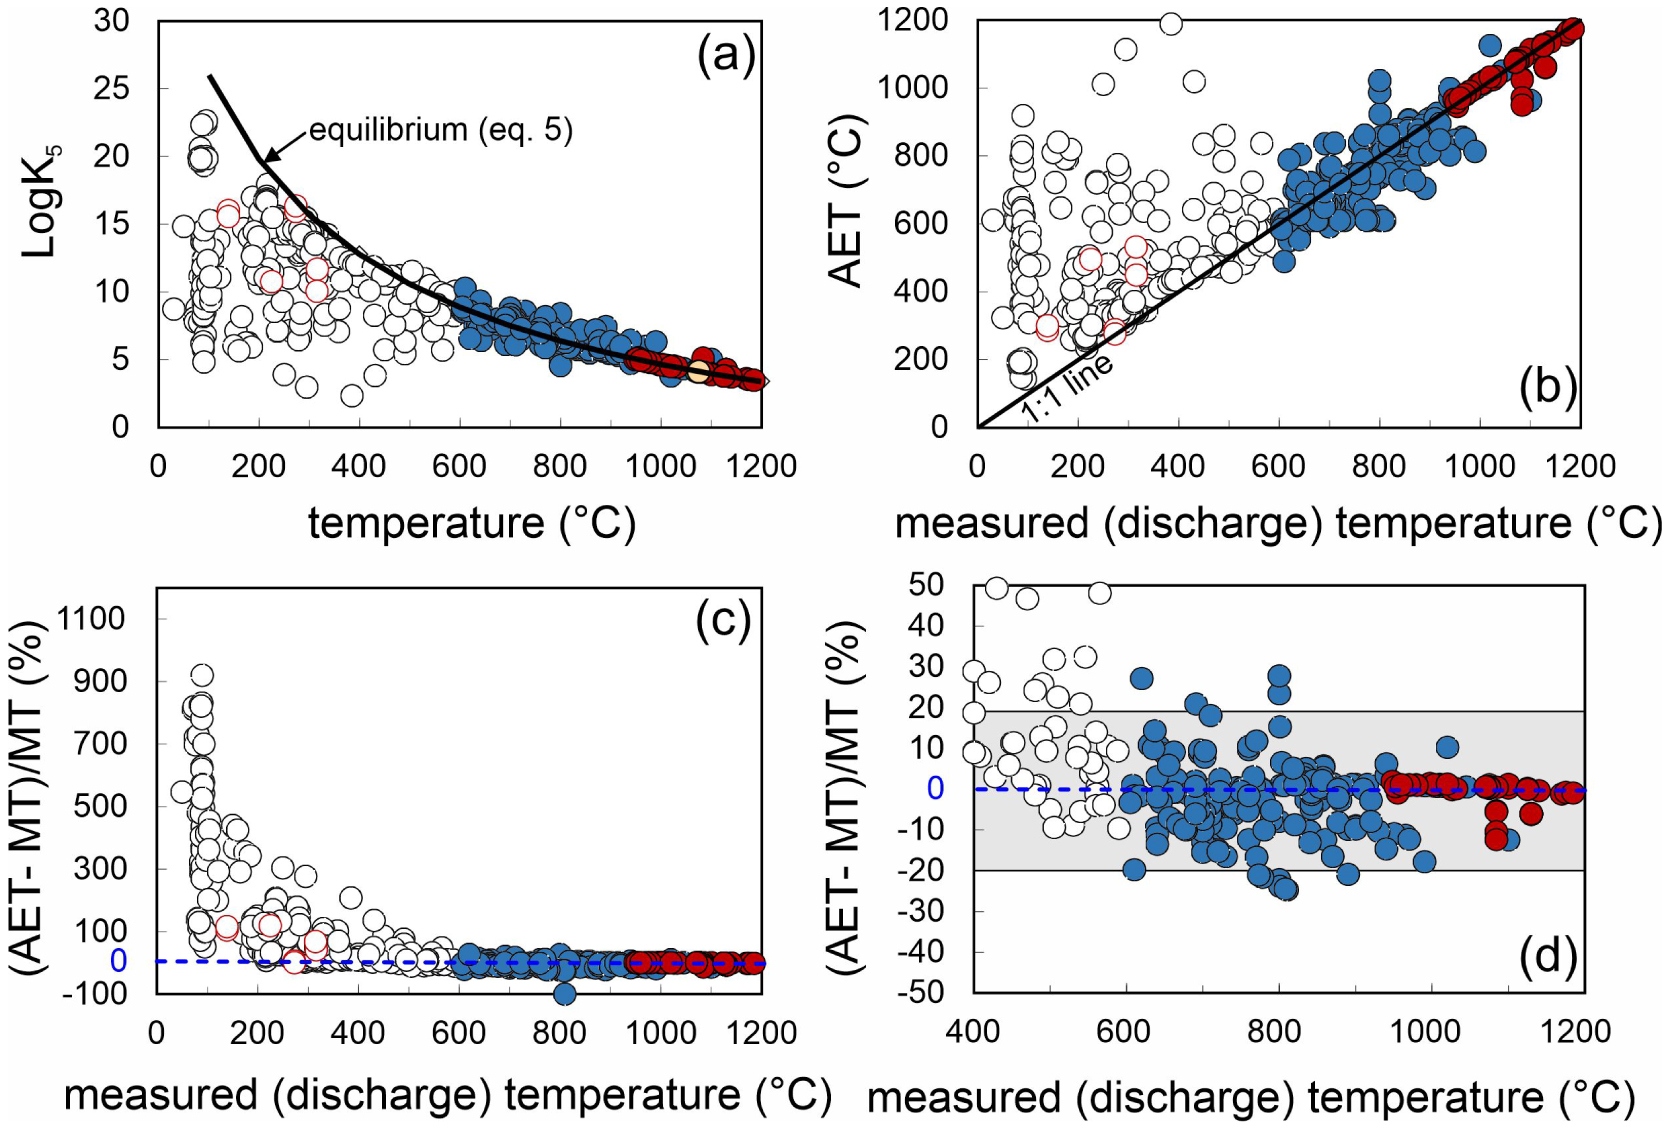
The conclusion we can take is that, as previously shown by Moussallam et al. [2019a] (see their Figure S1), at magmatic temperatures (>600 °C), gas compositions can allow estimating AETs that are within ±20% of actual venting temperatures (Figure 5d). It is very interesting to realise however that even at lower (<600 °C) gas venting temperatures, quenching of higher temperature compositions, or disequilibrium conditions, is indeed common.
The calculations above do not necessarily imply that gas–mineral reactions (7)–(8) are altogether unimportant. Reactions between gas and host-rocks [e.g., Symonds et al. 2001; Henley and Fischer 2021] are central to the formation of SO2-poor hydrothermal steam samples [e.g., Giggenbach 1980]. In the 600 °C < T < 1200 °C temperature range however, the fraction of SO2 loss via reaction (7) and (8) is overall a limited fraction (of the total S load in the gas phase), thus exercising little to no effect on gas equilibria (Figure 5).
4.3. Use of hydrogen and hydrogen sulphides to estimate oxygen fugacity
A matter that has remained debated for years is if, and to what extent, volcanic gas compositions reflect (and can therefore allow deriving) the redox conditions (oxygen fugacities) of the source magmas.
Gerlach [1982] found that their “restored” magmatic gas analyses from tholeiitic and alkaline intraplate volcanoes allow calculating gas oxygen fugacities that vary from ∼10−8.5 to ∼10−12 bar. He also found these fO2 values to be strongly temperature dependent, and to overall define a fO2-collection temperature trend parallel to the fO2–T dependence imposed by the Fayalite–Magnetite–Quartz (FMQ) and Nickel–Nickel Oxide (NNO) redox buffers [Eugster 1977; Frost 1991]. From this, he concluded that “… lavas tend to buffer the O2 fugacities of their associated gases”. Confirmation to this hypothesis came from later studies [Gerlach 1993a, b] in which the fO2 values for (restored) magmatic gases from Kilauea were found to match the measured/calculated fO2 values of Kilauea basalts. Again, Gerlach [1993a] concluded that “the evidence discussed above indicates that subaerial lavas buffer volcanic gas compositions emitted by Kilauea basalt along consistentfO2-T trend from molten to subsolidus temperatures”. A strong temperature dependence of volcanic gas fO2 values was also found in the global compilation of Symonds et al. [1994].
This “melt-buffering” hypothesis has recently been challenged in a series of studies by Oppenheimer et al. [2018] and Moussallam et al. [2019a, 2022] using evidence from novel gas plume observations, either in-situ or remote. Using results from Open Path Fourier Transform Infra-Red (OP-FTIR) spectroscopy observations of lava lake degassing at Kilauea volcano, Oppenheimer et al. [2018] found that gas composition varies with activity style and temperature. They found, in particular, that the volcanic gas phase becomes progressively oxidised as gas temperature progressively drops (below magmatic temperature), at a rate that is inconsistent with that predicted by external gas redox buffering by the coexisting silicate melt. They proposed that magmatic gas redox (fO2) is controlled by homogeneous (gas-phase only) redox re-equilibration upon adiabatic gas cooling. Using evidence from a global volcanic gas dataset, Moussallam et al. [2019a] generalised the conclusions of Oppenheimer et al. [2018], showing that the temperature dependence of volcanic gas fO2 is different (less steep) than that imposed by external melt redox buffers. Rather, they found that volcanic gas redox scales with the extent of gas cooling experienced by gases (as indicated by temperature difference between gas and the source melt). In this interpretation therefore, volcanic gas redox decouples from that of the melt, i.e., the melt redox information is altered in the gas during its adiabatic cooling (as gas bubbles separately rise within—and ultimately burst out of—the silicate melt). To capture this concept, Moussallam et al. [2022] proposed the use of the formulation “apparent oxidation state” or AOS which is the oxidation state of the gas mixture at its apparent equilibrium temperature. Moussallam et al. [2022] showed that if the magma temperature is known then the gas AOS can be restored to its true fO2 at equilibrium with the magma (i.e., the oxidation state of the magma can be calculated from the AOS).
Hydrogen and hydrogen sulphide are inherently central to this discussion, as Equations (3) and (4) can conveniently be re-arranged to estimate AOS from measured/apparent temperature and either H2/H2O or SO2/H2S ratios. Figure 6a is a plot of derived fO2 values for gas samples in our catalogue, as derived from Equation (3) using measured H2/H2O ratios and AETs. fO2s obtained by SO2/H2S ratios (and Equation (4)), also listed in Supplementary Tables 1 and 2, agree well with those derived from H2/H2O ratios. The whole volcanic gas population defines in Figure 6a a roughly linear temperature-fO2 array which slope is manifestly less steep than that of any mineral buffer line. Overall, the volcanic gas population span from redox conditions between the NNO and FMQ buffers at temperatures of 900 °C or more, to redox close to the Hematite–Magnetite (HM) buffer at the low temperature (<400 °C) end of the population. Our results thus corroborate the results of Moussallam et al. [2019a, 2022] that volcanic gases become increasingly oxidised with decreasing temperatures. The high temperature (T > 600 °C) magmatic gas field is magnified in Figure 6b.
The temperature dependence of volcanic gas oxygen fugacities (a) apparent oxygen fugacities of individual gas samples (data from Supplementary Tables 1 and 2), as derived using Equation (2) from measured H2/H2O ratios and estimated Apparent Equilibrium Temperatures (AET; same as Figure 5). Calculated Log fO2 values vary linearly with 1/AET, but the slope of the linear function is manifestly less steep than the Log fO2 − 1∕T dependence imposed by the most common mineral redox buffers [HM: Hematite–Magnetite; NNO: Nickel–Nickel Oxide; FMQ: Fayalite–Magnetite–Quartz; WM: Wustite–Magnetite; IW: Iron–Wustite; QFI; Quartz–Fayalite–Iron; see Frost 1991; Moretti and Neuville 2021]; (b) a magnified version of (a) comparing the Log fO2 − 1∕T dependence for high-temperature (>600 °C) volcanic gases. The dashed lines illustrate the gas evolution predicted from closed-system (gas cooling) calculations. The closed system model lines suitably reproduce the compositional trend (increasingly oxidised conditions upon cooling) described by natural samples.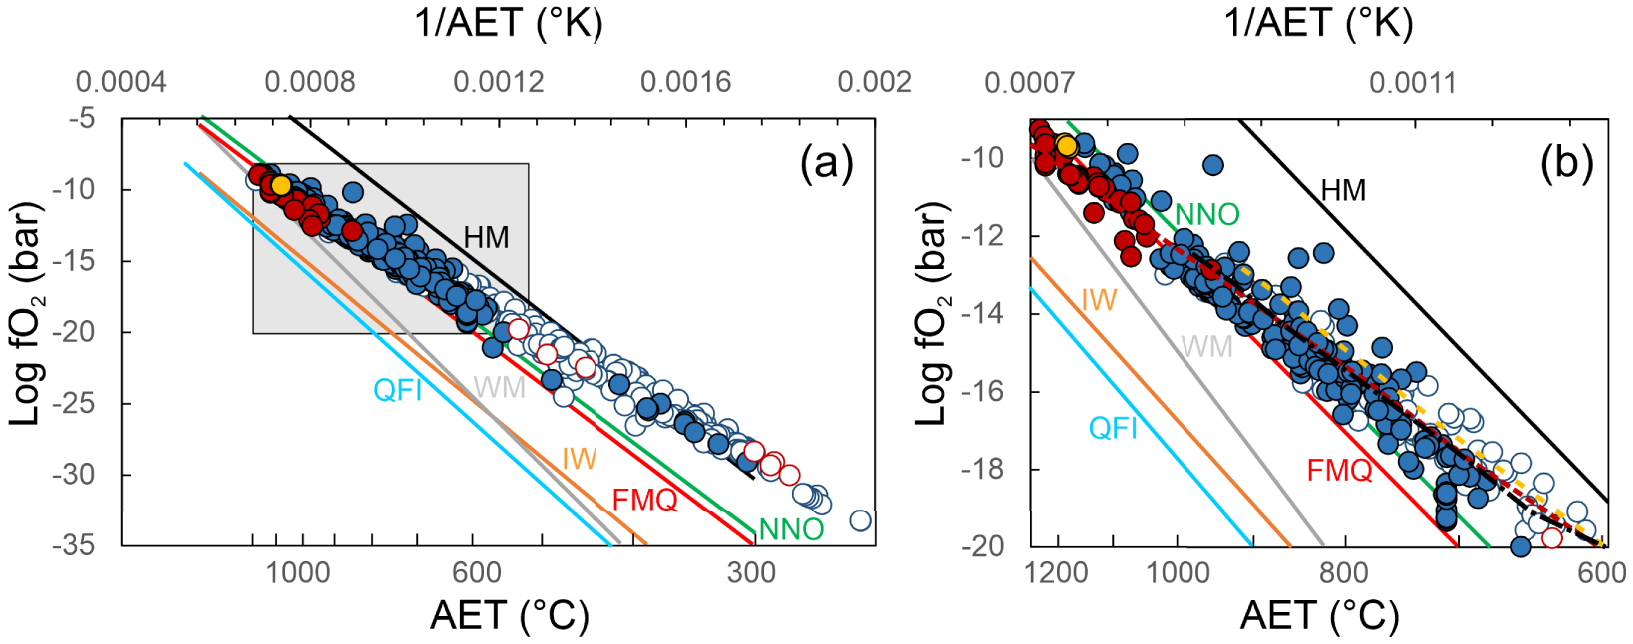
We modelled the closed-system cooling of three gas compositions from Erta’ Ale [Le Guern et al. 1979], Satsuma-Iwojima [Shinohara et al. 1993] and Etna [Aiuppa et al. 2011]. The calculation method is detailed in Moussallam et al. [2019a, 2022] and results are shown in Figure 6b. This shows that even at low (<600 °C) temperature the oxidation state of volcanic gases having suffered limited interaction with the hydrothermal system can be explained by closed system cooling from magmatic temperature. This is an astonishing and very fortunate finding as it means that volcanic gases with AET as low as a few hundred degrees might preserve information of the oxidation state and/or temperature of the magma from which they escaped by simply applying the gas restoration calculations described in Moussallam et al. [2022]. For example, we can perform the same calculations but this time starting with the measured gas composition from Kawa Ijen volcano collected by Allard 1985 at a measured temperature of 244 °C but with an AET of ∼343 °C and at an AOS at QFM+5. Restoring [using Moussallam et al. 2022] the volcanic gas composition back to a magmatic temperature (arbitrarily set to 1000 °C for the purpose of demonstration) would lead to a restored gas composition with an oxidation state and magmatic temperature of QFM+0.3.
The link between volcanic gas and silicate melt (magma) redox is more fully analysed in Figure 7. Figure 7a is a frequency distribution diagram of derived (Equation (3)) apparent oxygen fugacities for magmatic gases (temperature > 600 °C). The figure demonstrates distinct redox conditions for non-arc and arc volcanic gases. In spite of some overlap, most arc volcanic gases have apparent fO2s (as expressed as 𝛥FMQ = logfO2(sample) −logfO2(FMQ at AET)) at 𝛥FMQ⩾0, and as high as 𝛥FMQ + 4; whilst non-arc volcanic gases are generally more reduced 𝛥FMQ⩽0.2, and as low as 𝛥FMQ − 1.2. This diversity is largely explained by the arc gas dataset containing many fumarole samples in the 600–900 °C temperature range, which have therefore cooled significantly below source magma temperatures, ultimately having become more oxidised during closed-system reactions [see Figure 6 and related discussions and see Figure 1 in Moussallam et al. 2022 showing the oxidation state of arc gases restored to magmatic temperature]. However, arc gases sampled at close to magmatic temperatures (T > 900 °C) still plot at higher redox than non-arc magmatic gases (Figure 7a; see also Figures 4 and 6b), implying that the volcanic gas fO2 difference is likely to reflect some distinct redox conditions at source. Intraplate (Figure 7b) and arc (Figure 7c) melts have previously been shown to exhibit distinct redox [Cottrell et al. 2022]. We conclude, therefore, that these diverse magma fO2s are well preserved in volcanic gases, provided adiabatic cooling and re-equilibration have not occurred (e.g., at T ≫ 900 °C). It is important to remember, however, that melt redox has been found to vary upon magma de-compressional ascent and degassing, progressively becoming more reduced [e.g., Moussallam et al. 2014a, 2016, 2019b; Brounce et al. 2017; Helz et al. 2017] at low pressure [when S(IV) is lost to gas as SO2, leading to an overall decrease of the magma redox budget; Evans 2012]. As such, magmatic gas may, at some conditions (limited adiabatic cooling), reflect redox of shallow, surface-emplaced magma; however, it is unlikely to provide information on deep magma (and source mantle) redox [Moretti and Stefánsson 2020].
(a) Frequency distribution diagram of derived (Equation (3)) apparent oxygen fugacities for magmatic gases (temperature > 600 °C), expressed as 𝛥FMQ = logfO2(sample) −logfO2(FMQ at AET). The figure demonstrates distinct redox conditions for non-arc and arc volcanic gases in the same range and magnitude as seen for intraplate (panel b) and arc (panel c) melts [redrawn from Cottrell et al. 2022].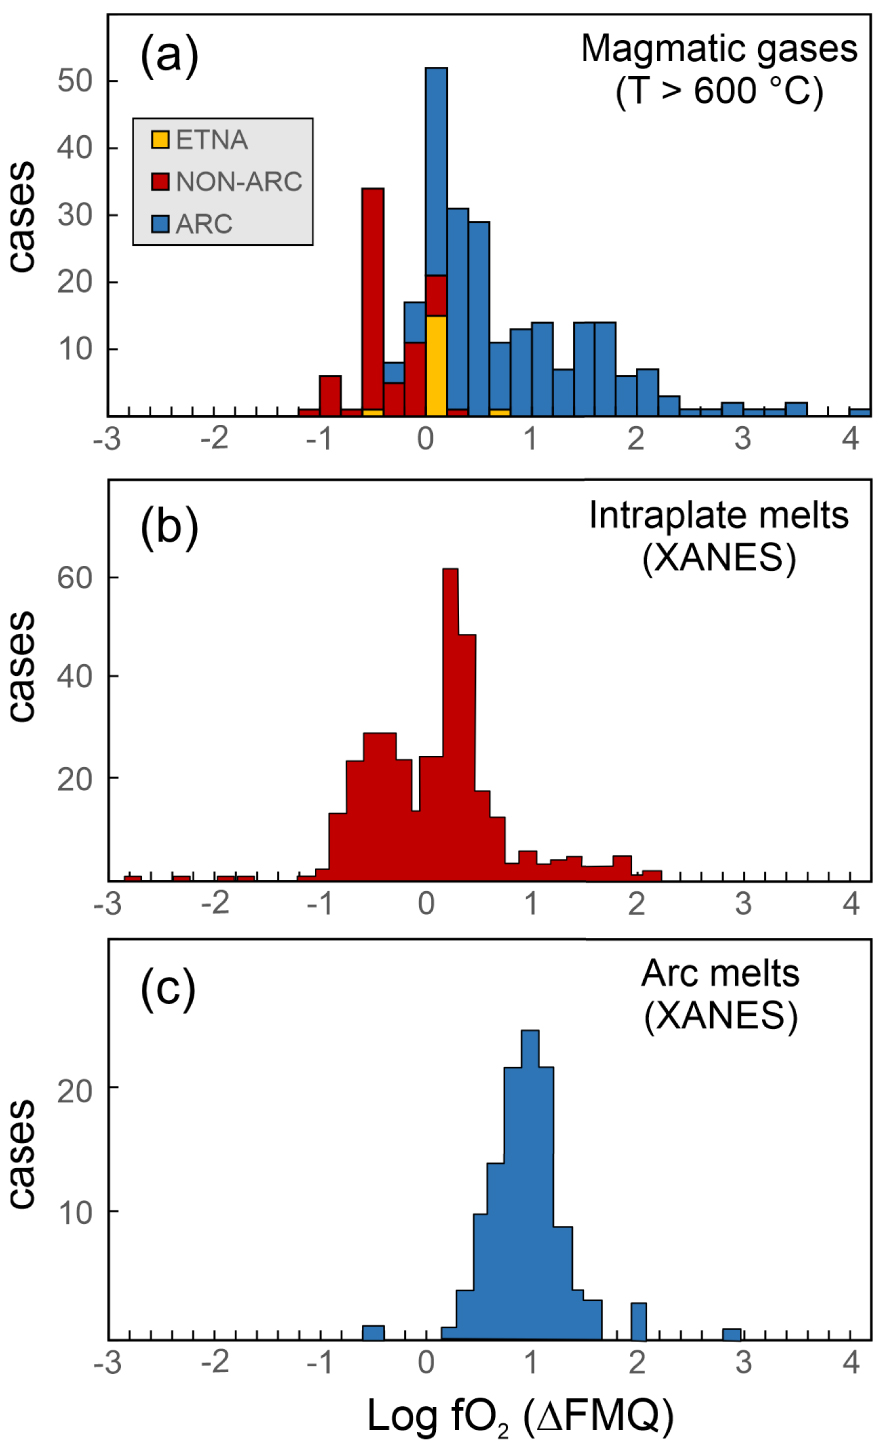
4.4. Atmospheric fluxes
Upon their atmospheric release from subaerial volcanoes, volcanogenic H2 and H2S act as primary electron donors (e.g., as reducing compounds) in the atmosphere [e.g., Holland 2002; Canfield et al. 2006]. As these volcanic gas species thus contribute largely to the reducing power (e.g., the ability to remove atmospheric O2) of volcanic gases, understanding their volcanic atmospheric fluxes is central to reconstructing the oxygenation history of the early atmosphere and the present atmospheric oxygen budget [Holland 2002; Canfield et al. 2006; Stolper et al. 2021].
As for the more abundant CO2 [Aiuppa et al. 2019; Werner et al. 2019; Fischer et al. 2019], the volcanic H2 and H2S fluxes to the atmosphere cannot be measured directly by remote sensing, as no specific observational technique exists for this aim. Therefore, although some rare direct in-situ flux measurements exist [Aiuppa et al. 2013; Allard et al. 2014; Tamburello et al. 2019; Moune et al. 2022], most applications rely on the indirect approach [Aiuppa et al. 2019; Fischer et al. 2019; Werner et al. 2019] of scaling gas ratios (H2/SO2 and H2S/SO2 ratios in this specific case) in volcanic emissions to the global volcanic SO2 flux budget [e.g., Carn et al. 2017; Fischer et al. 2019], which is well understood thanks to abundant UV spectroscopy observations from both ground [Arellano et al. 2021] and space [Carn et al. 2016]. The operation is, however, complicated by the large spread of H2/SO2 and H2S/SO2 ratios in volcanic gas emissions (Figure 8a–d), which has traditionally hampered the derivation of robust global estimates [Halmer et al. 2002; Canfield et al. 2006].
(a–d) Scatter plots of H2S and H2 concentrations (data from Supplementary Tables 1 and 2) versus major species’ concentrations (either SO2 or CO2). All concentrations in mol%. (e–h) Frequency distribution diagrams of volatile (molar) ratios used for flux calculations. See text, symbols as in Figure 2 except green crossed [hydrothermal steam samples from Chiodini and Marini 1998].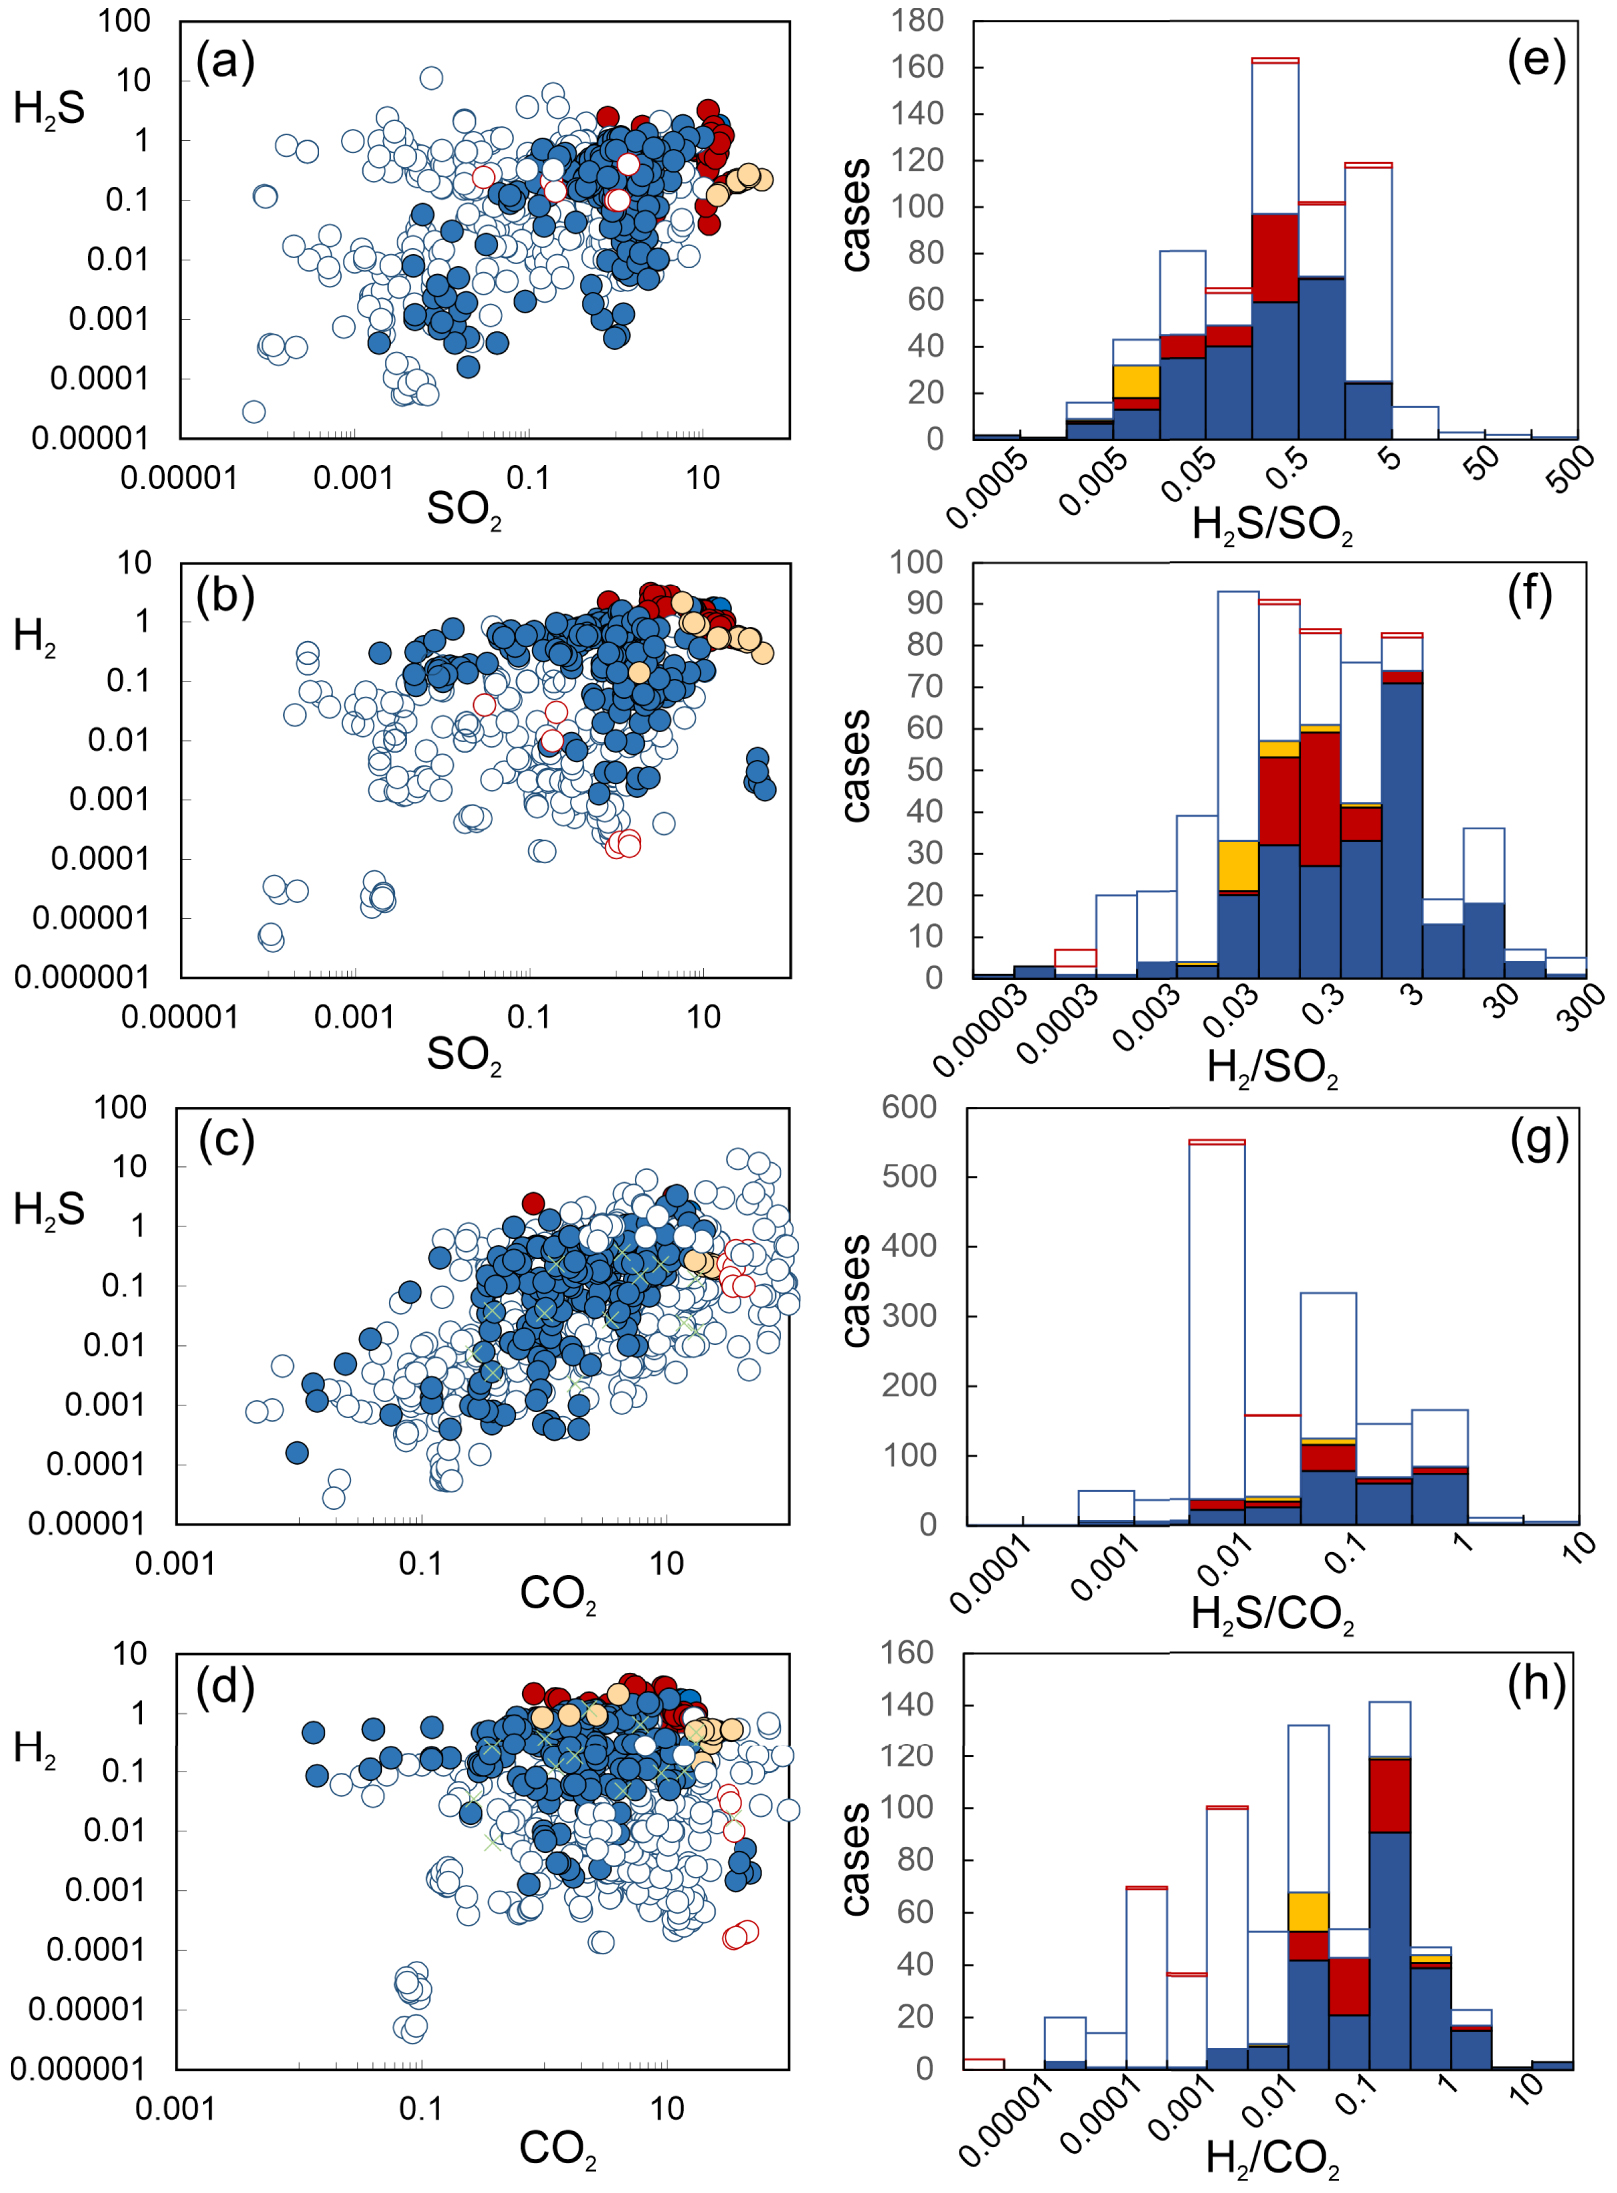
The two most recent attempts to estimate the H2 and H2S fluxes from global subaerial volcanism are from Canfield et al. [2006] and Stolper et al. [2021] (Table 1).
Global volcanic H2S and H2 fluxes (in Tg/yr) revisited
| Mean | SD | Mean | SD | 50% | 25% | 75% | 50% | 25% | 75% | 50% | 25% | 75% | 50% | 25% | 75% | |||||||
|---|---|---|---|---|---|---|---|---|---|---|---|---|---|---|---|---|---|---|---|---|---|---|
| SO2 flux | CO2 flux | H2S/SO2 | H2S flux | H2/SO2 | H2 flux | |||||||||||||||||
| Svge | Magmatic | 24.9 | 2.3 | 36 | 2.4 | 0.1 | 0.06 | 0.6 | 1.3 | 0.8 | 8.3 | 0.3 | 0.1 | 1.3 | 0.23 | 0.06 | 1.0 | |||||
| SO2 flux | CO2 flux | H2S/CO2 | H2S flux | H2/CO2 | H2 flux | |||||||||||||||||
| Wvge | Magmatic | - | - | 11.6 | 3.9 | 0.008 | 0.006 | 0.043 | 0.08 | 0.05 | 0.4 | 0.002 | 0.0005 | 0.012 | 0.0012 | 0.0002 | 0.0062 | |||||
| Wvge | Hydrothermal | - | - | 3.7 | 1.2 | 0.008 | 0.006 | 0.043 | 0.02 | 0.02 | 0.12 | 0.002 | 0.0005 | 0.012 | 0.0004 | 0.0001 | 0.0020 | |||||
| SO2 flux | CO2 flux | H2S flux | H2 flux | |||||||||||||||||||
| Total | This study (Svge + Wvge) | 24.9 | 2.3 | 51.3 | 7.5 | 1.4 | 0.9 | 8.8 | 0.23 | 0.06 | 1.0 | |||||||||||
| Total | Canfield et al. [2006] | 1.4–2 | 0.2–0.7 | |||||||||||||||||||
| Stolper et al. [2021] | 0.05–4 | 0.07–0.44 | ||||||||||||||||||||
These are obtained by multiplying the global volcanic SO2 and CO2 fluxes of Fischer et al. [2019] by the median (molar) gas ratios in our catalogue (Supplementary Tables 1 and 2). See text. Uncertainty is quantified using 25 and 75 percentiles. We distinguish three volcano categories (Svge, magmatic Wvge and hydrothermal Wvge) as in Fischer and Aiuppa [2020]. Total fluxes are calculated by summing together the three flux contributions. Previous flux inventories by Canfield et al. [2006] and Stolper et al. [2021] are shown for comparison.
Canfield et al. [2006] compiled 21 high quality volcanic gas analyses from volcanoes in a variety of geological context, including rift-related, hot-spot related, and in subduction zones related. They found volcanic gas H2/SO2 and H2S/SO2 ratios to vary widely even in such a limited dataset, total ranges being respectively of 0.02–24 and 0.007–2.7. The median volcanic gas H2/SO2 and H2S/SO2 ratios in their subset of volcanic gas samples are 0.8 (H2/SO2) and 0.3 (H2S/SO2). Ultimately, by using most representative ratio ranges in combination with a global SO2 flux estimate [Halmer et al. 2002] they quantified the global volcanic H2 and H2S fluxes at 0.2–0.7 Tg/yr and 1.4–2.0 Tg/yr, respectively (Table 1).
Stolper et al. [2021] also based their H2 and H2S flux estimates on major species’ global budgets—they used the more updated global volcanic SO2 and H2O flux inventories of Fischer et al. [2019]. However, they adopted a different methodology for deriving best-estimates for H2/SO2 and H2S/SO2 ratios in “globally averaged volcanic gas emissions”. Instead of averaging results from measured H2/SO2 and H2S/SO2 ratios in volcanic gas samples, they relied on thermodynamically derived H2/SO2 and H2S/SO2 ratios, calculated (from relations similar to Equations (3) and (4) presented above) at temperature, pressure and redox (fO2) conditions of the source silicate melt. For example, they quantified the global volcanic H2 flux at 0.07–0.44 Tg/yr (Table 1) by combining the global volcanic H2O flux of Fischer et al. [2019] with the thermodynamically derived (Equation (3)) H2/H2O ratios at equilibrium with melt, using T, P, fO2 values relevant to modern subaerial magmas. Likewise, their global volcanic H2S flux range of 0.05–4 Tg/yr was inferred from the global SO2 inventory of Fischer et al. [2019] and the thermodynamically estimated Equation (4) equilibrium (at melt T, P, fO2) H2S/SO2 ratios (Table 1). It is necessary to remember that Stolper et al. [2021] implicitly assume that surface volcanic gas emissions are controlled (buffered) by heterogenous equilibrium with the coexisting silicate melt. However, this assumption, as previously discussed (cf. Section 4.3), likely holds only for the very few cases of gases emitted at magmatic temperature, but not for the many, lower temperature gas emissions seen at the vast majority of the active volcanoes worldwide (see Figures 3, 4, 6). For example, the range of estimated equilibrium H2/H2O ratios of Stolper et al. [2021] is 0.01 to 0.024, and therefore captures only the upper class (the “magmatic” range) of measured H2/H2O ratios in volcanic gases (Figures 3a and 5); the majority of the surface-emitted volcanic gases will be far more H2-poor because of re-equilibration during homogenous (closed-system) gas cooling (cf. Section 4.3). As magmatic gas H2S/SO2 are overall preserved during gas cooling (Figures 3b, 5), their estimated range (0.000012–0.28) is representative of the measured gas composition range (Figure 8b).
We here attempt at a refined H2 and H2S volcanic flux inventory (Table 1) by using our more complete volcanic gas catalogue (Supplementary Tables 1 and 2).
Our calculations stand on the approach developed in the most recent volcanic gas flux quantification efforts [Fischer et al. 2019; Fischer and Aiuppa 2020], in which three categories of subaerial volcanoes are distinguished and separately treated (Table 1). A first category of Volcanic Gas Emitters (Svge) includes the strongly degassing volcanoes whose SO2 emissions can systematically be detected by satellites [e.g., Carn et al. 2017; Fischer et al. 2019]. These volcanoes typically release high-temperature, SO2-rich gases, often from open-vent persistently degassing vents, and are believed to dominate the volcanic SO2 and CO2 flux inventories [e.g., Aiuppa et al. 2017, 2019; Carn et al. 2017; Fischer et al. 2019; Werner et al. 2019; Fischer and Aiuppa 2020]. Our high-temperature (T > 600 °C; Supplementary Table 1), ST-rich (Figure 1) magmatic gases are inherently the most representative of such emission category. These have median
H2S/SO2 (Figure 8a–e) and H2/SO2 (Figure 8b–f) ratios of respectively 0.1 and 0.3 (25%–75% percentiles: 0.06–0.6 and 0.1–1.3, respectively; Table 1). From these, and scaling to the global volcanic flux SO2 of Fischer et al. [2019] (24.9 Tg/yr), we infer the Svge contribution to the global (subaerial) volcanic H2 and H2S flux at 1.3 Tg/yr (confidence interval, 0.8–8.3) and 0.23 Tg/yr (confidence interval, 0.06–1). The other two categories correspond to the Weak Gas Emitters (Wvge) [Fischer et al. 2019; Fischer and Aiuppa 2020] that include both (a) recently active (but now dormant) volcanoes whose SO2 emissions are too small to be resolved from space (the “magmatic” Wvge), or (b) quiescent volcanoes in hydrothermal stage of activity (the “hydrothermal” Wvge) that do not release SO2 at all, and in which sulphur is essentially released in H2S form. For Wvge, we therefore cannot rely on a SO2 flux proxy. Rather, we use the CO2 flux estimates of Fischer et al. [2019], in combination with H2S/CO2 (Figure 8c–g) and H2/CO2 (Figure 8d–h) ratios. Our mixed (magmatic–hydrothermal), lower temperature (T⩽600 °C; Supplementary Table 2) volcanic gas population exactly corresponds to the category of “magmatic” Wvge, and exhibits H2S/CO2 and H2/CO2 ratios of 0.008 (0.006–0.043) and 0.002 (0.0005–0.012) (Table 1). Hydrothermal Wvge are not explicitly covered by our review, but their compositions [see data from Chiodini and Marini 1998] overlap with the magmatic” Wvge compositional range (Figures 8g and h), so we can use the composition of the latter. In summary, therefore, we infer that Wvge contribute ∼0.1 Tg H2S and ∼0.0016 Tg H2 yearly. It is important to stress that the population of Wvge spans orders of magnitude in terms of H2S/CO2 and H2/CO2 (Figures 8c–d and g–h) ratios, so our flux estimates for this specific category are very poorly constrained. However, this has limited impact on our estimated total fluxes of H2S (1.4 Tg/yr; 0.9–8.8) and H2 (0.23 Tg/yr; 0.06–1) fluxes, which are by far dominated by Svge. We conclude that, while thus Wvge are important volcanic CO2 sources [Table 1; Fischer et al. 2019; Fischer and Aiuppa 2020], their contribution to global volcanic subaerial fluxes of reduced, hydrogenated compounds is irrelevant. This reflects the H2-poor signature of low temperature gas emissions (Figures 2, 3, 5, 8)—caused by gas oxidation during cooling (Figure 6) (cf. Section 4.3)—and the removal of water-soluble sulphur during magmatic gas interactions with liquid-dominated hydrothermal systems [e.g., Aiuppa et al. 2017], which determines the prevailing low H2S/CO2 compositions (Figures 1, 8g). Our estimated total volcanic H2S and H2 fluxes are at the lower range of the estimates of Canfield et al. [2006], and at the very middle of the flux range of Stolper et al. [2021] (Table 1).
Our results indicate that global volcanism contributes little ( ∼1%; range 0.3–4.3%) to the cumulative (global) geogenic H2 flux [ ∼23 Tg/yr; Zgonnik 2020]. For comparison, anthropogenic H2 emissions [ ∼11 Tg/yr; Ehhalt and Rohrer 2009] are 1 to 2 orders of magnitude higher than volcanic emissions. In contrast, our best-estimate for the volcanic H2S flux (1.4 Tg/yr) implies volcanoes do make up a non-trivial ( ∼18%) fraction of the global natural H2S flux [∼7.7 Tg/yr; Watts 2000]. Volcanic degassing contributes nearly 3 times less H2S than today anthropogenic emissions [3.3 Tg/yr; Watts 2000].
5. Summary and conclusions
We have reviewed our present understanding of the processes that govern the abundance of reduced hydrogenated compounds in volcanic gases. Our review shows that the apparent oxygen fugacities of high-temperature volcanic gases range from 𝛥FMQ −1 to 0 (for non-arc volcanoes) to 𝛥FMQ 0 to +2 (for arc volcanoes), and are therefore comparable to the redox conditions of the source silicate melts. A variety of processes can alter gas composition and redox state (H2/H2O and H2S/SO2 ratios) as the gases expand within the melt and cool, and/or after they separate from magma on their route to the surface. Data in our catalogue, when interpreted in the context of existing models of homogeneous (gas) or heterogeneous (gas–mineral) reactions, suggest that in many cases the fast-reacting H2/H2O couple rapidly re-equilibrates during cooling (e.g., in low temperature gas environments) in a gas-buffered system which redox is controlled by coexisting H2S and SO2 (which H2S/SO2 ratio is ultimately conserved at ∼0.1 on average). This gas-phase (closed-system) re-equilibration upon cooling causes the gas to become more oxidised than the original (source) magma [Oppenheimer et al. 2018; Moussallam et al. 2019a]. Conversion of magmatic SO2 to hydrothermal H2S (and precipitation of sulphates/sulphides) is instead favoured by slower transit of the gas through the host rocks, causing more prolonged gas–water–rock interactions to occur. This condition [Henley and Fischer 2021] certainly prevails in more mature, liquid-dominated, and stable (less magma fed) hydrothermal systems [Chiodini and Marini 1998]. Our volcanic gas dataset, combined with recently published global volcanic SO2 and CO2 budgets, implies total H2S and H2 fluxes from global subaerial volcanism of 1.4 Tg/yr (range, 0.9–8.8 Tg/yr) and 0.23 Tg/yr (range, 0.06–1 Tg/yr), respectively.
Declaration of interests
The authors do not work for, advise, own shares in, or receive funds from any organization that could benefit from this article, and have declared no affiliations other than their research organizations.
Acknowledgements
This research received financial support from the Ministero dell’Università e Ricerca (Italy, Grant n. 2017LMNLAW), from the Dipartimento della Protezione Civile and the INGV (under grant “Sviluppo del sistema unico (INGV-Università) di monitoraggio vulcanico e rilevamento precoce dei maremoti e delle esplosioni parossistiche di Stromboli”), and from the PNRR PE Project “Return”. This work was initially inspired by participation of AA to the International School “Understanding Oxygen fugacity in Geoscience” 5–9 September 2022, Trieste, Italy (https://fo2school.units.it/), and the organisers of the school (Luca Ziberna and Vincenzo Stagno especially) are warmly thanked.
Supplementary data
Supporting information for this article is available on the journal’s website under https://doi.org/10.5802/crgeos.235 or from the author.