


 CC-BY 4.0
1. Introduction
Understanding magmatic volatiles behaviour in terms of the maximum amount that can be dissolved in a silicate melt under a given set of conditions (pressure, temperature, melt composition, and redox state) is crucial for improving the knowledge of magmatic processes and degassing mechanisms involved in volcanic eruptions [Moore 2008; Moore and Carmichael 1998; Oppenheimer et al. 2014].
Among other species (CO2, S, F, and Cl), water is the most abundant volatile phase in magmas on Earth, exerting an important control on their physical and rheological properties [i.e., density, viscosity; Andújar and Scaillet 2012a; Giordano et al. 2008; Stolper 1982a] and phase equilibria [Andújar et al. 2015, 2017; Scaillet and Evans 1999; Scaillet et al. 2008]. The amount of volatiles along with the level, rate, and efficiency of the exsolution process (especially for H2O) during magma ascent, largely control the explosive–effusive style of an eruption [Andújar and Scaillet 2012b; Burnham 1979; Sparks 1978]. Therefore, understanding the mechanisms that control the solubility of the different volatile species dissolved in magmas is crucial to decipher surface gas signals, changes in the eruptive dynamic, and correctly interpretate melt inclusion (MI) data.
For this reason, the solubility of H2O and CO2 and their speciation in melts have been the focus of numerous experimental studies, which have explored the dissolution behaviour of pure H2O [e.g., Carroll and Blank 1997; Lesne et al. 2011a; Moore et al. 1998; Mysen and Cody 2004; Schmidt and Behrens 2008; Stolper 1982a,b], pure CO2 [e.g., Brooker et al. 2001a,b; Dixon and Pan 1995; Jendrzejewski et al. 1997; Lesne et al. 2011b; Moore et al. 2000; Mysen et al. 1975; Pan et al. 1991], and mixed H2O–CO2 fluids [e.g., Allison et al. 2019; Botcharnikov et al. 2005; Dixon et al. 1995; Dixon and Stolper 1995; Iacono-Marziano et al. 2012; Iacovino et al. 2013; Moussallam et al. 2016; Newman and Lowenstern 2002; Schanofski et al. 2019; Shishkina et al. 2010, 2014; Tamic et al. 2001; Vetere et al. 2014] over a large range of melt compositions and experimental P–T conditions.
(a) Geographic location of Canary Islands. Digital elevation model of Tenerife, showing the location of the two historical monogenetic eruptions of Fasnia (in green) and Garachico (in orange) and their sampling points (green square and orange circle, respectively). (b) Classification of the starting experimental glasses based on the total alkalis versus silica diagram [TAS, Le Bas et al. 1986]. The large dark green square and orange circle represent the starting compositions of Fasnia (basanite) and Garachico (phonotephrite), respectively. The smaller light green squares (Fasnia) and orange circles (Garachico) correspond to experimental run products. Each symbol represents the average of 10–15 single EPMA analyses.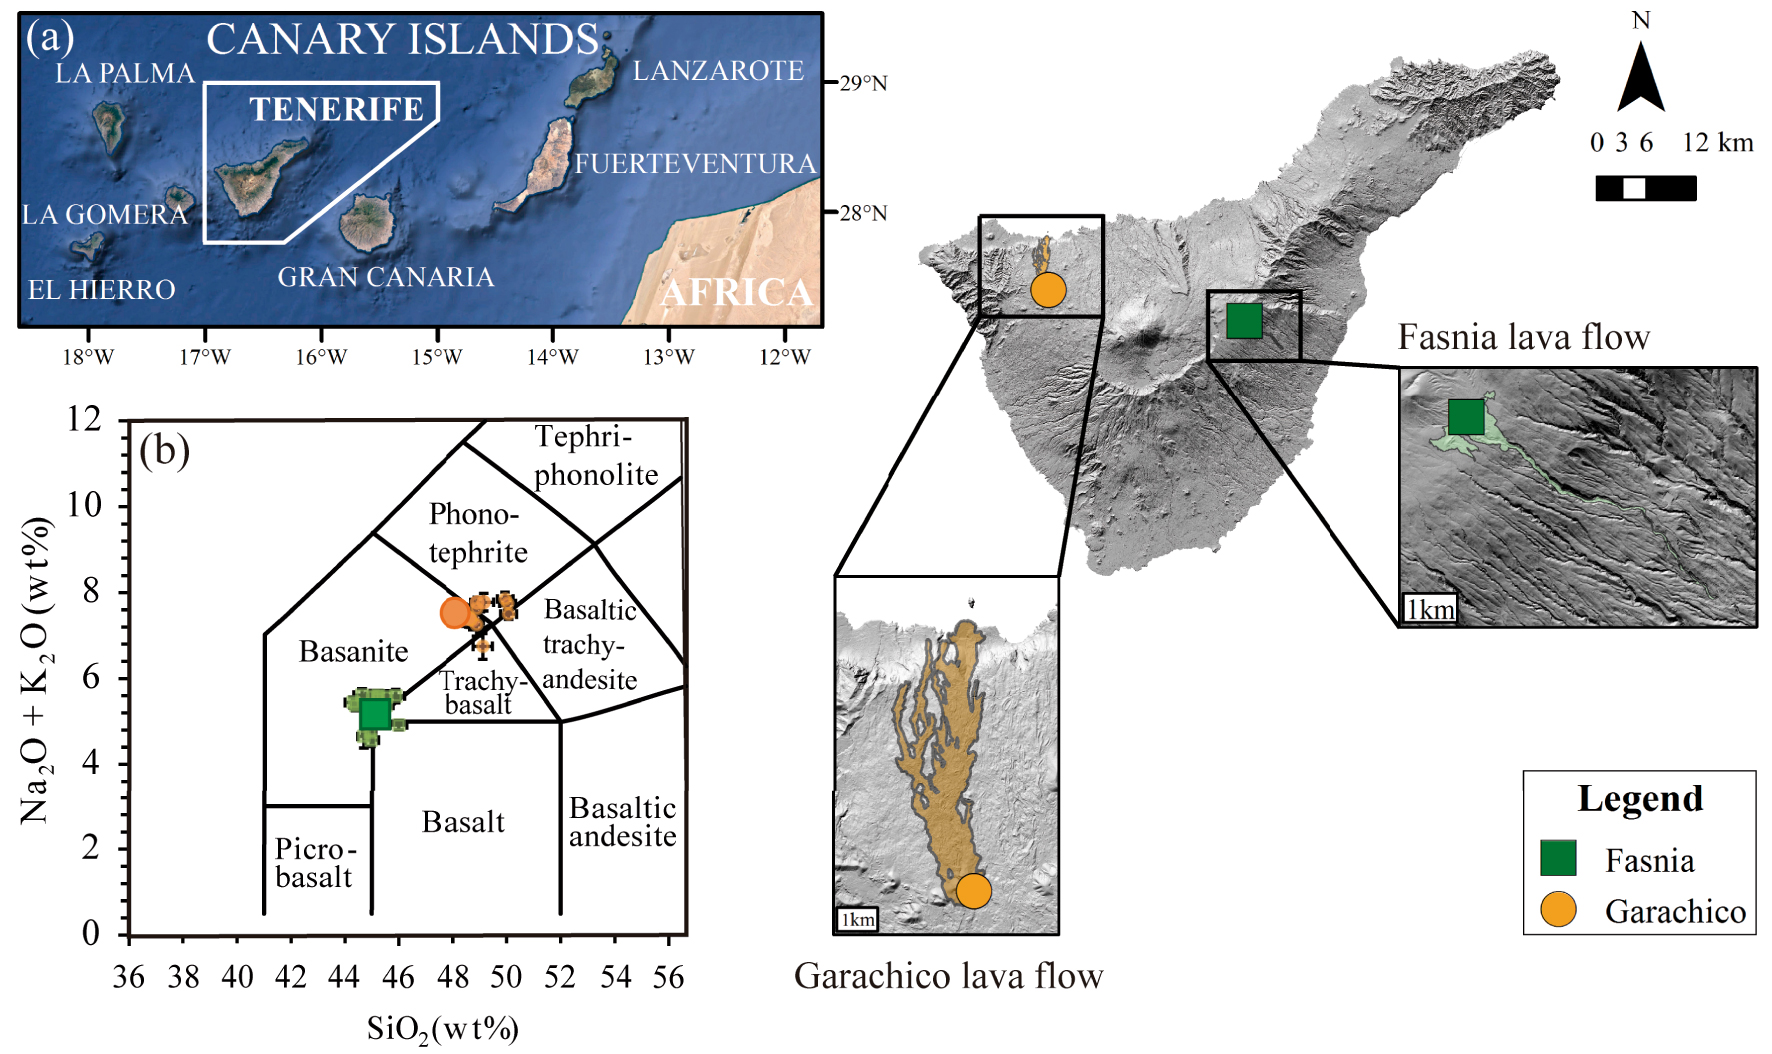
Pioneering works [e.g., Burnham and Jahns 1962; Goranson 1931, 1936] already pointed out the strong dependence of water solubility on pressure, melt composition, and to a lesser degree, temperature. Theoretical considerations and spectroscopic studies show that water dissolves in silicate melts either as hydroxyl (-OH) groups [e.g., Burnham 1975; Burnham and Davis 1971, 1974] or H2O molecules [e.g., Carroll and Blank 1997; McMillan and Remmele 1986; Mysen and Virgo 1986a,b; Newman et al. 1986; Stolper 1982a,b], and their relative proportion varying significantly with total water content. At low H2O concentrations (<1 wt%), the hydroxyl species predominates while at high H2Ototal, molecular water dominates [e.g., Silver et al. 1990; Stolper 1982a,b]. The CO2 solubility is also highly dependent on pressure and composition but compared to H2O, magmas can incorporate relatively low amounts of carbon under the same P–T conditions. The difference in solubility gives rise to the exsolution of a CO2-rich fluid at very initial stages of magma ascent, which gets enriched in water as decompression proceeds, in particular during the very last steps of ascent [e.g., Dixon et al. 1995; Dixon and Stolper 1995; Edmonds and Wallace 2017]. Consequently, CO2 plays an important role in generating vapour-saturation conditions at crustal pressures with strong implications on eruption triggers and changes in the eruptive dynamic [e.g., Anderson 1975; Newman and Lowenstern 2002; Pichavant et al. 2013].
The dependence of CO2 solubility with magma composition is commonly described as a function of the NBO/T parameter (average number of nonbridging oxygens per tetrahedrally coordinated cation), which is considered as a proxy for the degree of (de)polymerization of a silicate melt [e.g., Mysen et al. 1982; Mysen 1990, 1991]. The increase of NBO/T species in the melt enhances CO2 solubility [e.g., Brooker et al. 2001a,b; Iacono-Marziano et al. 2012]. However, this parameter alone cannot fully capture the details of CO2 solubility behaviour observed in magmas of broadly similar compositions. In particular, CaO and K2O contents also play an important role in enhancing CO2 solubility in magmas [e.g., Behrens et al. 2009; Dixon 1997; Lesne et al. 2011b; Moore 2008; Scaillet and Pichavant 2005; Vetere et al. 2014].
Despite all the existing H2O and/or CO2 solubility models, associated errors generally exceed 15–20%, translating into differences of ±1–2 wt% H2O and ±1000–2000 CO2 ppm at ⩾300 MPa, namely up to ±6 km in depth. Such uncertainties have a significant impact on the estimates of the saturation and entrapment pressures of magmas and melt inclusions, and consequently, on the interpretation of storage conditions and degassing processes. Thus, in order to obtain the most accurate barometric information on magmas and related degassing processes, it is imperative to determine solubility laws for the most abundant species (H2O–CO2) adapted to the magma composition emitted by each volcanic system.
Here we report the results of water and carbon dioxide solubility experiments performed on basanitic and phonotephritic magmas from Tenerife (Canary Islands, Figure 1) at 1200 °C and pressures ranging from 50 to 400 MPa. Concentrations of molecular water (H2O), hydroxyl groups (-OH), and carbonate ion complexes (CO-3) of quenched glasses were measured by Fourier Transform Infrared Spectroscopy (FTIR) on glasses drop-quenched at high pressures. Two other complementary and independent techniques, Nanoscale Secondary Ion Mass Spectrometry (NanoSIMS) and Elemental Analyzer (EA) were used, when possible, to complement FTIR results.
These concentrations were subsequently used to establish empirical H2O and CO2 solubility models specifically calibrated for the mafic–intermediate alkaline compositions from the Canary Islands, allowing us to calculate, first, the H2O and CO2 fugacities and partial pressures and, second, to re-evaluate volatile entrapment conditions recorded by melt inclusions from different eruptions of El Hierro, including the 2011–2012 event [Longpré et al. 2014, 2017; Taracsák et al. 2019].
2. Experimental and analytical techniques
Solubility experiments and the characterization of run products were performed using established procedures which are detailed in Supplementary Material. In short, experiments were performed in internally heated pressure vessels equipped with a drop quench set-up and allowing redox conditions to be controlled. Run products were characterized by EPMA (Electron Probe Micro-Analysis), SEM (Scanning Electron Microscopy), FTIR, NanoSIMS (Nanoscale Secondary Ion Mass Spectrometry), and EA (Elemental Analyzer) techniques.
3. Results
3.1. Major element compositions and Fe-loss in experimental charges
The major element compositions of our experimental glasses are presented in Table S1 after recalculation to a 100% anhydrous basis. Almost all of our supra-liquidus melts are crystal-free and compositionally homogeneous, as indicated by the low standard deviations obtained (often ⩽0.4 wt%), closely matching (within analytical errors) the starting material composition (Table 1). It should be noted that some samples (e.g., F3a, F4a and G3a) show slightly higher silica and lower iron contents than the starting composition (Table 1) due to some iron-loss towards the capsule [e.g., Grove 1982; Hall et al. 2004; Kawamoto and Hirose 1994] or the crystallization of small Fe-oxides. The apparent loss or gain of FeO (all iron as FeO) was calculated as follows: for crystal-free charges and those containing a low amount of quench crystals (Table 2), the Fe-loss was estimated considering the iron content of experimental glasses (FeOgl) relative to such the starting material (FeOst) following the expression: 100∗FeOgl∕FeOst; for the three oxide-bearing charges G3a, F3a, and F4a, we performed least-square mass balance calculations to retrieve the phase proportions and iron-loss, considering the corresponding oxide and residual glass compositions. Overall, in CO2 and H2O-saturated experiments, approximately 80 to 100% of the iron was kept in the melt, except for FC4b, GC05, GC3b, and GC4b, in which the loss reaches 22–25%. Despite that the SEM inspection of these four charges did not reveal the presence of mineral phases within the glasses, we cannot rule out the possibility of an occasional crystallization of Fe–Ti oxides non-detectable by SEM (<0.5 μm in size), which could explain such slightly higher iron-loss. Glasses from G3a, F3a, and F4a charges have lower iron contents compared to the starting material, owing to the crystallization of different proportions of Fe–Ti oxides which depleted the residual melt in FeO (Table 2).
Starting compositions (wt%)
| Composition | Basanite | Phonotephrite | Basanite | Phonotephrite |
|---|---|---|---|---|
| Sample | FASa | GCHa | Fasniab | Garachicob |
| SiO2 | 45.08 | 48.06 | 44.46 | 48.56 |
| 0.14 | 0.37 | |||
| TiO2 | 3.82 | 3.15 | 3.71 | 3.09 |
| 0.13 | 0.15 | |||
| Al2O3 | 14.45 | 17.77 | 15.01 | 17.47 |
| 0.17 | 0.20 | |||
| FeOc | 12.51 | 9.43 | 12.12 | 9.32 |
| 0.27 | 0.37 | |||
| MnO | 0.28 | 0.19 | 0.19 | 0.20 |
| 0.05 | 0.07 | |||
| MgO | 7.16 | 3.98 | 7.71 | 4.05 |
| 0.22 | 0.09 | |||
| CaO | 10.82 | 8.42 | 10.68 | 8.80 |
| 0.17 | 0.14 | |||
| Na2O | 3.60 | 5.34 | 3.83 | 5.40 |
| 0.10 | 0.09 | |||
| K2O | 1.57 | 2.19 | 1.54 | 2.21 |
| 0.07 | 0.10 | |||
| P2O5 | 0.71 | 1.25 | 0.76 | 1.25 |
| 0.07 | 0.16 | |||
| Na2O + K2O | 5.17 | 7.53 | 5.37 | 7.61 |
| LOI | −0.55 | −0.34 | ||
| Total | 100 | 100 | 100 | 100 |
Compositions normalized to 100% anhydrous melt.
aOxide concentrations were measured by EPMA at ISTO-CNRS.
Standard deviations are italicized.
bOxide concentrations determined by XRF analyses at CRPG-Nancy, France, for comparison.
cTotal iron expressed as FeO.
3.2. H2O concentrations
As stated above, the water contents of our experimental glasses were analysed by FTIR and EA whenever possible. The comparison of the results shows that the retrieved H2O concentrations agree to less than 0.3 wt% H2O, even considering the associated analytical errors (Table 2) and are consistent with the measured 16OH-/28Si- ratio by the NanoSIMS. Given the similarities between the data, in the following we use the H2O contents obtained with FTIR.
For both compositions, the general trend is to increase the amount of dissolved water with pressure, from ∼2.3 wt% at 50 MPa up to 7.6 wt% at 400 MPa (Figure 2). In this case, the differences in composition of the studied materials (2–3.5 wt% in major oxides; Table 1) or imposed fO2 do not have any significant effects on water solubility. Based on the observed relationships, we have mathematically regressed the H2O content-P dependence according to expressions of the form H2Omelt (wt%) = a ∗ Pb (P in MPa) obtaining the equations shown in Figure 2. These expressions back-calculate analysed water contents to within ∼2%.
3.2.1. Determination of H2O fugacities
For any volatile species dissolved in a silicate melt that is fluid-saturated, the condition of equilibrium requires that the fugacity (f) of each species (i) in the melt equals that of the fluid, i.e., for water: fH2Omelt = fH2Ofluid. At very low pressures (1 bar) and high temperatures (>600 °C), the fugacity of a pure gas is well described by the ideal gas law. However, as pressure increases, departure from ideality occurs, which is described by the fugacity coefficient, 𝛷i. For a pure fluid (i.e., one species i), the relationship is
| (1) |
In mixed fluids, the total pressure is replaced by the partial pressure (Pi):
| (2) |
With the constraint that:
So, assuming that H2O and CO2 are the main volatile species present in the melt, we obtain the following equations:
| (3) |
| (4) |
Therefore, since according to our FTIR, NanoSIMS and EA results, all charges devoted to study water solubility in melts are CO2-free (Table 2), the fugacity coefficient of pure H2O can be calculated at the corresponding P and T using the modified Redlich–Kwong equation of state [Holloway 1977]. Then, the fH2O at given P–T of each charge is computed using the expression
| (5) |
| (6) |
Dissolved water contents in experimental glasses plotted as a function of pressure for (a) Fasnia basanite (green squares) and (b) Garachico phonotephrite (orange circles). The filled and empty symbols represent experiments performed at NNO + 1.4 and NNO + 3.2, respectively.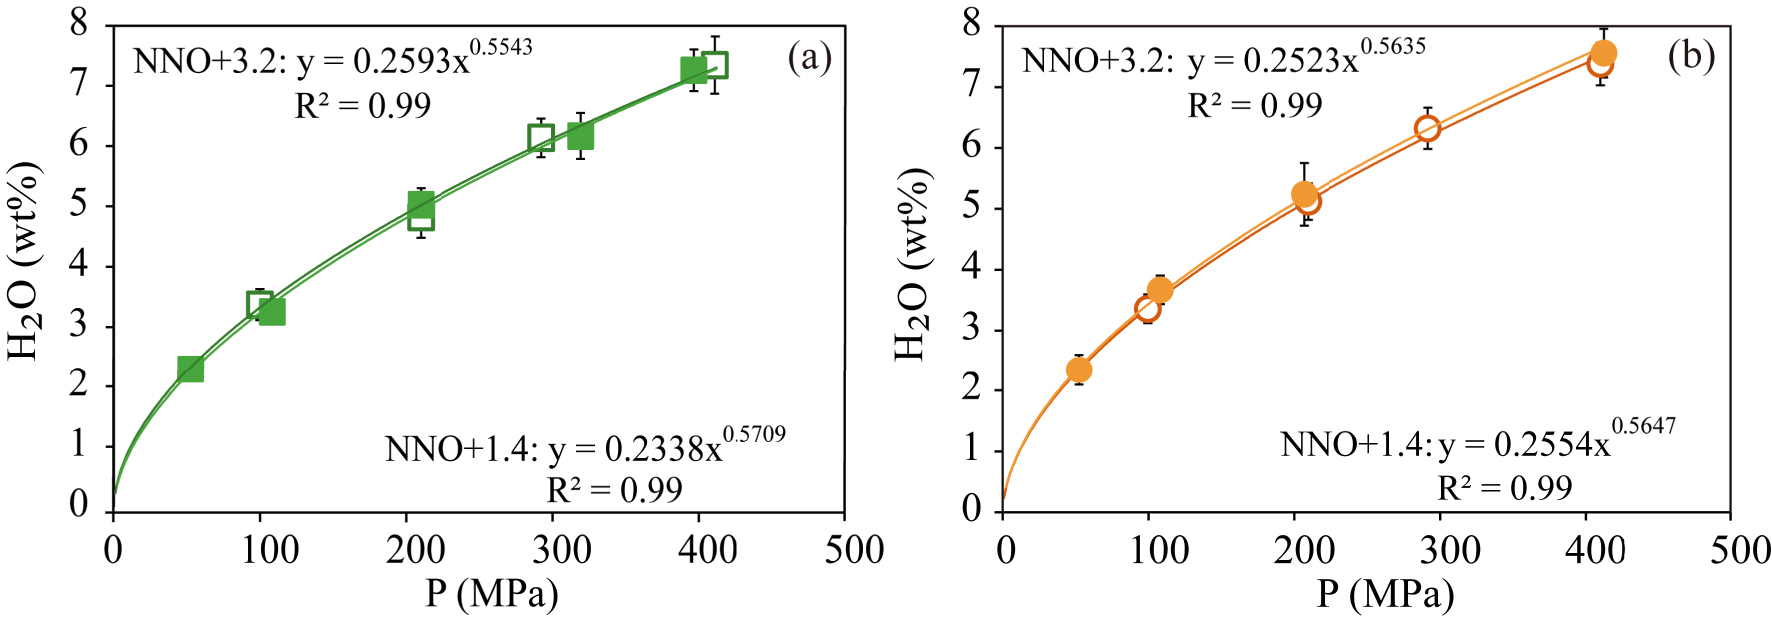
Experimental results
| Sample | P (MPa) | T a (°C) | Density (g/l)a | %FeO lossb | % Oxidesc | fH2O (MPa)d | fCO2 (MPa)d | XH2Oe | XCO2e | 𝛷H2Of | 𝛷CO2f | 𝛥NNOg | Calculated log(fO2)g | wt% H2O E.Ah | wt% H2O A3500i | wt% H2O A4500i | wt% H2O A5200i | wt% H2O 4500 + 5200i | CO2 (ppm) A1430i | Comments for run products |
|---|---|---|---|---|---|---|---|---|---|---|---|---|---|---|---|---|---|---|---|---|
| F05 | 52 | 1200 | 2748 | 0.93 | 52 | 1 | 0.99 | 1.13 | 1.40 | −6.32 | 2.54 | 2.29 | ||||||||
| 28 | 0.07 | 0.19 | ||||||||||||||||||
| F1a | 100 | 1200 | 2669 | 14.34 | 99 | 1 | 0.99 | 1.26 | 3.18 | −4.53 | 3.32 | 1.65 | 1.72 | 3.37 | ||||||
| 83 | 0.46 | 0.26 | ||||||||||||||||||
| F1c | 108 | 1200 | 2750 | 1.24 | 107 | 1 | 0.99 | 1.29 | 1.44 | −6.28 | 3.24 | 1.62 | 1.63 | 3.25 | ||||||
| 22 | 0.26 | 0.17 | ||||||||||||||||||
| F2a | 210 | 1200 | 2626 | 14.68 | 213 | 1 | 1.02 | 1.70 | 3.25 | −4.45 | 4.84 | 4.81 | 2.25 | 2.58 | 4.82 | oxides | ||||
| 65 | 0.32 | 0.60 | 0.35 | |||||||||||||||||
| F2b | 210 | 1200 | 2720 | 5.19 | 213 | 1 | 1.02 | 1.70 | 1.38 | −6.32 | 5.05 | 2.06 | 2.97 | 5.03 | ||||||
| 27 | 0.59 | 0.27 | ||||||||||||||||||
| F3a | 292 | 1200 | 2785 | 4.47* | 6.6 | 308 | 1 | 1.05 | 2.27 | 3.18 | −4.51 | 5.66 | 6.10 | 2.39 | 3.75 | 6.14 | oxides | |||
| 87 | 0.10 | 0.63 | 0.32 | |||||||||||||||||
| F3c2 | 319 | 1200 | 2727 | 4.88 | 341 | 1 | 1.07 | 2.51 | 1.34 | −6.35 | 6.03 | 1.14 | 5.03 | 6.17 | few quench crystals | |||||
| 31 | 0.75 | 0.38 | ||||||||||||||||||
| F4a | 411 | 1200 | 2690 | 4.53* | 7.3 | 464 | 1 | 1.13 | 3.62 | 3.22 | −4.44 | 6.90 | 7.20 | 1.28 | 6.06 | 7.35 | oxides | |||
| 61 | 0.29 | 0.88 | 0.48 | |||||||||||||||||
| F4b | 397 | 1200 | 2737 | 5.50 | 444 | 1 | 1.12 | 3.42 | 1.20 | −6.48 | 7.26 | quench crystals | ||||||||
| 36 | 0.35 | |||||||||||||||||||
| G05 | 52 | 1200 | 2661 | −0.39 | 52 | 1 | 0.99 | 1.13 | 1.40 | −6.32 | 2.35 | |||||||||
| 30 | 0.25 | |||||||||||||||||||
| G1a | 100 | 1200 | 2523 | 6.73 | 99 | 1 | 0.99 | 1.26 | 3.18 | −4.53 | 3.48 | 3.45 | 1.71 | 1.65 | 3.36 | few oxides | ||||
| 78 | 0.60 | 0.40 | 0.24 | |||||||||||||||||
| G1b | 108 | 1200 | 2543 | 1.32 | 107 | 1 | 0.99 | 1.29 | 1.44 | −6.28 | 3.71 | 1.98 | 1.69 | 3.67 | ||||||
| 16 | 0.47 | 0.23 | ||||||||||||||||||
| G2a | 210 | 1200 | 2533 | 5.71 | 213 | 1 | 1.02 | 1.70 | 3.25 | −4.45 | 5.15 | 4.92 | 2.57 | 2.55 | 5.12 | few oxides | ||||
| 81 | 0.05 | 0.56 | 0.30 | |||||||||||||||||
| G2b | 207 | 1200 | 2632 | 0.19 | 210 | 1 | 1.01 | 1.69 | 1.38 | −6.32 | 5.36 | 2.09 | 3.14 | 5.24 | ||||||
| 16 | 0.61 | 0.52 | ||||||||||||||||||
| G3a | 292 | 1200 | 2642 | 3.17* | 3.9 | 308 | 1 | 1.05 | 2.27 | 3.18 | −4.51 | 6.20 | 6.21 | 2.55 | 3.77 | 6.32 | oxides | |||
| 89 | 0.19 | 0.83 | 0.34 | |||||||||||||||||
| G4a | 411 | 1200 | 2567 | 6.07 | 464 | 1 | 1.13 | 3.62 | 3.22 | −4.44 | 7.45 | 7.31 | 2.75 | 4.64 | 7.38 | oxides | ||||
| 61 | 0.08 | 1.05 | 0.35 | |||||||||||||||||
| G4b | 413 | 1200 | 2551 | −1.13 | 468 | 1 | 1.13 | 3.66 | 1.20 | −6.48 | 7.25 | 1.38 | 6.18 | 7.56 | few quench crystals | |||||
| 27 | 0.90 | 0.40 | ||||||||||||||||||
| FC05 | 60 | 1200 | 2746 | 12.63 | 16 | 51 | 0.266 | 0.734 | 0.99 | 1.13 | 0.37 | −7.35 | 1.19 | 484 | ||||||
| 34 | 0.10 | 35 | ||||||||||||||||||
| FC1c | 113 | 1200 | 2787 | 15.93 | 24 | 116 | 0.214 | 0.786 | 0.99 | 1.26 | 0.14 | −7.58 | 1.49 | 1205 | ||||||
| 33 | 0.12 | 55 | ||||||||||||||||||
| FC2b | 210 | 1200 | 2748 | 20.33 | 31 | 306 | 0.145 | 0.855 | 1.02 | 1.70 | −0.30 | −8.00 | 1.70 | 2713 | ||||||
| 23 | 0.14 | 138 | ||||||||||||||||||
| FC3b | 294 | 1200 | 2771 | 16.02 | 32 | 600 | 0.102 | 0.898 | 1.05 | 2.27 | −0.73 | −8.42 | 1.72 | 4209 | ||||||
| 31 | 0.11 | 169 | ||||||||||||||||||
| FC4b | 397 | 1200 | 2779 | 22.55 | 35 | 1247 | 0.080 | 0.920 | 1.13 | 3.62 | −1.00 | −8.67 | 1.84 | 5748 | few oxides | |||||
| 19 | 0.13 | 287 | ||||||||||||||||||
| GC05 | 60 | 1200 | 2651 | 24.91 | 13 | 54 | 0.224 | 0.776 | 0.99 | 1.15 | 0.22 | −7.50 | 1.17 | 278 | ||||||
| 30 | 0.10 | 24 | ||||||||||||||||||
| GC1a | 102 | 1200 | 2669 | −1.06 | 1 | 129 | 0.011 | 0.989 | 0.99 | 1.27 | −0.52 | −8.24 | 0.30 | 620 | ||||||
| 49 | 0.03 | 49 | ||||||||||||||||||
| GC2a | 194 | 1200 | 2654 | 2.75 | 0 | 314 | 0.002 | 0.998 | 1.01 | 1.62 | −1.89 | −9.59 | 0.19 | 1291 | few oxides | |||||
| 99 | 0.02 | 146 | ||||||||||||||||||
| GC2b | 207 | 1200 | 2638 | 13.51 | 16 | 324 | 0.074 | 0.926 | 1.01 | 1.69 | −0.89 | −8.59 | 1.27 | 1419 | ||||||
| 33 | 0.11 | 93 | ||||||||||||||||||
| GC3b | 294 | 1200 | 2548 | 2.06 | 18 | 630 | 0.057 | 0.943 | 1.05 | 2.28 | −1.24 | −8.92 | 1.35 | 2166 | ||||||
| 34 | 0.12 | 134 | ||||||||||||||||||
| GC4a | 399 | 1200 | 2586 | 13.20 | 1 | 1373 | 0.002 | 0.998 | 1.12 | 3.45 | −2.16 | −9.83 | 0.25 | 3046 | few oxides | |||||
| 124 | 0.03 | 249 | ||||||||||||||||||
| GC4b | 413 | 1200 | 2555 | 24.46 | 22 | 1438 | 0.048 | 0.952 | 1.13 | 3.66 | −1.40 | −9.07 | 1.54 | 3356 | ||||||
| 27 | 0.13 | 235 | ||||||||||||||||||
Volatile concentrations used to determine the solubility equations are listed in bold type. Numbers in italic: standard deviations.
aDensity measured using Archimedes’ method.
bFe-loss estimated considering the iron content of experimental glasses (FeOgl) relative to such the starting material (FeOst) following the expression: 100∗FeOgl∕FeOst.
cProportion of oxides calculated from least squares mass balance.
dFugacities of pure water were calculated using a modified Redlich–Kwong equation of state [Holloway 1977], assuming that PH 2O = Ptot. Fugacities at given P–T calculated following the expression: fH 2O =𝛷 H 2O ∗ XH 2O ∗ Ptot. In CO2 experiments, fugacities were calculated using (7)–(10). See Sections 3.2 and 3.3 for explanation.
eMolar fraction of H2O and CO2 in fluid phase. See Section 3.2.1 for details.
fFugacity coefficients of H2O and CO2 used for each experiment.
gOxygen fugacity calculated from NiO–NiPd metallic sensors.
hElemental analyzer measurements in H2O-saturated experiments.
iFTIR measurements.
∗Fe-loss estimated after performing least-square mass balance calculations to retrieve the phase proportions and iron-loss considering the corresponding oxide and residual glass composition.
The calculated fugacities and the determined water contents were then regressed using power-law equations that allowed a close fit between both parameters (R2 = 0.99) (Figure 3), yielding for each case the following equations:
| (7) |
| (8) |
| (9) |
| (10) |
These empirical relationships allow us to calculate the water fugacities of basanitic and phonotephritic melts from Tenerife at different oxidation states considering the dissolved water contents in residual glasses or melt inclusions with an accuracy of 95%.
Relationship between water fugacity [calculated with the modified Redlich–Kwong equation of state, Holloway 1977] and dissolved water in the basanitic (a) and phonotephritic (b) melts (in wt%). Curves represent power regressions of the data (R2 = 0.99). The filled and empty symbols represent experiments performed at NNO + 1.4 and NNO + 3.2, respectively.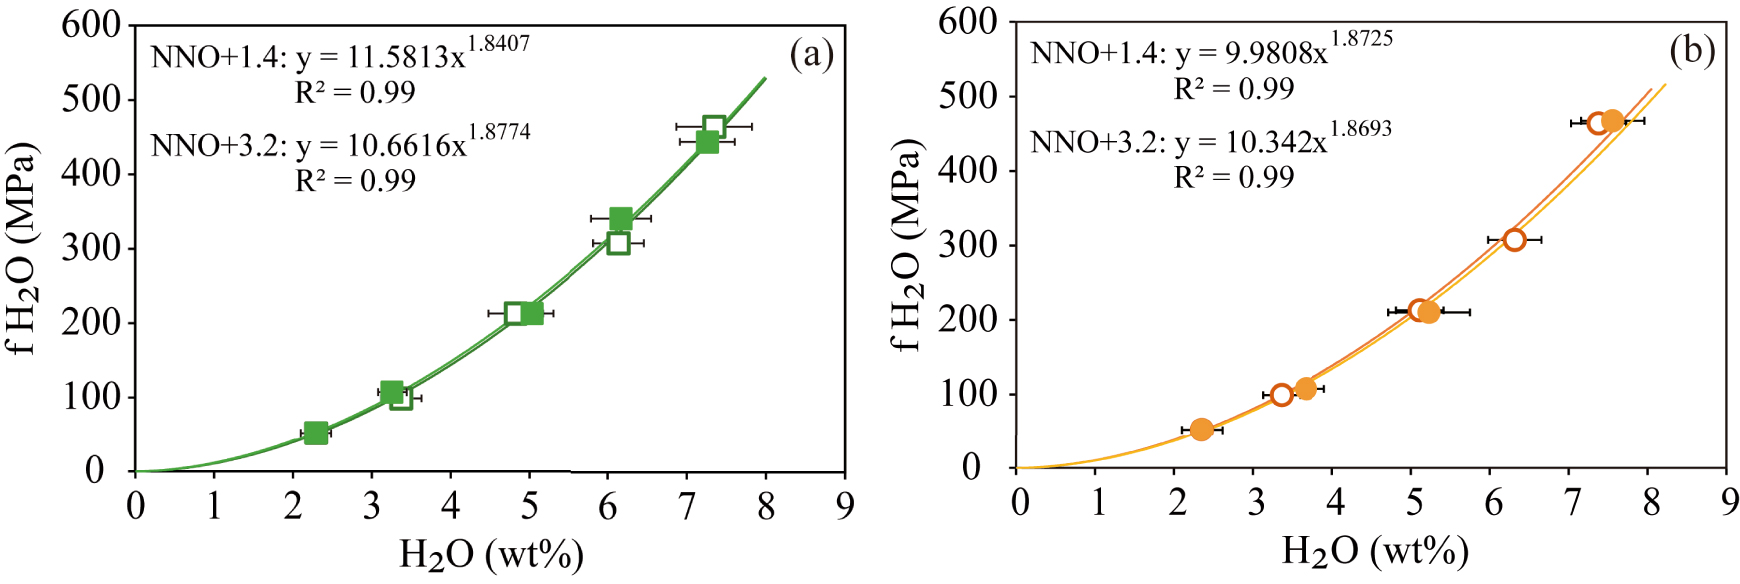
3.3. CO2
The dissolved CO2 contents that we present here correspond to those determined using the absorbances of the carbonate doublet (∼1430 cm−1 and ∼1520 cm−1) in the mid-infrared (MIR) since no molecular CO2 was detected in our experimental glasses [Blank and Brooker 1994; Botcharnikov et al. 2005; Dixon et al. 1995].
CO2 dissolved content gradually increases with pressure from 278–484 ppm at 50 MPa up to 3400–5800 ppm at 400 MPa for the phonotephrite and the basanite, respectively (Figure 4). Contrary to H2O, our results define a negative relationship between CO2 solubility and alkalinity since at a given P, the basanite dissolves up to 40–49% more CO2 than its phonotephritic counterpart (Figure 5).
Dissolved CO2 measured in the experimental glasses of the Fasnia basanite at NNO − 0.3 (green squares) and the Garachico phonotephrite at NNO − 0.8 (filled orange circles), and NNO − 1.5 (empty orange circles); for which obtained power regression laws are CO2 = 2.2202∗P1.3233, CO2 = 1.3733∗P1.2969 and CO2 = 2.7332∗P1.1709, respectively.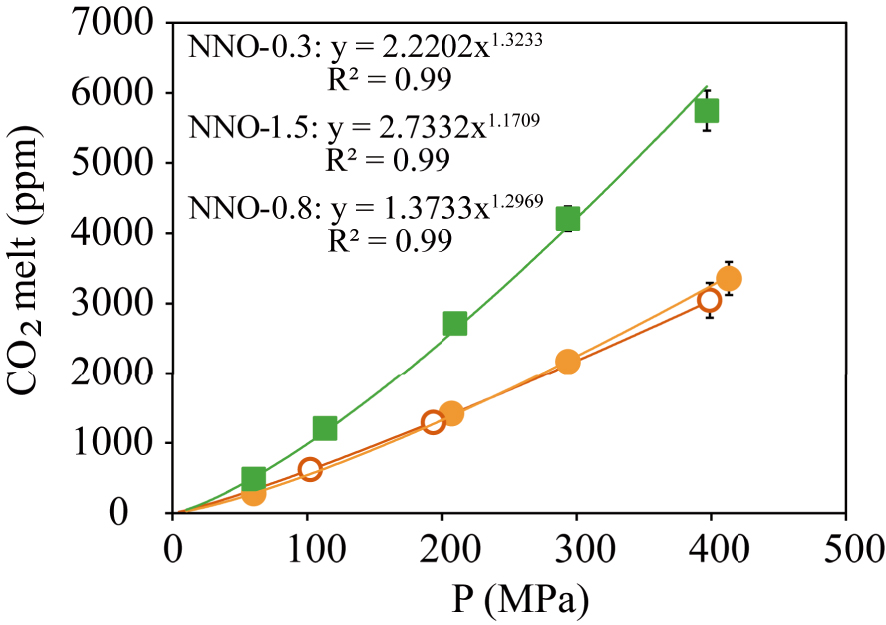
CO2 solubility plotted as a function of the melt alkalinity showing a negative correlation for our compositions. Squares correspond to the basanitic melt and circles to the phonotephritic melt. Experimental pressures are represented with different colours: light blue (50 MPa), dark blue (100 MPa), orange (200 MPa), grey (300 MPa), and yellow (400 MPa).
Even if no water was initially added to the CO2-bearing charges (Table 3), all the run products contain variable amounts of H2O, as evidenced in FTIR spectra (Figure S2c). H2O contents of CO2-bearing charges range from 0.18 up to 1.84 wt%, indicating that, despite our efforts, the experiments are not strictly CO2 pure. The presence of water can be related to the following factors [e.g., Behrens et al. 2009; Gaillard et al. 2003; Holloway et al. 1992; Lesne et al. 2011b]:
- (1) The starting glass was synthesized at relatively oxidizing conditions compared to those imposed during experiments. The re-equilibration to the new fO2 conditions generates H2O following the bulk reaction Fe2O3 + H2 ↔ 2FeO + H2O. The H2 source comes from the Ar + H2 gas used to pressurize the vessel.
- (2) To a lesser extent, during capsule preparation, both the silver oxalate used as a CO2 source and the starting glass can adsorb small but finite amounts of atmospheric water.
The combination of these factors explains the higher water contents analysed in moderately reduced experiments (fO2 ∼ NNO + 1.4) compared to their oxidized counterparts (e.g., 1.54 wt% H2O in GC4b and 0.24 wt% H2O in GC4a, Table 2).
Details of experimental capsules
| Name | P (MPa) | Mass H2O (mg) | Mass Ag2C2O4 (mg) | Mass rock (mg) | Final mass of CO2 (mg) | XH 2O | wt% H2Oa added | wt% CO2b added |
|---|---|---|---|---|---|---|---|---|
| F1a | 100 | 4.20 | − | 60.10 | − | 1.00 | 6.53 | − |
| F2a | 210 | 5.90 | − | 60.30 | − | 1.00 | 8.91 | − |
| F3a | 292 | 5.60 | − | 60.60 | − | 1.00 | 8.46 | − |
| F4a | 411 | 6.00 | − | 60.10 | − | 1.00 | 9.08 | − |
| F05b | 52 | 3.61 | − | 80.01 | − | 1.00 | 4.32 | − |
| F1c | 108 | 7.11 | − | 79.80 | − | 1.00 | 8.18 | − |
| F2b | 210 | 8.00 | − | 80.00 | − | 1.00 | 9.09 | − |
| F3c2 | 319 | 5.60 | − | 79.90 | − | 1.00 | 6.55 | − |
| F4b | 397 | 8.20 | − | 80.10 | − | 1.00 | 9.29 | − |
| G1a | 100 | 4.20 | − | 60.00 | − | 1.00 | 6.54 | − |
| G2a | 210 | 6.00 | − | 60.10 | − | 1.00 | 9.08 | − |
| G3a | 292 | 6.00 | − | 60.00 | − | 1.00 | 9.09 | − |
| G4a | 411 | 6.00 | − | 60.00 | − | 1.00 | 9.09 | − |
| G05 | 52 | 3.70 | − | 80.00 | − | 1.00 | 4.42 | − |
| G1b | 108 | 7.00 | − | 80.00 | − | 1.00 | 8.05 | − |
| G2b | 207 | 8.00 | − | 80.00 | − | 1.00 | 9.09 | − |
| G4b | 413 | 8.00 | − | 80.00 | − | 1.00 | 9.09 | − |
| FC05 | 60 | − | 0.82 | 80.01 | 0.87 | − | − | 1.08 |
| FC1 | 113 | − | 6.00 | 80.00 | 1.74 | − | − | 2.13 |
| FC2 | 210 | − | 6.10 | 80.00 | 1.77 | − | − | 2.16 |
| FC3 | 294 | − | 9.00 | 80.00 | 2.61 | − | − | 3.16 |
| FC4 | 397 | − | 9.10 | 80.00 | 2.64 | − | − | 3.19 |
| GC1a | 102 | − | 5.00 | 60.00 | 1.45 | − | − | 2.36 |
| GC2a | 194 | − | 5.00 | 60.00 | 1.45 | − | − | 2.36 |
| GC4a | 399 | − | 8.10 | 60.00 | 2.35 | − | − | 3.76 |
| GC05b | 60 | − | 3.00 | 80.00 | 0.87 | − | − | 1.07 |
| GC2b | 207 | − | 6.00 | 80.00 | 1.74 | − | − | 2.13 |
| GC3b | 294 | − | 9.00 | 80.00 | 2.61 | − | − | 3.16 |
| GC4b | 413 | − | 8.10 | 60.00 | 2.35 | − | − | 3.76 |
All represent amounts of starting material, liquid H2O, and silver oxalate (Ag2C2O4) loaded into the capsule before experimental run.
Dashes indicate that no fluid was added to the capsule.
aH2O wt.% calculated as 100*(mass H2O (mg)/mass H2O (mg) + mass rock (mg) + Final mass CO2 (mg)).
bCO2 wt.% calculated as 100*(final mass CO2(mg)/mass H2O (mg) + mass rock (mg) + final mass CO2 (mg)).
3.3.1. Determination of CO2 fugacities
The presence of dissolved water in all the CO2 experiments have allowed us to calculate their water fugacity using the power-law regressions defined above for both compositions (7)–(10). To achieve this goal, we assume that the low CO2 concentrations measured in our melts do not affect the thermodynamics of H2O dissolution [e.g., Lesne et al. 2011b].
So, once the fH 2O of each charge and the fugacity coefficients derived from the Redlich–Kwong equation of state are obtained [Holloway 1977], the corresponding water molar fraction (XH 2O) can be determined by reorganizing (5):
| (11) |
We assume an ideal mixing between real fluids (Lewis and Randall rule) rather than a real mixing since the latter has a minor effect on computed fugacity coefficients at our experimental conditions [⩽400 MPa and 1200 °C; Holloway 1977]. To calculate the molar fraction of CO2, we further assume that H2O and CO2 are the sole species present in the fluid phase [Holloway and Blank 1994; Pawley et al. 1992], so in this case
| (12) |
Therefore, the CO2 fugacity of each experiment at the given P–T conditions was determined as
| (13) |
The CO2-contents-fCO2 data base (up to 400 MPa) was used to derive third-order polynomial equations which provided the closest fit for the entire dataset (R2 = 0.99; Figure 6):
| (14) |
| (15) |
| (16) |
It is important to note that the application of these equations (14)–(16) is restricted to melt compositions, water contents (0.18–2 wt%), and pressures (50–400 MPa) similar to those investigated here.
Relationship between the CO2 fugacity of the Fasnia basanite at NNO − 0.3 (green squares) and the Garachico phonotephrite at NNO − 0.8 (empty orange circles) and NNO − 1.5 (filled orange circles), calculated with an MRK equation of state [Holloway 1977], and the amount of CO2 dissolved in the melts (in ppm). Curves represent third-order polynomial regressions of the data (R2 = 0.99). See Section 3.3 for explanation.
4. Discussion
Despite the frequent occurrence of alkaline magmas in specific volcanic settings (i.e., oceanic islands, intraplate settings), H2O solubility data of basanitic–phonotephritic melts are still scarce. Their calc-alkaline to mid-alkaline counterparts have been the focus of extensive research concerning volatile solubilities, from which various models allowing H2O–CO2 melt content to be calculated have been derived [e.g., Dixon 1997; Iacono-Marziano et al. 2012; Lesne et al. 2011a,b; Papale et al. 2006; Shishkina et al. 2014, among others]. Whereas these works highlighted the relatively minor control exerted by composition on H2O solubility in mafic melts at given P–T, this is not the case of CO2, for which variations in alkalinity, Fe-content, and oxidation state impact to various extents the solubilities of C-bearing species. For this reason, each model incorporates different compositional [i.e., 𝛱, 𝛱∗; Dixon 1997; Shishkina et al. 2014 respectively] or structural parameters [i.e., NBO/O, NBO/T; Iacono-Marziano et al. 2012; Vetere et al. 2014 respectively] to take into account the compositional effect on their calculations. However, despite their seemingly universal character, the application of existing models to a given set of H2O–CO2 melt inclusion contents results in a non-negligible difference in the calculated vapour-saturation conditions, differences between model outputs reaching in some cases ±200–400 MPa [equivalent to 6–12 km of depth, i.e., Longpré et al. 2017]. Obviously, such an uncertainty strongly impacts our understanding of the architecture of the plumbing system of the volcano, hence the interpretation of related degassing processes. Below, the aforementioned models are applied to our experimental charges and calculated H2O–CO2 contents are compared to our measurements. Our aim is not to carry out an exhaustive comparison with all existing experimental works or solubility models since this has been already performed elsewhere [i.e., Iacono-Marziano et al. 2012; Iacovino et al. 2013; Ni and Keppler 2013; Shishkina et al. 2014] but merely to evaluate the applicability of available models in the Canarian context.
4.1. Comparison with H2O experimental data
Overall, the water concentrations measured in this work are in good agreement (within errors) with those obtained on similar basanitic, alkali basalts or even mid-ocean ridge basalt (MORB) compositions at equivalent P–T conditions (Figure 7). For example, Shishkina et al. [2014] and Holloway and Blank [1994] [this last reporting data from Cocheo 1993] present H2O-saturated experiments performed on two basanites at 100 MPa and 1250 °C and 1200 °C, respectively, both containing ∼3.2 wt% H2O, an amount that closely matches those measured on our 100 MPa equivalent basanitic charges (3.3–3.4 wt% H2O at 1200 °C; Table 2). Similarly, the study of Dixon et al. [1995] performed on a MORB at 50 MPa and 1200 °C reports water contents (2.2 wt% H2O, experiment 21H) comparable to those from Fasnia basanite under the same P–T conditions (2.3 wt% H2O).
Comparison between the water contents measured in this study versus results of various other mafic to intermediate compositions at pressures from 50 MPa to 400 MPa (see Section 4.1 for explanation). Data at 500 MPa are shown for visualization. The filled and empty orange circles represent our Garachico experiments performed at NNO + 1.4 and NNO + 3.2, respectively. The filled and empty green squares correspond to Fasnia experiments performed under different fO2 conditions (NNO + 1.4 and NNO + 3.2, respectively). The solubility curves of Fasnia (green line) and Garachico (orange line) at NNO + 3.2 are shown. H2O-pure experimental results from other studies are represented as violet diamonds [Alb-1, Behrens et al. 2009], grey cross-square [Etna, Iacono-Marziano et al. 2012], yellow triangles [VES-9, ETN-1 and PST-9, Lesne et al. 2011a], green triangles [A2549-basanite, OB93-alkali basalt, Etna and MORB, Shishkina et al. 2014]. The wide range of the data comes from the different compositions used, or the H2O/CO2 ratios added initially in each study.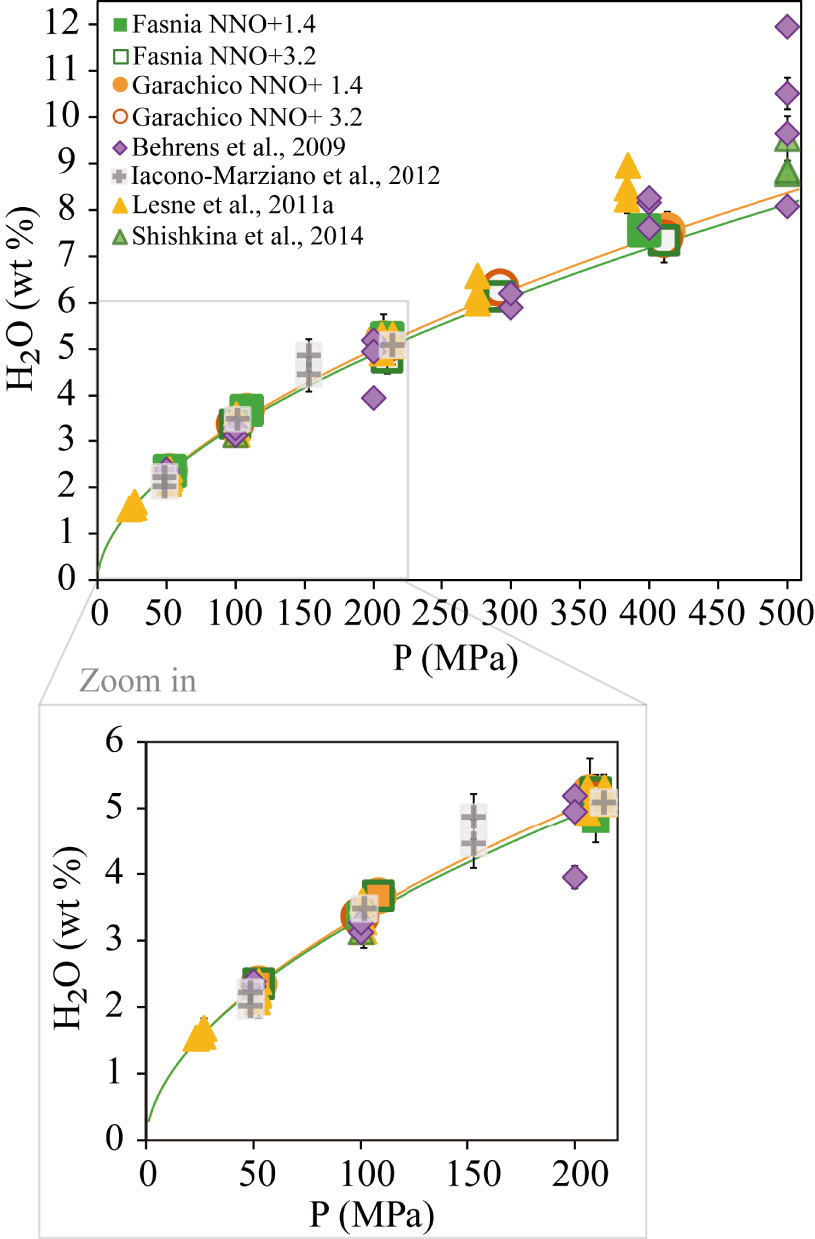
Regarding our phonotephritic composition, Figure 7 shows that up to 300 MPa it displays a similar H2O solubility compared to the K-rich phonotephritic lava from Mt. Mellone (Alban Hills, Italy) studied by Behrens et al. [2009] at 1200–1250 °C, and the alkali basalts from Lesne et al. [2011a] at 1200 °C. In contrast, our sample dissolves between 0.5 to 1 wt% less water above this pressure (>300 MPa) than the other two compositions. At first sight, the higher solubility displayed by the Behrens et al. [2009] phonotephrite above 300 MPa can be explained by its alkali-rich character (9.5 wt% K2O + Na2O) compared to the Garachico phonotephrite (7.5 wt% K2O + Na2O), as suggested by Lesne et al. [2011a]. However, Lesne et al. [2011a] determined approximately the same water content as Behrens et al. [2009] (∼8.3 wt%) at an almost equivalent pressure (384 MPa) for a tephrite which is compositionally equivalent (in terms of Na2O + K2O) to Garachico. Thus, in this case, the variations in the total alkali content of a melt cannot alone explain the different solubility trends observed above 300 MPa. In detail, the Tenerife and Vesuvius samples mostly differ by their K/Na ratios (3.1 for Ves-9 and 0.4 for Garachico), which suggests that the K-rich character of the Vesuvius compositions may be responsible for their enhanced water solubility above 300 MPa. We conclude that the total alkali content is not the sole parameter controlling water solubility, the K/Na ratio likely playing an important role on the amount of H2O that can be incorporated into alkaline mafic melts. In summary, the lack of significant differences (>1 wt% H2O) between the water contents measured on mafic to intermediate alkaline compositions, in this and equivalent studies, confirms the minor effect of magma composition on their H2O solubility at crustal P (up to 300 MPa), in particular for a given magma family [i.e., basalts sensu stricto; Lesne et al. 2011a; Shishkina et al. 2014]. We cannot rule out the possibility that at higher pressures (⩾400–500 MPa), the effect of composition on water solubility is more significant [as in Benne and Behrens 2003], but exploring volatile solubility at these conditions was beyond the scope of this study.
4.2. Application of available water-solubility models
Predicted H2O contents by the aforementioned models are listed in Table S2. Overall, for the basanitic composition, there is a good concordance (considering associated errors) between predicted and measured water contents in the pressure range 50–100 MPa. Above these pressures, we observe a slight overestimate of ∼10–15% at 200 MPa, rising to 20% as pressure increases from 300 MPa to 400 MPa.
Whereas for the previous composition, the predictions made by the three considered models progressively deviated from the experimental values, this is not the case of the phonotephrite, where back-calculated H2O contents and foretold solubility behaviour are strongly model-dependent. As for the basanite, the contents returned by the models of Lesne et al. [2011a] and Shishkina et al. [2014] at 50–100 MPa are in reasonable agreement with our measurements (Table S2). However, above these pressures, the two empirical equations proposed by these authors overestimate the measured values in our experimental melts; the maximum observed differences (1–2 wt%) were obtained at 300–400 MPa.
Conversely, the Iacono-Marziano et al. [2012] empirical equation systematically underestimates measured water contents by 0.5–1.2 wt% for the phonotephritic melt. In general, the three models better predict the solubility of water in basanitic melts (±1 wt%) compared to phonotephritic compositions at conditions up to 300 MPa.
4.3. Comparison with other CO2 or H2O–CO2 experimental studies
Only a few studies have explored in some detail the CO2 solubility behaviour of basanites and phonotephrites at crustal P–T conditions [Behrens et al. 2009; Holloway and Blank 1994; Shishkina et al. 2014; Allison et al. 2019].
As previously mentioned, our results define a negative relationship between CO2 solubility and alkalinity (Figure 5). This trend is in contrast with the results obtained in similar works, in which a positive relationship between alkalinity and dissolved CO2 was observed [Lesne et al. 2011b; Shishkina et al. 2014]. A similar (but less apparent) relationship is observed between CO2 content and the aluminium saturation and agpaitic index, or NBO/O but, based on the poor correlation existing between the different parameters (R2 = 0.6 in the first case and R2 < 0.5 in the last two), we do not recommend their use for describing the CO2 solubility in this type of magmas.
To a first order, the difference between previous works and our results can be related to the compositional variations of the starting materials used in each study, which in some cases exceeds 20% relative [i.e., Na2O + K2O, FeO; CaO; Behrens et al. 2009; Dixon 1997; Lesne et al. 2011b; Moore 2008; Vetere et al. 2014]. These differences highlight again the strong control that magma composition exerts on CO2 solubility, a factor that should be carefully considered when applying H2O–CO2 solubility laws that were not specifically calibrated for the target composition.
From a more general perspective, we observe a good correspondence between the CO2 contents measured in our basanite and that of Shishkina et al. [2014]; however, at 300 MPa, the basanite of Shishkina et al. [2014] incorporates up to 1300 ppm more than our starting material (Figure 8). In contrast, the basanite of Holloway and Blank [1994], systematically dissolves lower contents (∼807 ppm CO2 at 1200 °C and 100 MPa) compared to the two other basanites. The most significant difference between the three compositions is their CaO content: a positive relationship is indeed observed between CaO and the glass CO2 contents.
Comparison between the CO2 contents measured in this study and the experimental results from other mafic to intermediate melts with no water added. The empty orange circles represent our phonotephritic composition at NNO − 0.8 and its solubility curve (orange line). The empty green squares correspond to the basanitic composition at NNO − 1.5 and its solubility curve (green line). Results from other studies correspond to violet diamonds [Alb-1, Behrens et al. 2009], grey cross-square [Etna, Iacono-Marziano et al. 2012], yellow triangles [VES-9, ETN-1 and PST-9, Lesne et al. 2011a], green triangles (A2549-basanite, OB93-alkali basalt, Etna and MORB, Shishkina et al. 2014] and blue square [basanite from Holloway and Blank 1994]. The wide range of certain data comes from the different compositions used in those studies. See Sections 4.3 and 4.4 for more explanations.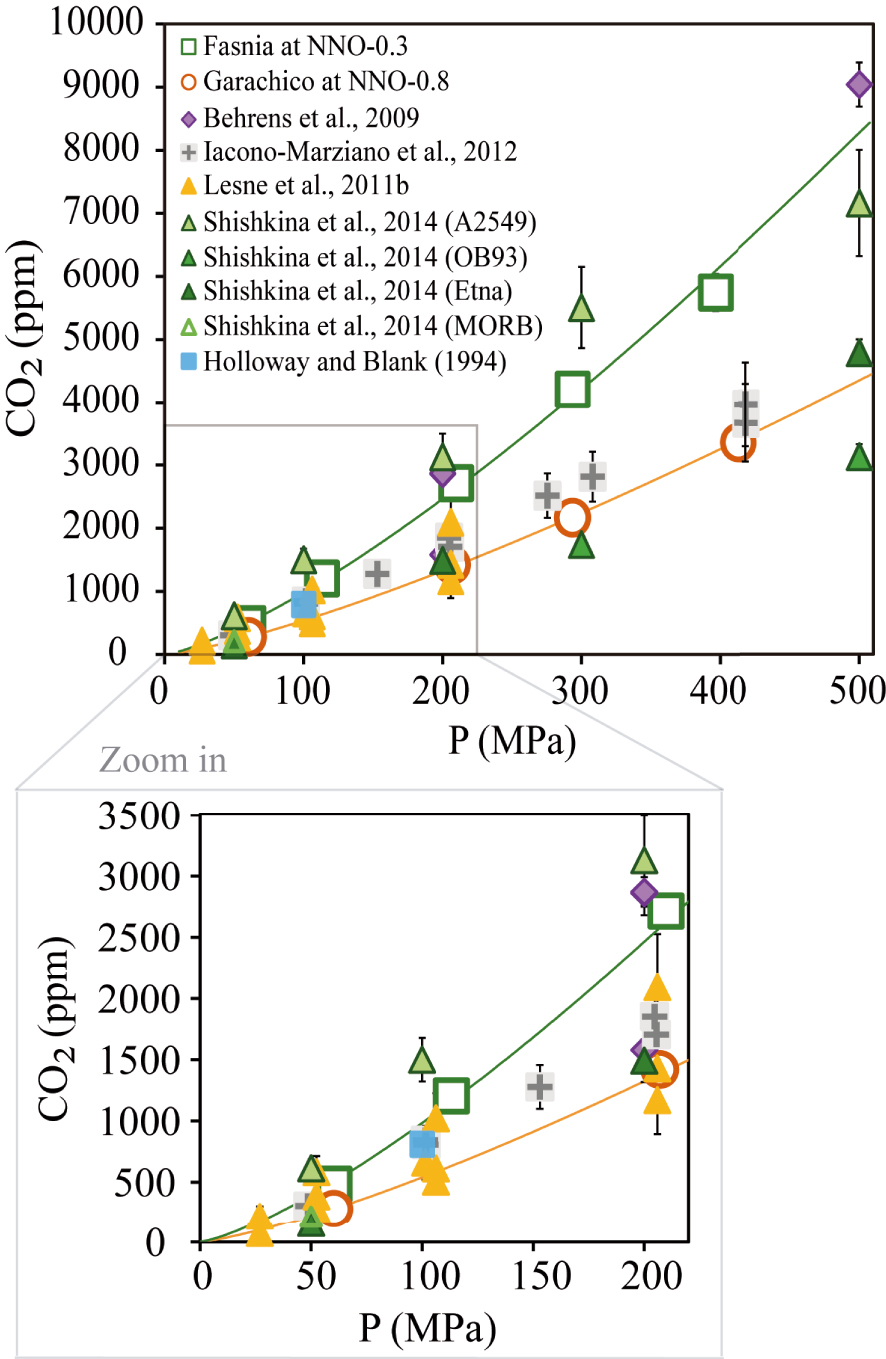
The effect of magma composition in controlling CO2 solubility is also seen for the phonotephrite: Behrens et al. [2009] identified K as an element that enhances CO2 solubility [see also Scaillet and Pichavant 2005]. At 200 MPa and 1200–1250 °C, their phonotephrite (with 5 wt% more K2O) dissolves 2870 ppm CO2 compared to 1291 ppm for Garachico (Table 2). However, the compositional difference between both phonotephrites is also due to CaO which, in the melt of Behrens et al. [2009], is ∼3 wt% higher than in our sample. Thus, the combined effects of CaO and K2O likely explain the differences in the CO2 solubilities as already pointed out by previous studies [e.g., Behrens et al. 2009; Botcharnikov et al. 2006; Lesne et al. 2011b; Liu et al. 2005; Moore 2008].
Correlation of the 𝛱 parameter [Dixon 1997] with (a) the dissolved CO2 contents measured in Fasnia, Garachico, and other mafic melts [MORB, Kilauea, basanite, and leucitite from Dixon 1997] at 100 MPa and 1200°; and (b) the silica content of each composition.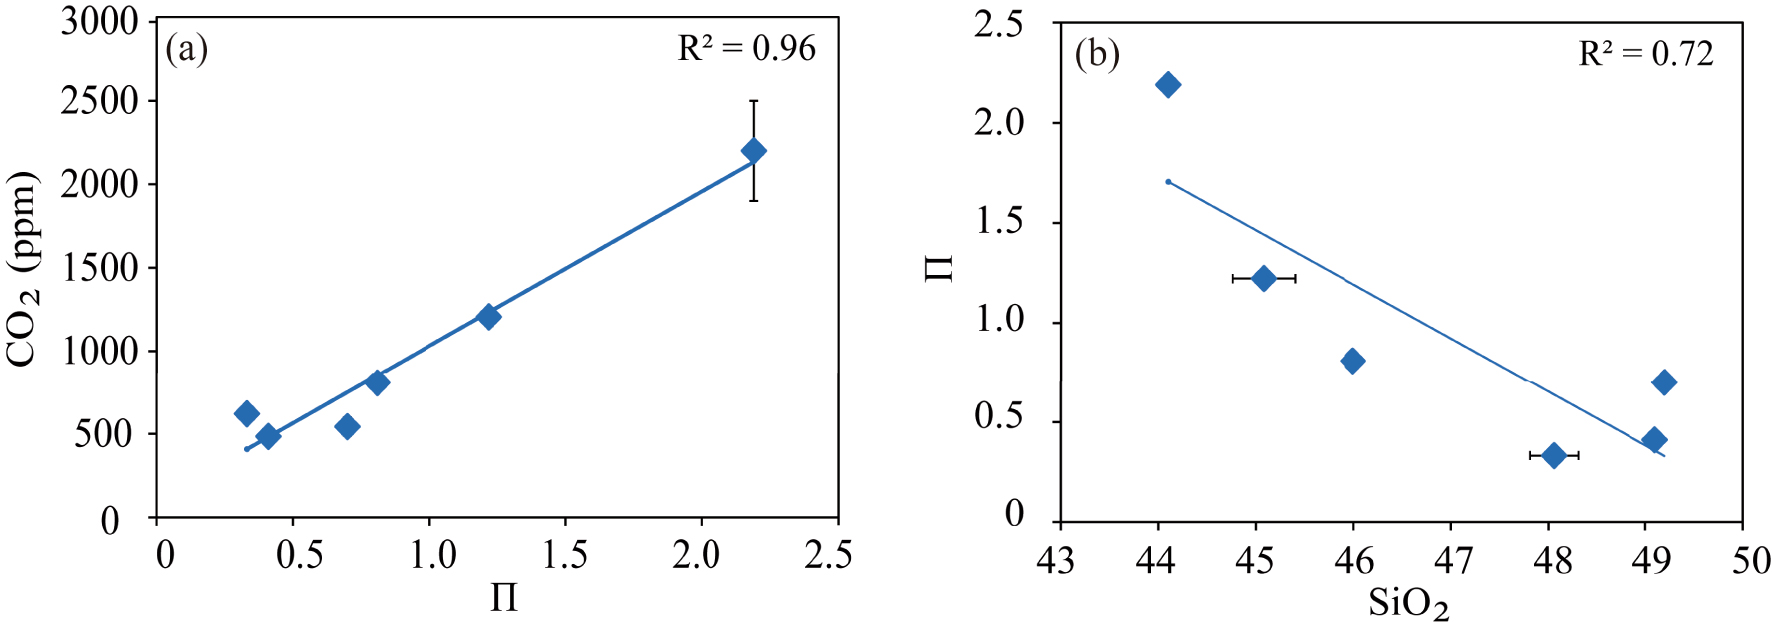
4.4. Application of available CO2 or H2O–CO2 solubility models
For CO2, we have tested three different models to verify their ability to reproduce the CO2 contents of our experimental runs and hence, their applicability to the Canary Islands magmas (Table S2). The first model we checked is that of Dixon [1997], who, to calculate the CO2 solubility in alkaline magmas, proposed an empirical equation that incorporates a compositional parameter (𝛱) to account for both the ability of the different network modifier elements to form carbonate species and the degree of melt depolymerization.
In Figure 9, we plot the factor 𝛱 of Dixon [1997] against the CO2 concentrations analysed in our two compositions at the P–T conditions considered by this author, and we obtained a similar linear relationship between both parameters. However, this trend cannot explain the difference in the CO2 concentrations calculated by Dixon’s model for our basanitic and phonotephritic melts. Whereas for the former, the parameterization yields a content that closely matches the one measured here (1222 and 1205 ppm CO2, respectively), for Garachico phonotephrite, Dixon’s model predicts a CO2 content twice less the measured value (332 ppm CO2 instead of 620 ppm CO2 measured). To explain such a difference, we hypothesize that in our samples, the order of increasing ability of a cation to enhance CO2 solubility may be different from that assumed by Dixon [1997] [Ca2+ > K+ > Na+ ≫ Mg2+ ≈ Fe2+, according to Spera and Bergman 1980]. Therefore, the role played by the different cations may vary depending on magma composition and P–T–fO2 conditions. The other possibility is that the model of Dixon [1997] was calibrated using the data obtained on the basanite of Holloway and Blank [1994], which as stated before, dissolves less CO2 than Fasnia basanite at the same P–T conditions (see above). However, the detailed study of cation effects on CO2 solubility is beyond the scope of this work.
H2O and CO2 solubility data from the experiments of (a) the Fasnia basanite (green squares) at NNO − 0.3 and (b) the Garachico phonotephrite (orange circles) at NNO + 0.8, compared with the predicted solubility curves (lighter coloured lines) calculated with the H2O–CO2 model of Iacono-Marziano et al. [2012] at 1200 °C, pressures between 50 and 400 MPa, different water molar fractions (from XH 2O = 0 to XH 2O = 1) and the starting compositions (in Table 1). Lighter coloured error bars represent the uncertainties associated with the Iacono-Marziano’s model at 400 MPa (in blue), 300 MPa (in yellow), and 200 MPa (in grey) for water molar fractions of 0.1, 0.2, and 0.3, respectively, and are shown at the right side of the diagram. Diamonds represent H2O–CO2 contents measured in the Etna experimental glasses by Iacono-Marziano et al. [2012] and the different colours correspond to different pressures as described below. Thick and darker coloured lines correspond to isobars obtained in this study for different pressures 50 MPa (in light blue), 100 MPa (in orange), 200 MPa (in grey), 300 MPa (in yellow), and 400 MPa (in dark blue). Symbol error bars indicate the uncertainty of FTIR measurements (propagated errors). There is a significant overestimation of the H2O solubility at XH 2O = 1 in the basanitic melt and the CO2 solubility in the phonotephritic melt (see Section 4.4 for details).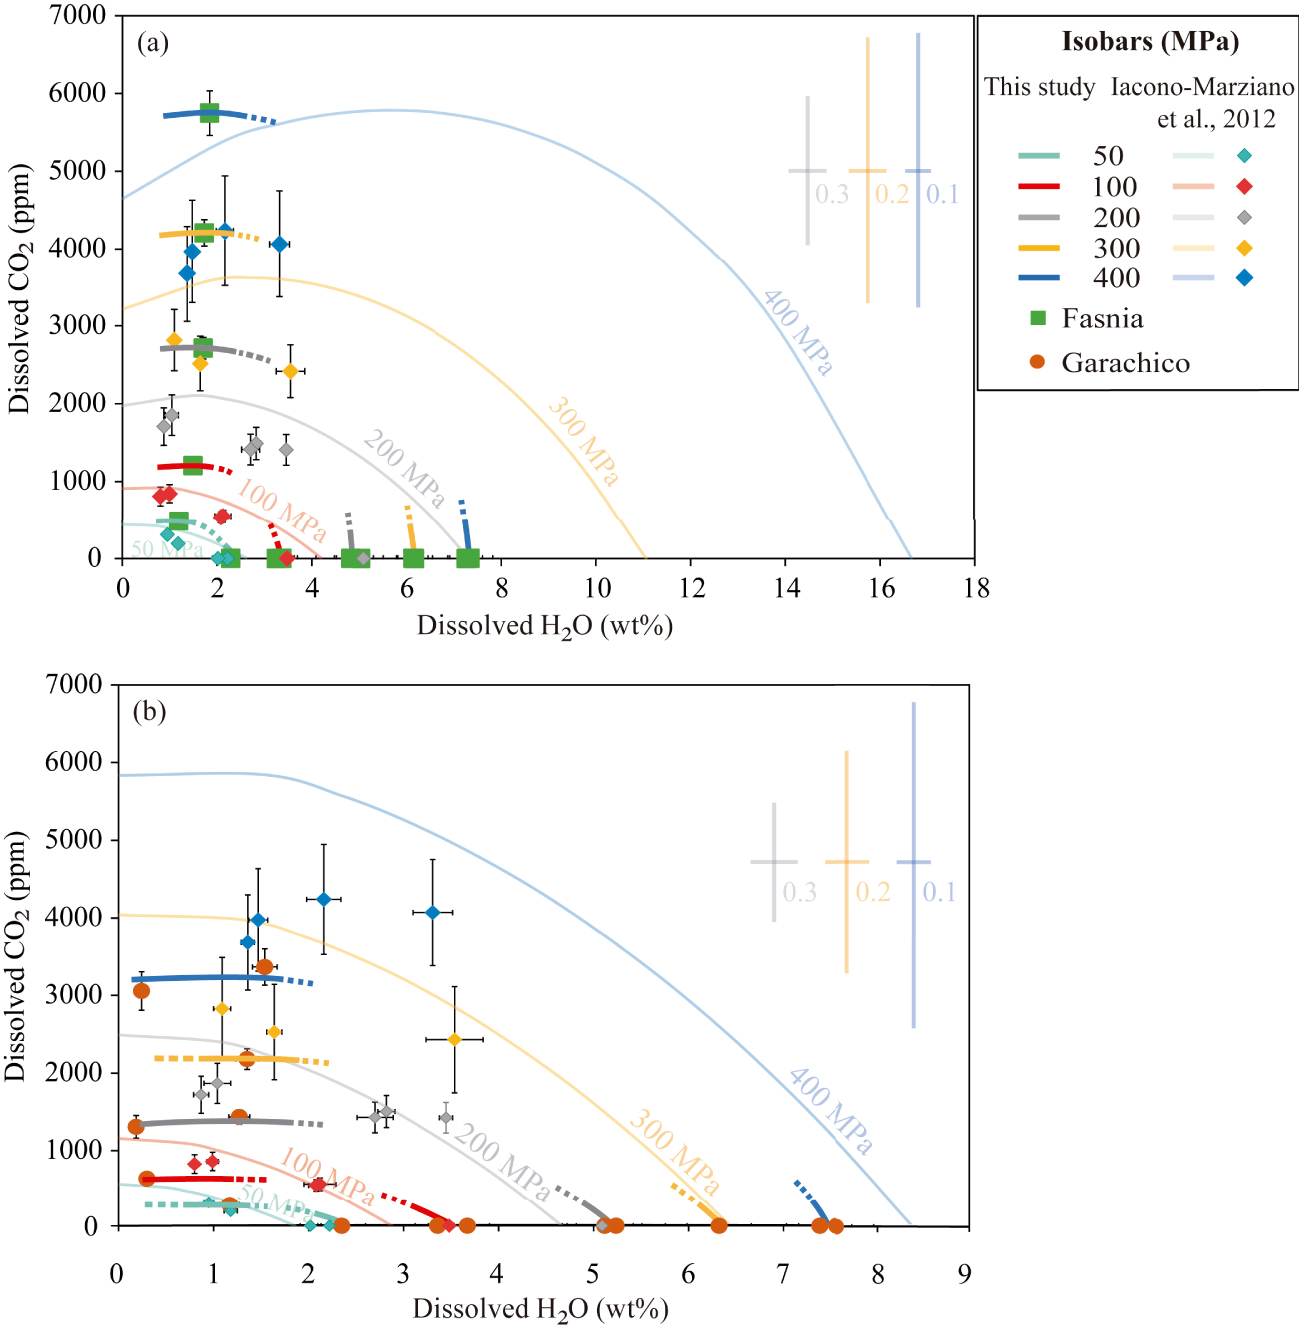
The second model considered here is the one of Shishkina et al. [2014], who explored the solubility of this gas species over a large range of magmatic compositions (42–51 SiO2 wt%) and P–T conditions between 50–500 MPa and 1200 to 1250 °C. These authors derived a new equation to calculate the CO2 content in magmatic melts (see this work for further details), which incorporates an updated parameterization of the 𝛱 factor of Dixon [1997] termed 𝛱∗ since the former is derived from a narrower range of magma compositions (40–49 SiO2 wt%) and requires normalization at 100 MPa. Therefore, Shishkina et al. [2014] fitted an exponential equation in terms of ln (CO2) as a function of 𝛱 (or 𝛱∗) and ln P to predict the CO2 solubility over the explored range of compositions. Overall, this model predicts lower than observed CO2 contents for the Fasnia basanite and Garachico phonotephrite, with differences achieving >20% above P⩾ at 200 MPa (Table S2).
Third, we have tested three variants of the Iacono-Marziano et al. [2012] model for our compositions at 1200 °C and pressures from 50 to 400 MPa: (1) CO2 solubility model as a function of pressure (H2O-free system), (2) H2O–CO2 solubility model that considers the composition of the fluid phase (XH 2O), and (3) equilibrium pressures at 1200 °C for given H2O and CO2 contents in the melt. Model predictions were calculated using the web application of Iacono-Marziano et al. [2012] under the mentioned P–T conditions. Input uncertainties were: ±5 °C, ±20 bars and the standard deviation associated with the EPMA analysis of each major element oxides.
In the first case, the model underestimates the CO2 solubility in the basanitic melt by 15–20%, the higher differences arising at 400 MPa. Contrarily, for the phonotephrite, the first variant of the model highly overestimates the CO2 contents, exceeding 50% in some cases (Table S2). Similar variations are also observed in CO2 contents calculated for the Garachico phonotephrite using the mixed H2O–CO2 model. Comparatively, as for the first variant, the mixed model slightly underestimates the CO2 solubility by 10–20% for our basanitic charges.
The solubility curves were computed with the H2O–CO2 model for water molar fractions varying from XH 2O = 0 to XH 2O = 1. As shown in Figure 10 and Table S2, the model yields contrasted results depending on the composition and the volatile species considered in the calculations. Surprisingly, the mixed solubility calculations return H2O and CO2 contents for our experiments that differ considerably from those predicted by the pure-volatile solubility variants, but in better agreement (10–20%) with our results (see above).
For the Fasnia basanite, the H2O–CO2 model predicts extremely high solubilities and saturation pressures for pure H2O and mixed-volatile runs, increasing the differences in the back-calculated contents by up to 30–50% as the pressure rises (i.e., 16 wt% H2O at 400 MPa; Figure 10a). Comparatively, the differences with the experimental values are relatively lower when the phonotephritic composition is used in the calculations, since saturation pressures and volatile contents differ by 10–40%. However, for these samples, results from the CO2 solubility model are doubled compared to experiments (Figure 10b). This is not a trivial difference, since the isobars predicted by the Iacono-Marziano’s model clearly differ from those determined in our CO2-saturated experiments.
Another important issue that needs to be considered when using the mixed equation of Iacono-Marziano et al. [2012] is the errors associated with the calculated CO2 contents, which at pressures above 100 MPa, exceed 1000–2000 ppm (Figure 10, Table S2). If these errors are projected on the mixed H2O–CO2 solubility isobars (see error bars associated with the solubility curves for a given pressure and water molar fraction in Figure 10a, b), the uncertainty in the location of a given isobar over the H2O–CO2 diagram proportionally increases with pressure and H2O content. This results in an important overlapping of the curves at P⩾200 MPa. Neglecting the associated CO2 errors will have important consequences, not only when applying the H2O–CO2 model to calculate the saturation and entrapment pressures of melt inclusions having basanitic–phonotephritic compositions but also for the interpretation of storage conditions and associated degassing processes: errors of ±1000 or 2000 ppm translate into depth differences of up to 6 km (see Figure 10). For this reason, we do not recommend the use of this model to calculate H2O–CO2 solubilities of mafic to intermediate magmas from Canary Islands, since these compositions are outside the range considered by Iacono-Marziano et al. [2012], as also pointed out by Shishkina et al. [2014].
Finally, we tested the equilibrium pressure model of Iacono-Marziano et al. [2012] to back-calculate the equilibration or entrapment pressure of a given melt (i.e., MI) when H2O and CO2 contents are known. Results obtained for our H2O-saturated experiments are underestimated by 20–50% for the basanitic melts (at 50–400 MPa) and overestimated by ∼10–40% in the phonotephrite at 50–300 MPa, whereas at 400 MPa, the model underestimates it. For the CO2-saturated experiments, model predictions yield similar pressures for our basanite (within 10–20%) but underestimate by ∼30% the phonotephritic melt (Table S2).
4.5. Application of the empirical power laws to melt inclusions data from El Hierro, Canary Islands
The Canary Islands are an important alkaline group of oceanic volcanoes which have been the focus of a large number of volcanological studies. Up to recently there was limited knowledge of the magmatic volatile budget associated with this system [e.g., Gurenko and Schmincke 2000; Hansteen et al. 1991, 1998; Wallace 1998]. Yet, the recent eruption of El Hierro in 2011–2012 has provided a unique opportunity to fill this gap [e.g., Longpré et al. 2017].
Our experimental results allow us to revisit samples of the 2011–2012 submarine eruption at El Hierro, Canary Islands [Longpré et al. 2017], and those from young (<20 ka) tephra collected at different locations in El Hierro [Taracsák et al. 2019], owing to the compositional similarities between the bulk-rock, MI, and our starting materials. As a first step, we have used the amounts of CO2 + H2O dissolved in the MI which give minimum entrapment pressures [e.g., Esposito et al. 2011, 2014; Gennaro et al. 2019; Steele-Macinnis et al. 2011]. However, MIs often have vapour bubbles containing a substantial portion of bulk volatiles [e.g., Moore et al. 2015; Rose-Koga et al. 2021], so, whenever possible, the restored CO2 concentrations (dissolved + exsolved) were considered in our calculations. We note that even if the investigated MI contained detectable amounts of S, Cl [Longpré et al. 2017; Taracsák et al. 2019], these volatiles are considered to have a minor effect on calculated pressures [e.g., Lesne et al. 2011c], though their consideration would inevitably increase calculated P values [e.g., Lesne et al. 2015].
4.5.1. The 2011–2012 submarine eruption at El Hierro
This is the most recent eruption of the Canary archipelago and the first to be fully monitored in real time [López et al. 2012]. Magma products emitted during this eruption were petrologically characterized by different authors [Martí et al. 2013b; Meletlidis et al. 2015, among others] but only Longpré et al. [2014, 2017] analysed the melt inclusions (MIs) trapped in phenocrysts (mainly olivines). MIs are basanitic–phonotephritic in composition [42–50 wt% SiO2; Longpré et al. 2014], contain remarkably high concentrations of dissolved volatiles, with up to 3420 ppm CO2, 3 wt% H2O, and 5080 ppm S [Longpré et al. 2017]. Saturation pressures were previously calculated in this study using the models of Iacono-Marziano et al. [2012], Newman and Lowenstern [2002], Papale et al. [2006] and Shishkina et al. [2014]. Depending on the model, the retrieved pressures vary from 260 to 630 MPa; however, for consistency with the applied degassing software [D-compress, Burgisser et al. 2015] Longpré et al. [2017] considered only the results given by the Iacono-Marziano et al. [2012] model, since this was already implemented in the above software. This gave a more restricted entrapment pressure range between 7 to 260 MPa for olivine hosted MIs, corresponding to depths ⩽10 km beneath El Hierro. Additionally, Longpré et al. [2017] calculated H2O–CO2 solubilities as a function of pressure at 1150 °C for the 2011–2012 average matrix glass composition.
In order to compare these data with our results, we assume that the possible variations in the H2O–CO2 solubility for a temperature difference of 50 °C are within the associated error [Holloway and Blank 1994].
The application of our basanitic empirical solubility laws to the 2011–2012 El Hierro melt inclusions yields entrapment pressures between 11 and 280 MPa, with a maximum difference of +33 MPa (∼1.5 km) compared to those determined by Longpré et al. [2017]. In both cases, the distribution of H2O–CO2 suggests that these magmas experienced a continuous degassing from 260–280 MPa down to 50–100 MPa (Figure 11). Although Longpré et al. [2017] have not analysed the inclusion-hosted bubbles, they have obtained a theoretical estimate of how much CO2 may be sequestered in the bubble using the method of Shaw et al. [2008]. From 29 theoretically reconstructed MI, we can apply our model to 15 MI with ⩽6153 ppm CO2 (which fall within our calibrated range), resulting in very similar entrapment pressures. Only two of them give P > 280 MPa, corresponding to 337 and 432 MPa (Figure 11). These new pressures are in full agreement with petrological and seismic data, which indicate a storage/re-equilibration level at 10–15 km [López et al. 2012; Martí et al. 2013b].
H2O and CO2 solubility curves determined in basanitic experimental glasses (thick lines) at 50 MPa (in light blue), 100 MPa (in red), 200 MPa (in grey), 300 MPa (in yellow), and 400 MPa (in dark blue), compared to solubility curves calculated by Longpré et al. [2017] with the model of Iacono-Marziano et al. [2012] (dashed grey lines). Green squares represent the basanitic glasses from this study. Green, orange, and blue circles correspond to olivine-hosted MI glass phases, reconstructed MI (bubble + glass), and averaged matrix glass composition from El Hierro 2011–2012 eruption, respectively (Figure 4a in Longpré et al. [2017]). Solubility curves from Longpré et al. [2017] are moderately overestimated compared to the isobars of this study. Melt inclusions distribution suggests a continuous degassing from pressures of 260–280 MPa down to 50–100 MPa.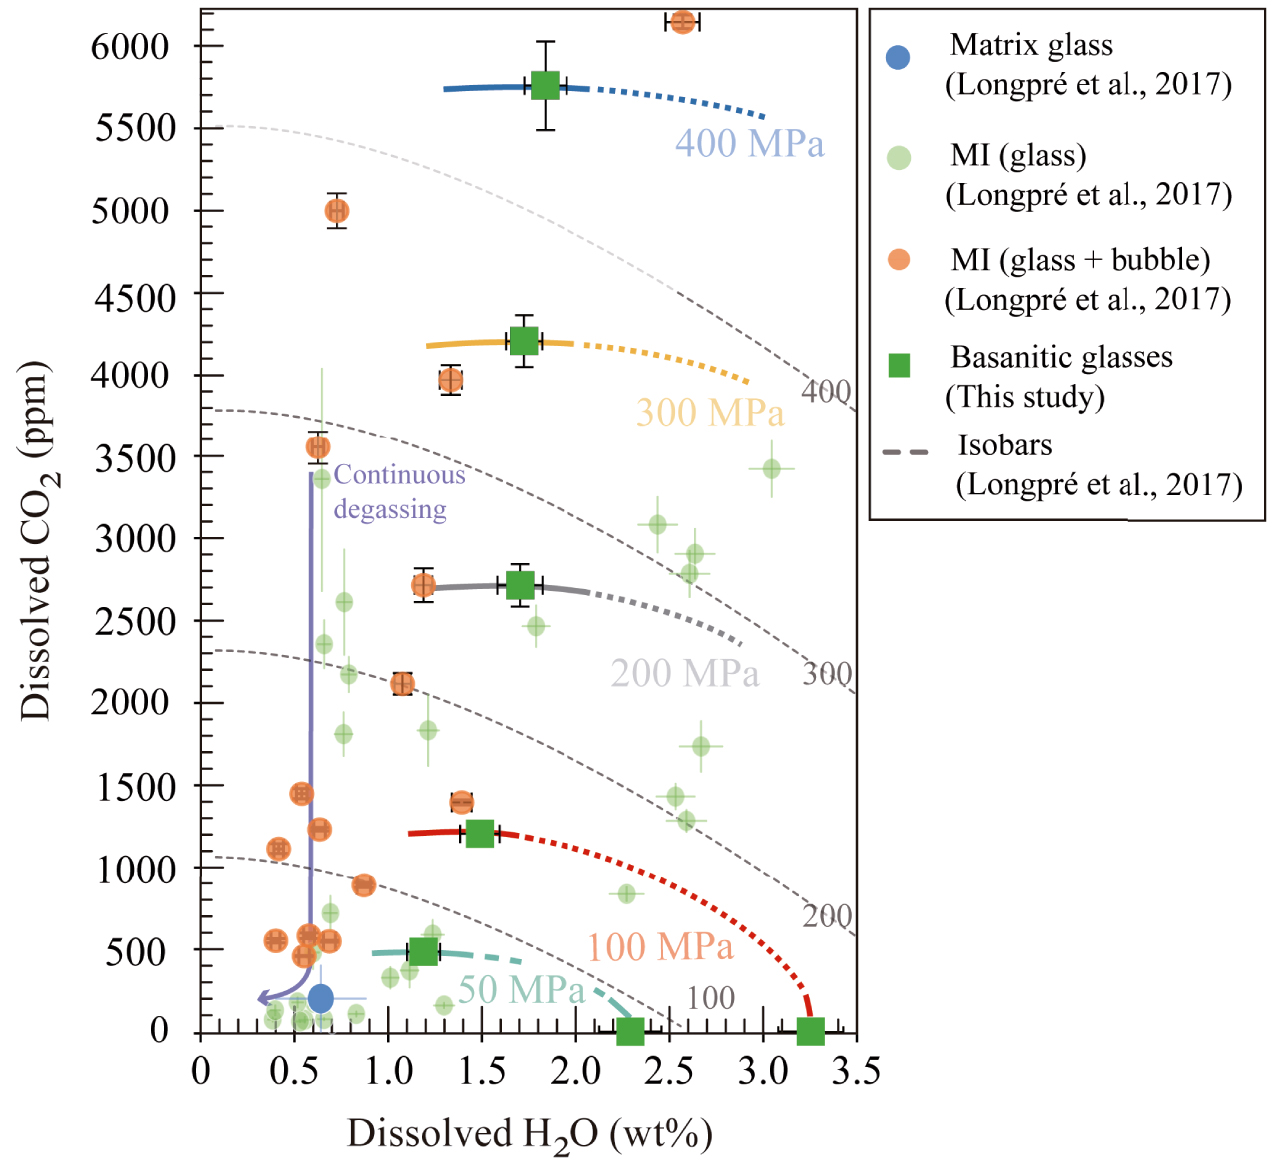
The other set of 14 MI yields reconstructed CO2 contents between 0.8–1.3 wt% to up to 2.3 wt%, which prompted the authors to estimate entrapment pressures ⩾1 GPa, equivalent to depths ⩾30 km. Whereas those MI containing 0.8–1.1 wt% CO2 would represent magmas rising from deep levels (600–800 MPa or 20–25 km), in line with information gained from fluid inclusions, cpx–melt geobarometry and volcano-tectonic seismicity [Hansteen et al. 1991, 1998; Klügel et al. 2015; Longpré et al. 2014, 2017; López et al. 2012], those with CO2 concentrations between 1.3–2.3 wt% are more problematic to interpret since they point to entrapment levels amid 1–2 GPa (⩾30–40 km) using the solubility data of Holloway and Blank [1994] for basanitic compositions. Such pressures–depths clearly exceed those recorded by other methods during the unrest episode [Domínguez Cerdeña et al. 2013; López et al. 2012].
4.5.2. Information gained on young (<20 ka) basanites from El Hierro
To test if the previous 2011–2012 volatile contents are representative of the recent (<20 ka) mafic volcanism of El Hierro, Taracsák et al. [2019] analysed the composition and volatile contents of MIs from tephra samples collected at different locations on El Hierro island. Most of the analysed MIs have H2O and CO2 contents comparable to those analysed in the recent 2011–2012 eruption (Figures 11–12), varying mainly between 0.1–2 wt% and <2500 ppm, respectively. The relatively high MI volatile contents (i.e., CO2 up to 3600 ppm and S up to 4290 ppm) along with the occasional presence of large bubbles (>10 vol.%) within MI suggest that the different magmas were volatile-saturated at the time of entrapment. However, independently of their volatile endowment, almost all the considered magmas experienced a similar degassing during their ascent towards the surface (Figure 12). Taracsák et al. [2019] also used D-compress [Burgisser et al. 2015] to calculate both the mixed H2O–CO2 solubility isobars and melt inclusion volatile saturation pressures at 1200 °C. In this case, the highest volatile saturation pressures calculated for their MI fall between 150–355 MPa (6–13 km) or 350–700 MPa (13–24) km, depending on whether the CO2 dissolved in the MI glass is only considered or that stored in bubbles is also into account.
Comparison between H2O–CO2 contents from olivine- and clinopyroxene-hosted basanite melt inclusions from El Hierro, Canary Islands [Taracsák et al. 2019] and the H2O–CO2solubility curves (dashed lines) determined for our basanitic melt (green squares) at pressures from 50 MPa to 400 MPa. Light blue circles represent MI glass phases and orange circles correspond to reconstructed melt inclusions (bubble + glass). Coloured borders indicate pairs of unreconstructed and reconstructed MI. Most melt inclusions (glass phases) are located between the 100–200 MPa isobars (equivalent to 3–6 km), whereas the restored MI gives higher pressures (280–440 MPa).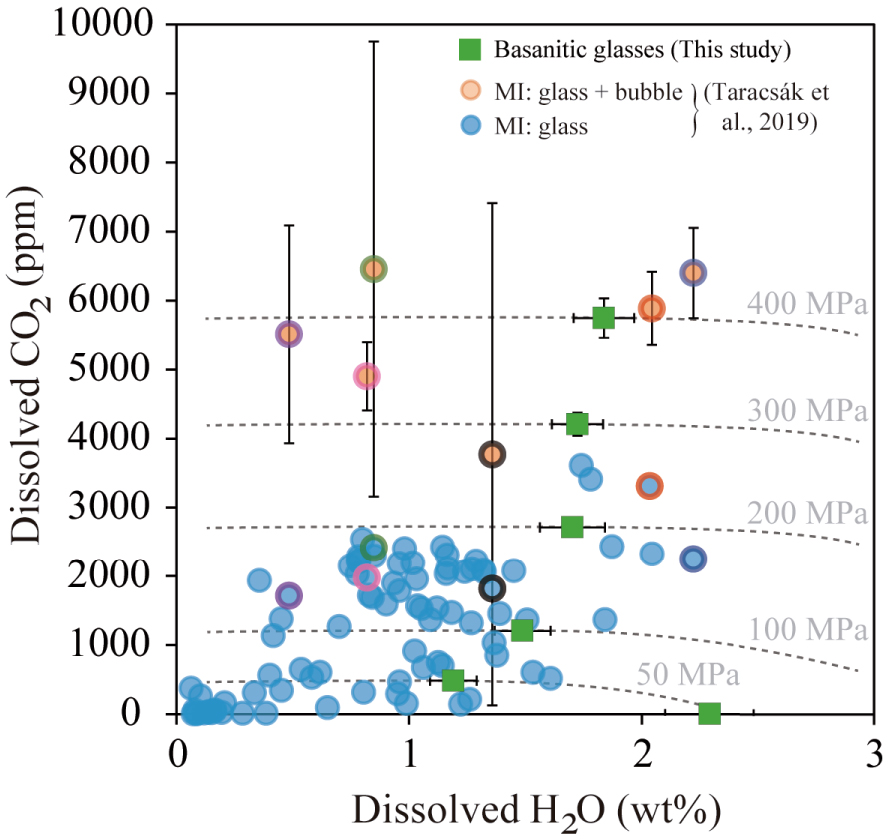
Similar to the recent 2011–2012 eruption, we applied our empirical laws to determine MIs entrapment pressures. For the <20 ka eruptions, our calculations (using only dissolved H2O and CO2 contents of MI) yield somewhat lower P-saturation values, from 16 to 258 MPa (Figure 12), most of the data falling between the 100–200 MPa isobars. This implies a difference in the equilibration conditions for the MI glass of ∼100 MPa, or equivalent to 3–4 km depth. Regarding the restored volatile contents of melt inclusions (i.e., glass + bubble CO2), Taracsák et al. [2019] have studied 47 inclusion-hosted bubbles, 25 of which contained detectable CO2. Of these, 8 MI glass phases were also analysed, and the entrapment pressures for the 6 MIs with CO2 falling within the calibrated range of the empirical equations, vary between 262 and 443 MPa (or 8–13 km depth). Two MIs have CO2 contents (0.9–1.2 wt%) outside model calibration range. Using the data of Holloway and Blank [1994], these high CO2 contents suggest deeper entrapment levels at ∼1 GPa (∼30 km).
In summary, our results suggest that the last, but also recent (<20 ka), magmas erupted at El Hierro record a main episode of crystallization-entrapment at 250–443 MPa followed by a second one at P < 200 MPa–50 MPa, corresponding to depths of 8–13 km and 6–1.5 km, respectively (Figures 11 and 12).
Over the range of pressures proposed, our deeper estimates coincide with the location of the crust–mantle discontinuity at El Hierro, which according to previous authors [e.g., González et al. 2013; Klügel et al. 2015; Martí et al. 2013a,b], operated as the main level of crystallization for the magmas erupted in the 2011–2012 event (i.e., at 10–15 km). These observations are consistent with the upper depths of the seismic swarm observed during the unrest period of the 2011–2012 submarine eruption [Domínguez Cerdeña et al. 2013; López et al. 2012], those estimated using length–thickness ratios of feeder dykes at El Hierro [11–13 km; Becerril et al. 2013], and the low-pressure equilibration recorded by some cpx-hosted fluid inclusions [280–450 MPa, Longpré et al. 2014]. Compared to the above, our crystallization-entrapment depths ⩽6 km are consistent with the interpretation of geodetic data associated with the 2011–2012 event [González et al. 2013] and the presence of high-density bodies (i.e., possibly representing cumulates) at shallow depths beneath the island, both suggesting the low-pressure equilibration conditions experienced by these magmas prior to their eruption [1–6 km; Montesinos et al. 2006]. This last episode may explain the formation of volatile-poor melt inclusions and, thus, the lower calculated entrapment pressures for these magmas.
Altogether, the distribution of volatile contents from El Hierro MIs, the dominant population composition of the host olivines (Fo 78–80), their crystal shape, and the new range of MI entrapment conditions inferred in our work, allow us to provide a robust scenario for the plumbing system feeding basanitic eruptions at El Hierro. Magmas rising from the deep mantle [>20–25 km; López et al. 2012; Martí et al. 2013a,b] experience a first but “short” (1–2 months, according to olivine diffusion modelling and the scarce occurrence of Fo > 84–88 olivines recording these conditions [Longpré et al. 2014; Martí et al. 2013b]; Figure 11–12) crystallization episode at 8–13 km. The subsequent fast injection of dykes from this first level of magma ponding towards the surface [Becerril et al. 2013] produces the isothermal (?) syn-eruptive crystallization (characterized by Fo78–80) accompanied by progressive H2O–CO2 degassing of the magma. This dynamic scenario promotes the rapid growth of crystals, as witnessed by disequilibrium textures [e.g., incomplete, resorbed, skeletal; see Martí et al. 2013b; Welsch et al. 2012] along with the entrapment of melt aliquots having different compositions and variable volatile contents, recording their journey towards the surface.
5. Conclusions
We report new H2O and CO2 solubility data in basanitic and phonotephritic melts representative of the Canary Islands magmas, from which empirical solubility laws have been derived. Whereas H2O displays broadly similar behaviour in both compositions, this is not the case of CO2, for which the role of cations such as Ca2+, K+, Na+, Fe2+, and Mg+ significantly impact CO2 solubility [e.g., Dixon 1997], in a manner still not well accounted for by existing models. Our study suggests that for compositions having similar total alkali contents, differences in CaO, MgO, and FeO* may play an important role in enhancing or decreasing the CO2 solubility.
The application of existing H2O–CO2 empirical models yields reasonable water contents for our compositions at low pressures (50–200 MPa), whereas the difference increases up to 1–2 wt% at 300–400 MPa. For CO2, the amounts calculated by the models differ compared to those measured by at least 10–20% and up to 85%. As stated above, the observed differences reflect the incomplete compositional coverage of available models.
Application of our results at El Hierro suggests a simple scenario in which magmas rising from the deep mantle (>25 km) experience a first transient episode of crystallization at 8–13 km, followed by the crystallization occurred during the subsequent dyke injection, ascent, and degassing at P <= 200 MPa (6–1.5 km).
Acknowledgements
This work was supported by (1) the Institut des Sciences de la Terre d’Orléans (ISTO-CNRS), the LABEX VOLTAIRE (ANR-10-LABX-100-01), and the PLANEX projects (11-EQPX-0036); (2) the European Volcano Early Warning System (EVE) project grant agreement: 826292 through the Group of Volcanology of Geociencias Barcelona (GEO3BCN-CSIC), and (3) the National Geographic Institute of Spain (IGN, Canary Islands). We thank L. Remusat from the MNHN in Paris for his support with NanoSIMS analysis; Ida Di Carlo and Aneta Slodczyk from ISTO-CNRS for their assistance in EPMA and FTIR analysis, respectively; and Ma J. Blanco, Francisco Quirós and Stavros Meletlidis from IGN, and Michel Pichavant, for their help in field tasks, as well as Joan Martí from GEO3BCN-CSIC for discussions and field support. We kindly thank the constructive comments of two anonymous reviewers and the editorial handling of the Editor François Chabaux.