


 CC-BY 4.0
1. State of the art
Thermo-mechanically coupled simulations of the lithosphere and asthenosphere tectonic evolution are of both academic and industrial interest, as they offer a physics-based understanding of the tectono-thermal evolution and sedimentary infilling of basins. However, reconstructing the polyphase stretching and thinning modes during the history of rifting, leading to continental breakup and seafloor spreading, remains challenging due to several geological uncertainties, such as inheritance (rheology, tectonic structures, magmatism …), stress direction, and strain rate. These last two pieces of information are constrained by global plate tectonic reconstructions [e.g., Seton et al. 2012]. Yet, the lack of magnetic anomalies before seafloor spreading [Vine and Matthews 1963] requires indirect quantification of the deformation using approximate restoration methods [e.g., Crosby et al. 2008; Sutra et al. 2013].
Passive margins result from the process of thinning and breakup of the continental lithosphere leading to the formation of new oceanic lithosphere [McKenzie 1978]. On Earth, conjugated passive margins present various morphologies [e.g., Sapin et al. 2021]: They can be symmetrical as in the case of Pelotas and Walvis margins [Blaich et al. 2011] or asymmetrical and hyperextended in the case of Iberia–Newfoundland margins [Sutra et al. 2013].
Many dynamic numerical models in the literature attempt to explain the variability of structural architecture of passive margins, either in two dimensions [e.g., Buck 1991; Brune et al. 2014; Gueydan and Précigout 2014; Huismans and Beaumont 2014; Dias et al. 2015; Brune et al. 2017; Tetreault and Buiter 2018] or in three dimensions [e.g., Brune and Autin 2013; Heine and Brune 2014; Le Pourhiet et al. 2017, 2018; Gouiza and Naliboff 2021; Jourdon et al. 2020, 2021; Neuharth et al. 2021]. These models present “general concepts” so as to comprehend the evolution of rifted margins and none aims to be directly applicable to real examples of passive margins. Indeed, passive continental margins evolve self-consistently with thermo-rheological laws of continental crust and mantle boundary and initial conditions. Radically different geometries of basins can be obtained simply by varying some of the input parameters, notably the rate of extension, the initial lithospheric thickness, mechanical coupling or decoupling at the Moho, and the thermal contribution of mantle convection. Moreover, a lot of complexity can emerge from running simulations in 3D, due in particular to (1) the obliquity between the strike of the mantle neck and that of the crustal structures [e.g., Brune and Autin 2013; Heine and Brune 2014; Liao and Gerya 2015; Le Pourhiet et al. 2017; Ammann et al. 2018; Jourdon et al. 2021; Neuharth et al. 2021], or (2) the rate of propagation of the mantle neck [e.g., Le Pourhiet et al. 2018; Jourdon et al. 2020].
Although the influence of inheritance on the architecture and tectonic evolution of passive margins is well accepted in the community [Taylor et al. 1999; Manatschal et al. 2015; Brune et al. 2017], highlighting it through forward thermomechanical numerical modelling remains difficult, particularly during the initiation and evolution of rifting and lithospheric breakup. In most cases, the approach consists in trying different hypotheses, i.e. testing several simulations with initial imposed inherited “anomalies” such as faults, plutons and/or cratons in order to reproduce the present-day configuration of passive margins consistent with the geological observations [Chenin and Beaumont 2013; Manatschal et al. 2015; Duretz et al. 2016; Balázs et al. 2018; Wenker and Beaumont 2018; Chenin et al. 2019; Petri et al. 2019; Gouiza and Naliboff 2021]. This modelling workflow remains fastidious and does not necessarily lead to the reconstruction of a particular passive margin architecture which can be quantitatively calibrated with data.
Alternatively, the kinematic modelling approach as favoured in Jeanniot et al. [2016] permits the model predictions of a particular continental margin being quantitatively calibrated against geological and geophysical observations. Utilizing a linear Stokes solver, this fast approach combines the instant flow field with a consistently fixed area of pure shear deformation (representing rift location, width, and extension rate) and a constant buoyancy flux at each phase of deformation (10 or 12 phases are needed). Material and heat are then transported using the calculated flow field considering small time steps that respect CFL condition.
However, despite the adaptability of Jeanniot et al. [2016] parameterization allowing calibration for complex passive margins, these simulations lack essential rheological feedback. The absence of complete thermomechanical coupling leads to mantle dynamics that are inconsistent with the ongoing crustal thinning annihilating natural transition from passive to active rifting during necking. Moreover, pure shear deformation disregards faulting and flexural deformation of the lithosphere during the early stages of continental rifting. This leaves a lot of free independent parameters, which could be constrained by introducing a physical model. This possibility of overfitting impairs the predictive power of the preferred model outside of the calibration points.
2. Why calibrating a thermomechanical simulation?
This study aims at developing an alternative approach allying kinematics calibration and physically consistent thermo-mechanics evolution. Combining these two approaches increases the predictive power of the calibrated models in terms of tectono-thermal history of sedimentary basins of passive continental margins. More precisely, the objective is to get thermal feed-back from the simulations of lithosphere–asthenosphere boundaries (LAB) through time by the calibration of the crustal scale features (basins, faults and the Moho depth and geometry) known from geological and geophysical data (e.g., 2D seismic profiles). The overall goal is therefore to be able to produce complex real passive margins formed through multiphase continental rifting and break-up that can be calibrated to subsurface data, in particular seismic data at a minimal numerical cost.
The most important hypothesis behind our work is that, while we admit that structural inheritance plays an important role in introducing complexity in the system, we do not want to include structural inheritance explicitly in the models because the initial geometry is even less known than the final one.
In other words, we posit that mechanical heterogeneities, present in the crust at the onset of rifting, or 3D effects, like propagating ridge or strike-slip system, can be replaced by adequate kinematic forcing. By kinematic forcing, we mean that we are imposing “boundary conditions”, i.e. Dirichlet conditions, within the model domain to turn on and off upper crustal extension when and where the data justifies it. Compared to a regular self-consistent thermo-mechanical approach, we therefore intend to limit the complexity embedded in the initial conditions (see Section 3.1) and commit the “academic scientific crime” to enforce the complexity using extremely rigid boundary conditions within the model domain (see Section 3.2). Compared to a regular kinematic approach, the small domains that can deform freely in the crust do not follow pure-shear flattening but may be faulted at smaller length scale according to the thermo-rheological profile of the lithosphere. Most importantly, the deformation of the LAB during rifting, which cannot really be constrained by seismic data on passive margin, is completely self-consistent with the better constrained deformation imposed in the crust. This allows for better constraining the mantle contribution to the tectono-thermal history of basins of continental lithosphere during rifting. To perform the study, we use the thermo-mechanical numerical code pTatin2D, which solves for non-linear variable viscosity and density Stokes equation coupled with conservation of heat including advection, diffusion and production, and with simple diffusion-based surface evolution model. Appendix A provides details on the partial differential equations involved.
In order to test the relevance of coupling self-consistent thermo-mechanical modelling approach with a kinematic modelling approach, a new kinematic module has been implemented into the two-dimensional thermomechanical code pTatin2D, allowing to force the location and range of extensional deformation over time in the crust. First of all, sensitivity tests are performed to examine the influence of each parameter that is involved in the kinematic calibration of the new module in pTatin2D. We then test the predictivity of this 2D approach by benchmarking it with a cross-section extracted from a complex 3D model. Finally, we present the application of the new kinematic module to the well-constrained geological case study of Iberia–Newfoundland conjugate rifted margins.
3. The kinematic module
3.1. Model setup: rheological parameters and initial conditions
Our experiments represent a 1200 km (in the x direction) × 250 km (in the z direction) domain discretized with 90 × 40 elements, respectively (Figure 1a). This low-resolution together with mesh refinement towards the surface permits fast computing while capturing large-scale mantle dynamics and crustal-scale tectonics. The model domain is kept to a minimal complexity. It is only subdivided in two rheological layers: the crust simulated by a diorite flow law [Carter and Tsenn 1987] and the mantle simulated using olivine flow law [Goetze and Evans 1979]. The initial Moho depth is calibrated by the user. The initial Lithosphere Asthenosphere Boundary (LAB), that is the 1300 °C isotherm, is initially lying flat at 120 km depth (Figure 1a). The full rheological parameters are compiled in Table 1 and its caption.
Initial model setup for calibration. (a) Geometry of the model, with dimensions and boundary conditions for all simulations. (b) Initial temperature state of the lithosphere for all the simulations presented. (c) The kinematic module presenting the different inputs parameters W, W0, X0, vxR, vxL and zvel (see part 3.2 for full description). (d) Yield-strength envelopes (Mohr–Coulomb representation) of the simulated materials calculated for a strain rate of 10−14 s−1 and a stress limited at 400 MPa [value from Watremez et al. 2013]. 𝛥𝜎 represents the second invariant of deviatoric stress.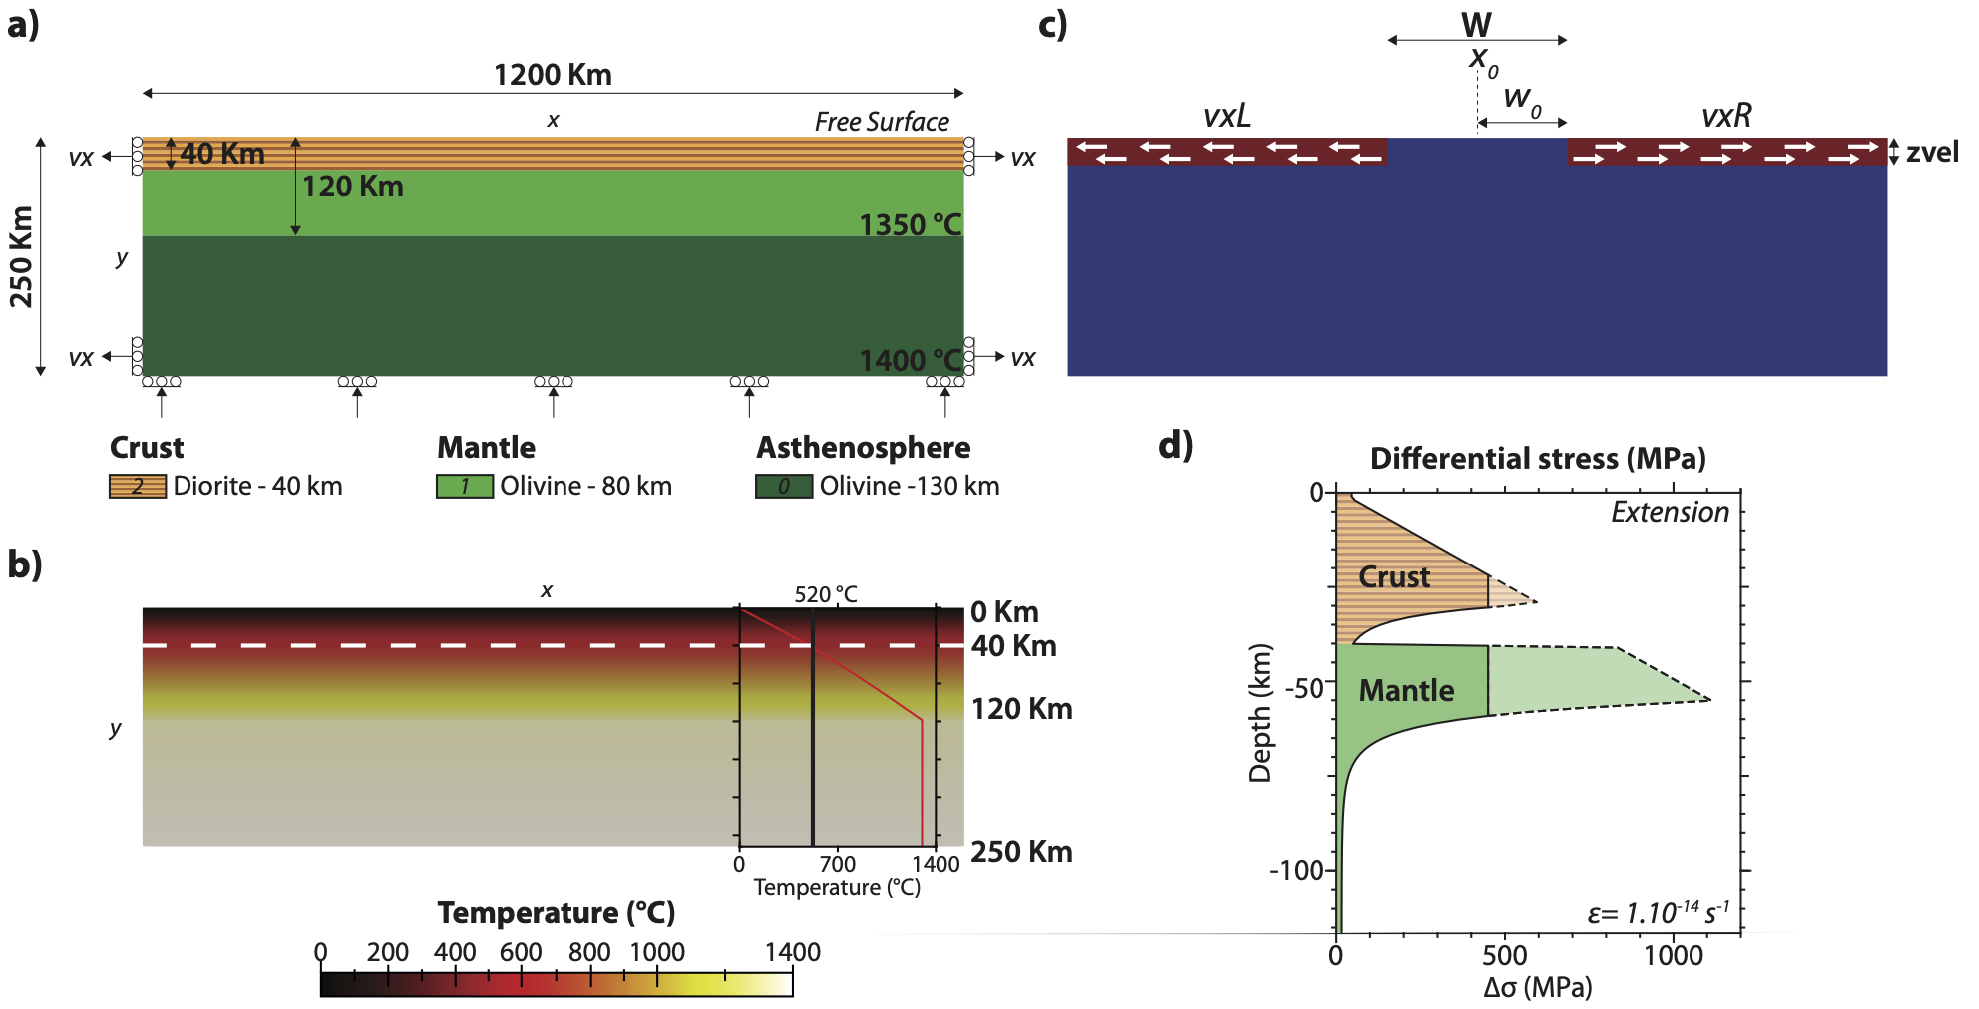
Rheological parameters used for the Dislocation Creep Arrhenius’ Laws of each simulated rheologies
| Lithology | Sediments (Quartz) | Crust (Diorite) | Mantle/Asthenosphere (Olivine) | Units | |
|---|---|---|---|---|---|
| 𝜌0 | Density | 2000 | 2850 | 3300 | kg/m3 |
| Creep parameters | |||||
| n | Stress exponent | 3 | 3.05 | 3 | |
| A | Pre-exp. factor | 6.80 × 10⁻⁶ | 6.3 × 10⁻² | 7.0 × 10³ | MPa−n⋅s−1 |
| Q | Activation energy | 156 | 275 | 510 | kJ⋅mol−1 |
| Brittle parameters Intact “0” and fully damaged “∞” | |||||
| 𝜙0 | Friction | 20 | 30 | 30 | ° |
| 𝜙∞ | Friction | 20 | 30 | 10 | ° |
| Co0 | Cohesion | 2 | 20 | 20 | MPa |
| Co∞ | Cohesion | 1 | 10 | 20 | MPa |
| Ref. | R & M | C & T | G & E | ||
R & M stands for Ranalli and Murphy [1987], C & T for Carter and Tsenn [1987] and G & E for Goetze and Evans [1979]. All the parameters are described in Appendix A and the parameters that are not listed in Table 1 have fixed values for all lithologies: 𝛼 = 3 × 10⁻⁵ K−1 (thermal expansion), 𝛽 = 1 × 10⁻¹¹ Pa−1 (adiabatic compressibility), 𝜅e = 5 × 10⁻⁷ m2⋅s−1 (erosional diffusive coefficient), 𝜅 = 1 × 10⁻⁶ m2⋅s−1 (heat diffusivity), 𝜀min = 0, 𝜀max = 1, Cp = 1000 J⋅kg−1⋅K−1 (heat capacity), H = 3.33 × 10⁻¹⁰ W⋅kg−1 (heat production).
The model upper boundary behaves as a free-surface subjected to erosion and sedimentation, which allows the development of sedimentary basins. These surface processes are modelled using Culling [1965]’s law with a constant diffusivity (𝜅e) of 10−6 m2⋅s−1 accounting for local erosion/deposition processes. We do not introduce a source term, which can be used to account for local carbonates production or out-of-plane sediment infill [e.g. Jourdon et al. 2017; Perron et al. 2021]. The basal boundary is prescribed an inflow to compensate for the outflow imposed by the extensional velocity varying along the lateral boundaries. The temporal variation and implementation of these boundary conditions are detailed in the next section.
The thermal boundary conditions are fixed at the top and base of the model to 0 °C and 1400 °C respectively, and a null heat flux is assumed at the model lateral boundaries (Figure 1b). A radiogenic heat production is only imposed in the crust with a value of 3.33 × 10⁻¹⁰ W⋅kg−1, we neglect it in the mantle.
3.2. Boundary conditions
The kinematic module allows the user to impose regions where deformation can occur or, on the contrary, regions acting as rigid blocks. These choices are arbitrarily based on previously collected geological evidence. This approach is particularly useful in the case of abandoned rifts due to multiphase rifting, out-of-plane source of localisation like a propagating rift segments [Le Pourhiet et al. 2017; Neuharth et al. 2021] or strike slip system juxtaposing two margins segments with different histories [Jourdon et al. 2020, 2021]. For this type of problem, one could argue that 3D simulations would be more appropriate, but data on crustal scale, which encompass the whole margin are usually 2D seismic lines rather than 3D seismic blocks. Moreover, running 3D simulations would defeat the relatively low computational cost of the new approach we want to elaborate.
This module, newly implemented in pTatin2D, is largely inspired by the work of Jeanniot et al. [2016] which imposed different delimited areas deformed by pure shear at lithospheric scale during each given lapse of time of the simulation. Here, instead of imposing pure shear, we let these parts of the crustal domain free to deform according to their rheological parameters and the current thermal field. In this zone of mechanically consistent deformation, our simulation can produce strain localisation at a smaller scale than the one imposed by the user. Therefore, the kinematic module imposes a rigid behaviour down to a depth zvel outside of a domain of width W(t).
The kinematic parameter zvel, corresponds to the fixed thickness of the lithosphere where the variable velocities vxL and vxR are imposed (Figure 1c). This boundary condition is similar to that proposed by Gorczyk et al. [2007]. We investigate the impact of zvel on the evolution of the rifted margin architecture, by varying its thickness from 0 to 40 km (Figure 2). We find that driving the model by only fixing the velocity on the surface nodes (zvel = 0) is not satisfactory because the very shallow crust and sediments have not a sufficient frictional strength to transmit the deformation to the whole crust. It results in the formation of large artefactual shear strain rate at the top of the simulation and very little drag is transmitted to the crust (Figure 2). When zvel includes at least 5 km of crust, kinematic forcing works fine and further increase of zvel show negligible impact on the architecture of the rifted margins.
Influence of initial thickness of zvel kinematic parameter on the architecture of rifted margins. Sediments and plastic strain are shown on markers with their respective colormaps (stratigraphy and Plastic strain). The second invariant of strain rate is represented using contour in its respective colormap. Note a constant velocity vx = 0.8 cm∕yr is applied and that the initial width of W is 200 km for all simulations.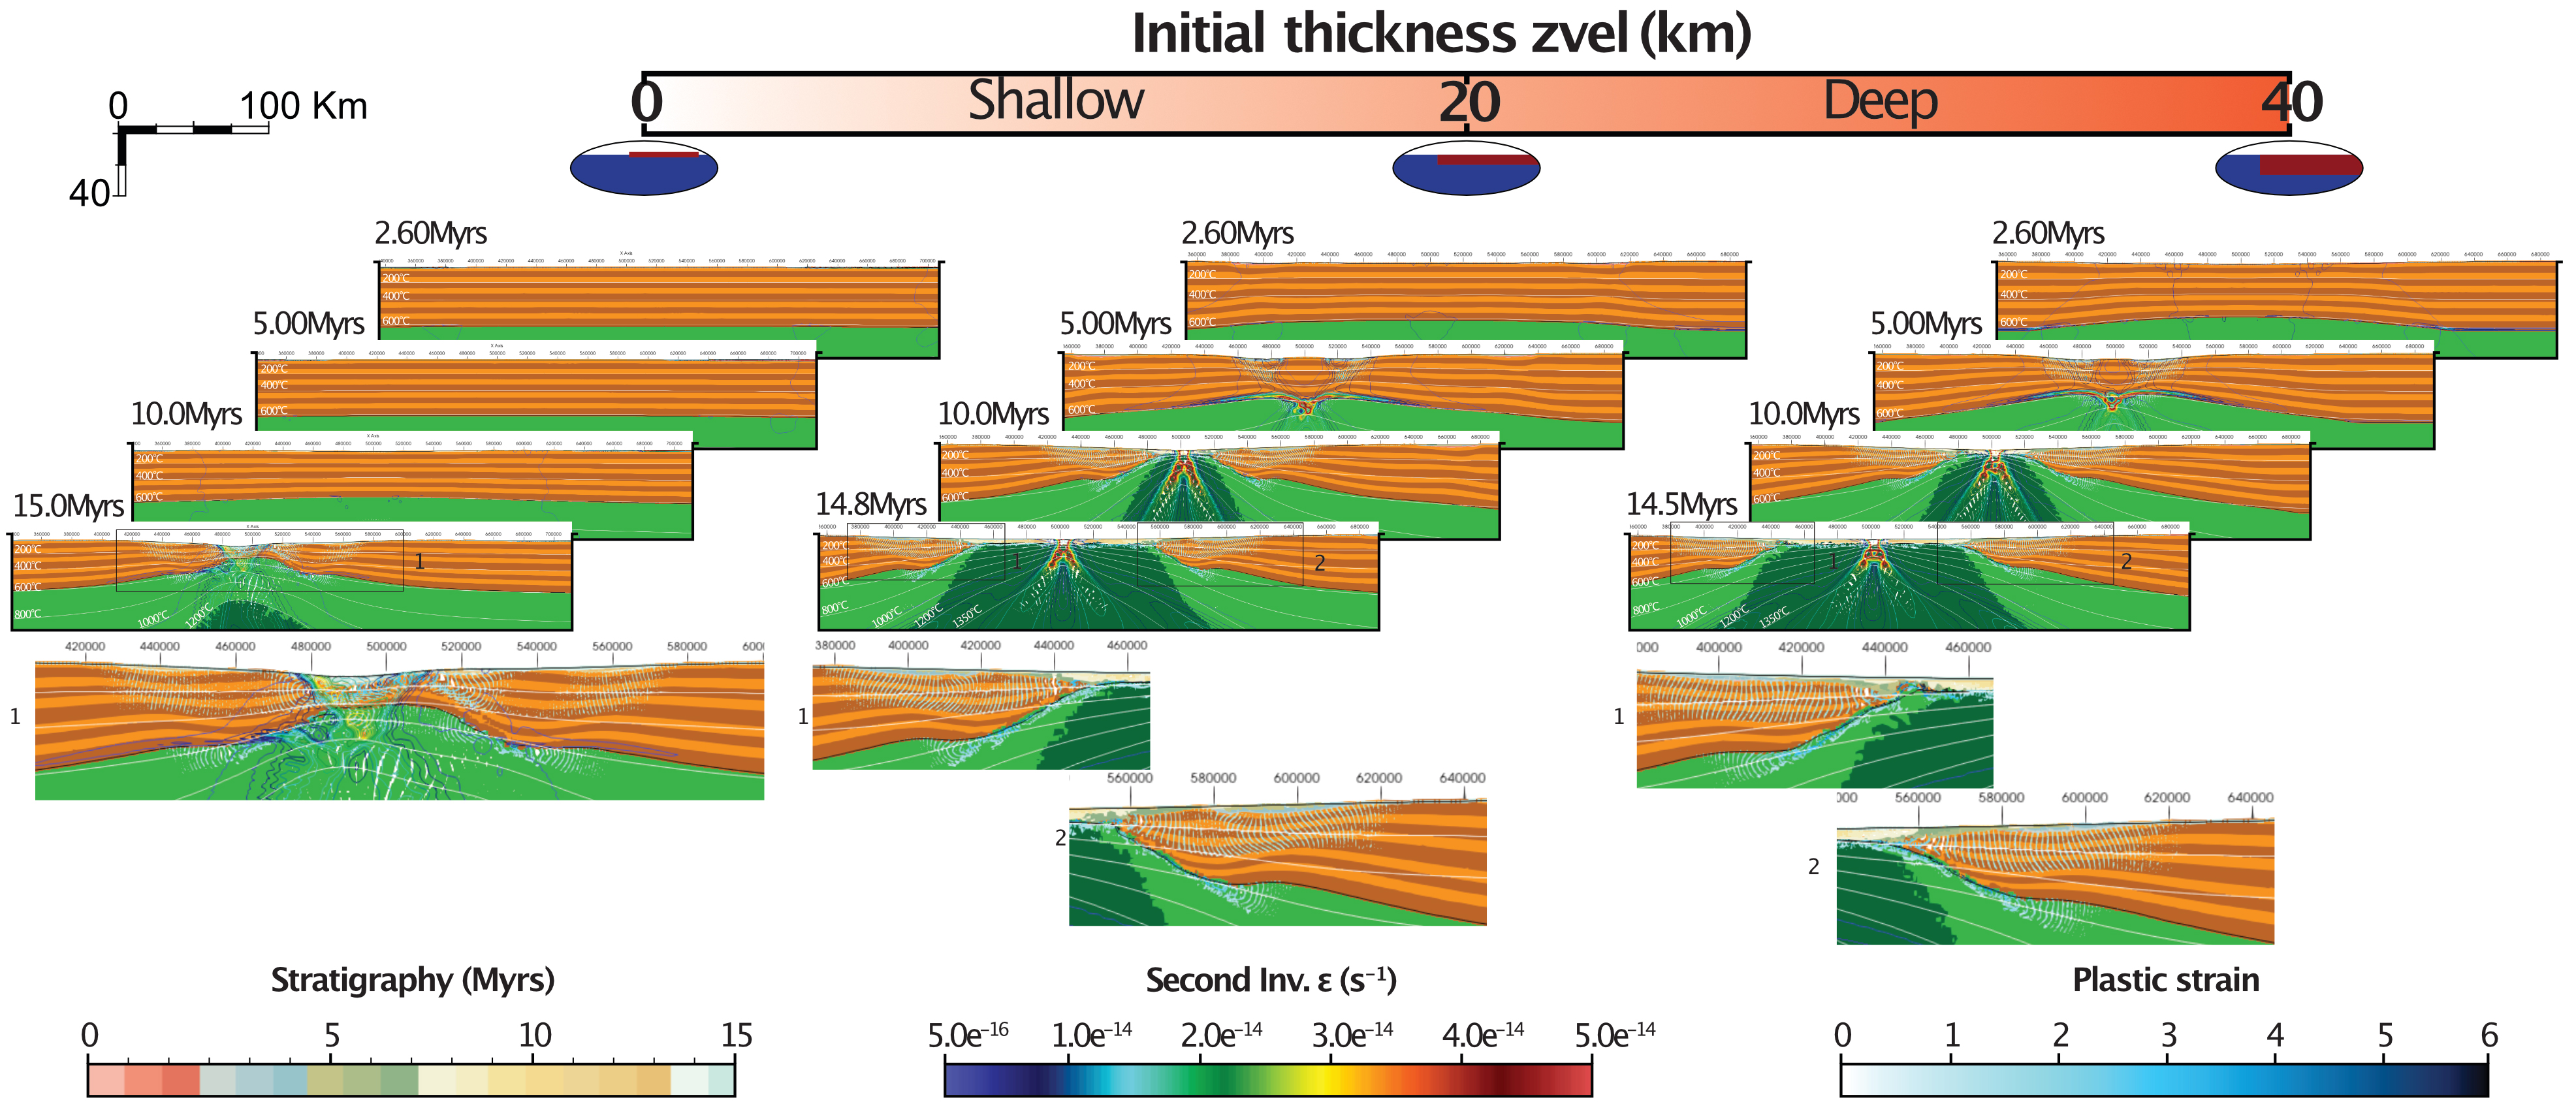
Each phase of deformation Pi is defined by a start time ti and an end time te, and a set of user-defined kinematic parameters. The kinematic parameters define the geometry of the rigid domains at the beginning of the phase Pi and the velocity applied at the limit during that phase (Figure 1c). In details the user must provide:
- W is a user input and corresponds to the initial width of the delimited zone of the lithosphere, where the deformation is not imposed by user down to depth zvel. W0 used in the computation represents the half of W;
- X0 represents the localisation of the centre of de domain W.
- vxL is the velocity imposed on all the points of the domain located above zvel which abscisa is
∙ vxR is the velocity imposed on all the points of the domain located above zvel which abscisa is(1a) (1b)
The deforming zone widens with time as
| (2) |
3.3. Influence of the strength of the crust and stretching rate using our parametrisation
For the reconstruction, it is interesting to get the initial basin spacing as a feature of the simulation using a large W, when possible because this will constrain quite well the rheological parameter. The spacing between normal faults is known to depend, at first order, on the thickness of the resistant layer of the lithosphere [e.g., Spadini and Podladchikov 1996], that is, the depth to the brittle ductile transition. Using only one lithological layer for the whole crust, this depth is controlled by the viscous strength of the crust and the strain rate. In our approach, we use an ad hoc non-dimensional parameter Ascale which modifies the Arrhenius creep law to control the viscous strength of the crust. As the power law parameter, A, is in MPa−n⋅s−1 in Table 1 (n being the creep law exponent), a Ascale value of 106 produces the laboratory creep law, a lower value produces a lower viscosity. The mean stretching rate is controlled by the value of vx∕W.
In most cases, using a large W (200 km, Figure 3) permits to calibrate Ascale with the natural graben spacing expected in the early rifting phase if there is not too much influence of inheritance. As expected from all the literature cited in the introduction, weak crust leads to metamorphic core complexes, detachement systems or wide rift systems. Low extension rates lead to diffuse extension, while strong crust together with intermediate to high extension rates tend to lead to narrow rift systems. Figure 3 is intended as a catalogue for the user to pick the parameters to perform the initial reconstruction step. Supplementary Figure S1 provides a more comprehensive phase-map of possible initial rift geometry as a function of Ascale and W than what could possibly be displayed in Figure 3. Figure 4 displays the outcome of an intermediate case with Ascale = 106 with W = 200 km and vxR + vxL = 0.8 cm∕yr. Comparing with Ascale = 107 in Figure 3, one can see that intermediate strength crust (Figure 4) leads to the formation of an initial graben which is then broken in two parts while very strong crust, with its very low level of initial necking, does not lead to the formation of any such graben.
Influence of the parametrised strength of the crust on the architecture of continental rift and symmetry of the rifted margin. Sediments and plastic strain are shown on markers with their respective color scales. The second invariant of strain rate is plotted using contour lines and its color scale. We use a wide (W = 200 km) thermo-mechanically controlled zone, so that the width of the margin and the type of rifting depends on the rheology of the crust [wide rift for a weak crust, narrow rift for a strong crust, e.g. Buck 1991], which is parametrised with a single parameter Ascale in our approach, and on the stretching rate W∕vx.
Influence of W kinematic parameter (initial width of the thermo-mechanically controlled zone) on the architecture of continental rift and symmetry of the rifted margin for an intermediate strength (Ascale = 106), a constant velocity vxL = vxR = 0.4 cm∕yr and zvel equal to 40 km. Smaller W may favour higher level of necking that results in final asymmetry.
As mentioned earlier, it is preferable when a reconstruction can start with a large W. This permits to better constrain the rheology of the crust (Ascale) using the initial basin spacing. Yet, as stated in the introduction, heterogeneities in the crust may sometimes lead to more localised modes of extension [Le Pourhiet et al. 2004; Huet et al. 2011a, b] or to more diffuse modes if many heterogeneities are present [e.g., Petri et al. 2019]. This can be dealt with by using a small initial W (initially localised deformation, see next section) or a weaker on average crustal strength (small Ascale) in the calibration.
3.4. Impact of the width W
As mentioned before, the kinematic parameter W corresponds to the initial width of the zone of the lithosphere with mechanically consistent deformation during one phase (Figure 1c). We tested the impact of W on the architecture of rifted margins for values of 40, 120 and 200 km (Figure 4).
After 2.5 Myr, corresponding to an amount of extension of 20 km (i.e., 2.5 Myr × 0.8 cm/yr), the models with a small W exhibit a high level of necking which delimit a central horst rather than a central graben in the model with a large W of 200 km. After 15 Myr and an amount of extension of 120 km, the rifted margins with initially small W, that is, with a central horst, have turned into asymmetric margins while the simulation with a central graben has remained symmetric. The origin of this behaviour, except for the initial forcing, is purely dynamic. Models with initial central horsts develop two mantle necks that compete until one horst evolves into an active upwelling and inhibits the activity on the other horst. This leads to the formation of an asymmetric margin. For W equal to 40 km, the left margin is more extended (about 100 km) than its right counterpart (about 60 km) and features two sub-basins instead of one to the right. For W equal to 120 km, it is the right margin which extends over 160 km with two sub-basins. The left margin is smaller with 60 km in length. It is difficult to control which side will break in a completely dynamic simulation. The direction of asymmetry indeed mostly relies on small numerical errors amplified by the non-linearities of the rheology. With our new kinematic module, we can stop the simulation and pick-up the neck that was preferred in nature. Note that for values of W greater than 200 km with this rheological configuration, the rifted margins are symmetrical and 110 km long because the initial set up featured a low level of necking that resulted in a single mantle neck at the centre of the simulation.
The user and reader must keep in mind that decreasing W at constant vx lead to an increase of the strain rate and that there are also some trade-offs with the strength of the crust. Nonetheless, the rule of thumb with the shallow/high and deep/low initial level of necking is robust at intermediate strength and the impact of W is less important for both very strong and very weak crusts as outlined in Figure 5. A more comprehensive mapping of the parameter space can be found in Supplementary Figure S2.
Illustration of the existing yet limited trade-off between rheology and the choice of the width of rift zone. Weak and strong crust are not significantly affected by the choice of W, except for the age of sediments in the basins. For an intermediate rheology of the crust, the rate effect introduced by the choice of W is important in forming or not an initial mantle horst.
3.5. Workflow
Asymmetric margins can form by multiphase extension (alternating periods of extension and tectonic quiescence/cooling) as documented in Naliboff and Buiter [2015]. It can also be the result of the selection of one sub-basin out of the several ones that initially form a wide rift as highlighted in the simulation with weak lower crust and large W (Figure 3). In nature, contrarily to simplistic simulations, the selection of one of the sub-basins might be due to a structure propagating out of the plane [e.g., Le Pourhiet et al. 2017, 2018]. Here, we modify the kinematic parameters through time to permit the selection of a specific sub basin. The flexibility of our approach permits to either let the physics play its role (pause and restart stretching after some thermal relaxation), or to enforce localisation when the physical reason for localisation is either imperfectly known (inheritance) or coming out-of-plane (strike-slip or propagating ridge segment).
The method for the kinematic reconstruction of a rifted margin involves launching several models at each phase with a different range of velocity (vx) and to choose the best model, i.e., the one that produces a crustal thickness (i.e., depth of the Moho) consistent with the data we try to adjust.
Among the launched models, we select the best fitting one and restart several new models from the time step at which we stopped. This operation is performed several times until the entire reconstruction of the rifted margin. The simulations are check-pointed after each phase of deformation, allowing us to modify the latter phase of deformation without re-computing the initial phase. The reconstruction approach of passive margins developed in this study involves determining the appropriate velocity (i.e., to find W, X0, vxL and vxR) at each phase of the simulation exactly like in the Jeanniot et al. [2016] approach.
A part of the calibration therefore consists in trials and errors improved by the results of the sensitivity tests and the experience of the user with thermo-mechanical modelling. The other part relies on starting the reconstruction with a pre-existing reliable back stripping model of the sedimentary basins that will help constraining the reconstruction. The goal of the kinematic module is not to replace back-stripping tools, but to produce geometry and temperature fields in the lower crust, mantle and LAB that are compatible with the movement of the basement of the basins deduced from back-stripping.
4. Benchmark: kinematic calibration of a synthetic 2D cross-section extracted from a 3D numerical model
4.1. Incentives to benchmark kinematic calibrations using complex numerical models
In nature, the amount of available data, and particularly those for thermal calibration, is quite limited and will never be as complete as what is recovered from a numerical simulation. Moreover, all the data available for a case study are used for model calibration so that model prediction cannot really be tested unless a new borehole is drilled. Calibrating a kinematic model using the result of a complex fully self-consistent numerical simulation present the advantages of having an unlimited synthetic borehole data, or simply to access the depth of the LAB through time.
3D thermomechanical numerical simulation is currently the way to produce very complex physically consistent models of long-term deformation of lithosphere–asthenosphere systems. Moreover, as mentioned earlier, data are usually collected along 2D high resolution seismic profiles, while crustal and lithospheric deformation is by essence three-dimensional. In order to validate the new implemented kinematic module in pTatin2D, we have calibrated a 2D simulation to produce a model bt (blind test) that has a similar Moho and top basement geometry as the synthetic 2D cross-section bc (blind cross-section). Yet, the cross-section bc here is not a seismic profile but, instead, has been extracted from a 3D thermomechanical model of passive margin formation published in Jourdon et al. [2020]. This model was chosen to have some significant out-of-plane deformation to make the exercise closer to typical case studies on natural cases using 2D high resolution seismic lines at the crustal scale. The first author, in charge of the calibration, was not informed from which 3D model the bc section that was given to him was extracted. Using a synthetic section permits to have access to the LAB a posteriori to validate that a thermo-mechanical simulation calibrated with the geometry of the crust to a geological cross-section might be predictive for the LAB and the mantle heat flow.
To perform the calibration, only the top-basement and the Moho geometry of the cross-section displayed in Figure 6 were used. The rest of the information available from the synthetic cross-section bc, such as the LAB evolution with time, is only used to evaluate the predictivity of the approach.
2D cross-section bc extracted from a 3D thermomechanical numerical model with the determination of the reconstruction parameters. The section displays 4 discrete basins. For each phase/basin i, we determine the abscissa of the depocenter, the final width of the basin i, the distance between each basin depocenter and the crustal thickness at the depocenter of the basin i. Note that superscript L and and R indicate respectively the left and right side of the basin 0 that was split at the moment of continental break-up.
In other words, we utilize only a portion of the data, two interfaces at one time step, for calibration purposes, while retaining the remaining (temperature field, LAB, heat flow and cross-section evolving with time) for verification to ensure the accuracy of the calibration between synthetic data points. Although this approach does not guarantee a perfect calibration with natural data, it is satisfactory for validation of the calibration methods. If the calibration fails to produce accurate predictions between synthetic data points, it indicates that a similar approach based on real (and often even more fragmented) data is unlikely to be predictive.
4.2. Reconstruction parameters of the synthetic cross-section bc
The absence of sediments and therefore of stratigraphic markers in the synthetic cross-section makes the calibration step more complicated than that of a real cross-section calibrated by borehole data. A quick look at the architecture of the synthetic cross-section highlights an asymmetric morphology of the margins. The right margin can be characterized by four sub-basins or four structural units (Figure 6). The first one, at the far right (bc3), seems to be controlled by a nearly vertical structure linked to left-dipping normal faults which would be interpreted as having a strike-slip component in nature. The second one (bc2), to the left of the previous one, is bounded by two synthetic normal faults forming a classical graben system. The two last sub-basins (bc1 and bc0) of this margin part show tilted blocks to the left and a hyper-extended necking structure. In contrast, the left margin side (Figure 6) is featured by a simpler margin morphology with tilted blocks to the right, forming a necking zone.
The initial thickness of the crust away from necking seems to be 40 km (Figure 6) so we can consider it as initial condition.
4.3. Calibration to top Basement and Moho impact on LAB and Tmax
In order to calibrate our simulation bt to the crustal geometry of the rifted margins extracted along the synthetic cross-section bc (Figure 6), we first compute the kinematic parameters using the reconstruction parameters listed in Table 2 and represented on Figure 6. As we only know the final geometry, we first measure the amount of extension e associated to each phase of rifting and, assuming that e = (vxL − vxR)∕(te − ti), we modify the timing and the velocity using our stop-and-go approach to test different combinations. We found that the kinematic parameters, listed in Table 3, lead to a reasonably good adjustment of the Moho and top basement geometry of model bt to the synthetic cross-section bc presented in Figure 7. This combination is not unique because there are no erosion and sedimentation in the synthetic cross-section to date the different phase, and there are clearly no constraints on te and ti. The choice was solely based on the formation of structures at the correct location.
Reconstruction parameters for the basins from the synthetic cross-section presented in Figure 5
| Name | x | w | d | L | Tectonic phases |
|---|---|---|---|---|---|
| bc0L | 595 | 20 | 40 | 5 | 4 |
| bc0R | 370 | 20 | 40 | 5 | 4 |
| bc1 | 615 | 40 | 20 | 5 | 3 |
| bc2 | 740 | 30 | 125 | 20 | 1 |
| bc3 | 850 | 20 | 110 | 15 | 2 |
x is the localisation of the maximum depocenter of basins/sub-basins at the final stage, w is the width of the basins/sub-basins at the final stage, d is the spacing between basins/sub-basins at the depocenter, L is the crustal thickness at the depocenter, all given in km.
Kinematic parameters of the calibration bt of the synthetic cross-section bc
| Phases | P0 | P1 | P2 | P3 | P4 | P5 |
|---|---|---|---|---|---|---|
| vx (cm/yr) | 0.50 | 0.50 | 0.50 | 0.50 | 0.50 | 0.227 |
| te (Myr) | 2 | 8 | 14 | 20 | 24 | 80 |
| ti (Myr) | 0 | 2 | 8 | 14 | 20 | 24 |
| X0 (km) | 600 | 600 | 690 | 485 | 465 | 465 |
| W0 (km) | 150 | 50 | 30 | 20 | 20 | 150 |
| e (km) | 10 | 30 | 30 | 30 | 20 | 127 |
Note that the phases P0 and P5, respectively initiating and finalising the rifting are characterized by large W0 so that mechanical equilibrium dominates ove kinematic forcing during these phases.
Our favorite kinematically forced model bt of the cross-section bc. The brown transparent square delimits the zone of kinematic forcing at each phase.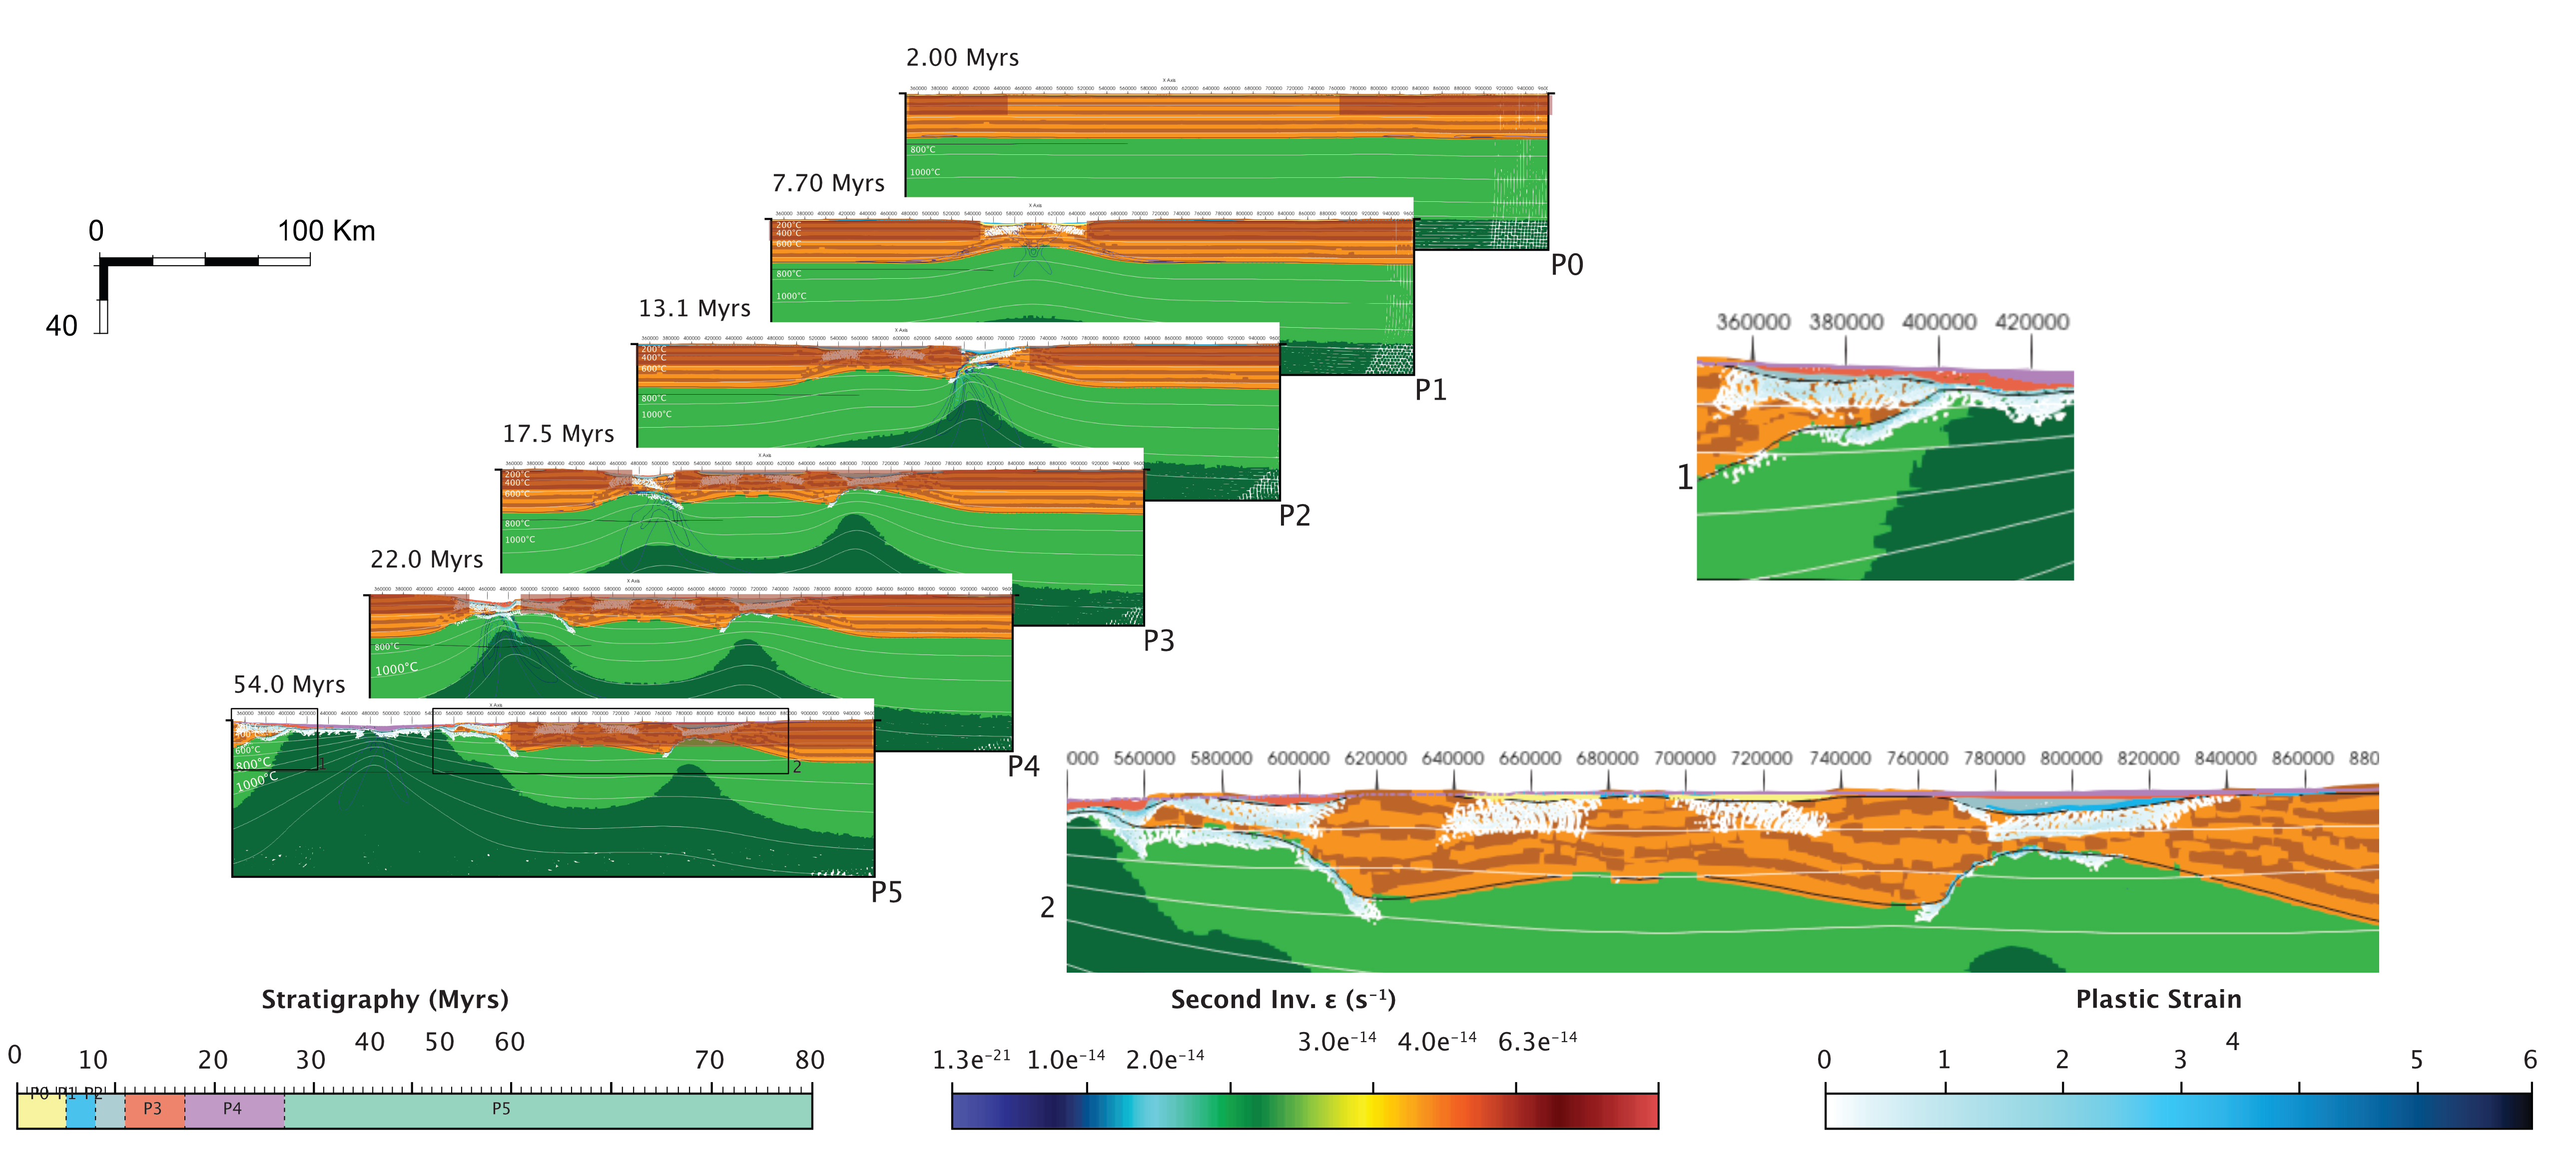
In order to reconstruct the synthetic cross-section (bc), the calibrated model bt needs 6 phases with a total amount of extension about 247 km during 80 Ma. The amounts of extension, e, of each phase, are also gathered in Table 3.
In our calibration, two extra phases are added to the kinematic reconstruction (P0 and P5 in Table 3): (1) One is the initiation of the rifting with a large W0 and central X0 and (2) another one is set after the break-up with a large W0 and with the same X0 than the last phase to allow for a dynamic post-rift phase that accounts for realistic convection dynamics (Figure 7).
The phase P1 is required to reconstruct the bc2 structural unit in Figure 6. The next phase, P2 permits to create bc3 flower structure in Figure 6. The two last phases, P3 and P4, are needed to respectively build the structural unit bc1 and to give their characteristic geometries to the bc0R and bc0L conjugate margins in Figure 6. We further discuss in part 4.5 the impact of the ordering of the phases.
4.4. Validation and limits for predicting mantle dynamics
Concerning predictivity of the calibration, we use the LAB geometry as a proxy for the thermal regime of the lithosphere. The comparison between the LAB of the synthetic cross-section and the LAB of our best bt calibration displays a small yet significant difference while comparing the shape of the LAB in the centre of Figure 8. The difference in temperature on the lateral side is possibly due to different thicknesses of the domain in the 2D and 3D simulations. The “mushroom” aspect of the green bt curve compared to the “Gaussian” aspect of the bc curve is more significant. This “mushroom” shape of the LAB in our calibrated cross-section indeed materializes convection cells in the asthenosphere which are not present or less vigorous in the 3D model. In 3D, the drag acting on a buoyant cylinder is smaller than that acting on a buoyant sphere with the same diameter. As a result, the cylinders rise faster than the sphere causing more vigorous convection. In 2D simulations, all structures and temperature anomalies present in the cross-section are cylindrical (infinite in the third dimension). As a result, 2D plane strain simulations are known to overestimate the convective vigour of the flow. For a complete proof of this statement, the reader can refer to Weinberg and Podladchikov [1994].
Comparison between the 2D synthetic cross-section (bc) and different calibrations. bt is our preferred calibration without the LAB, bti is a calibration in which we inversed the timing between phase P2 and P3; bt𝛼 is a calibration with smaller coefficient of the thermal expansion 𝛼 = 1 × 10⁻⁵ K−1. It was made to better adjust the fit to the LAB in the calibration.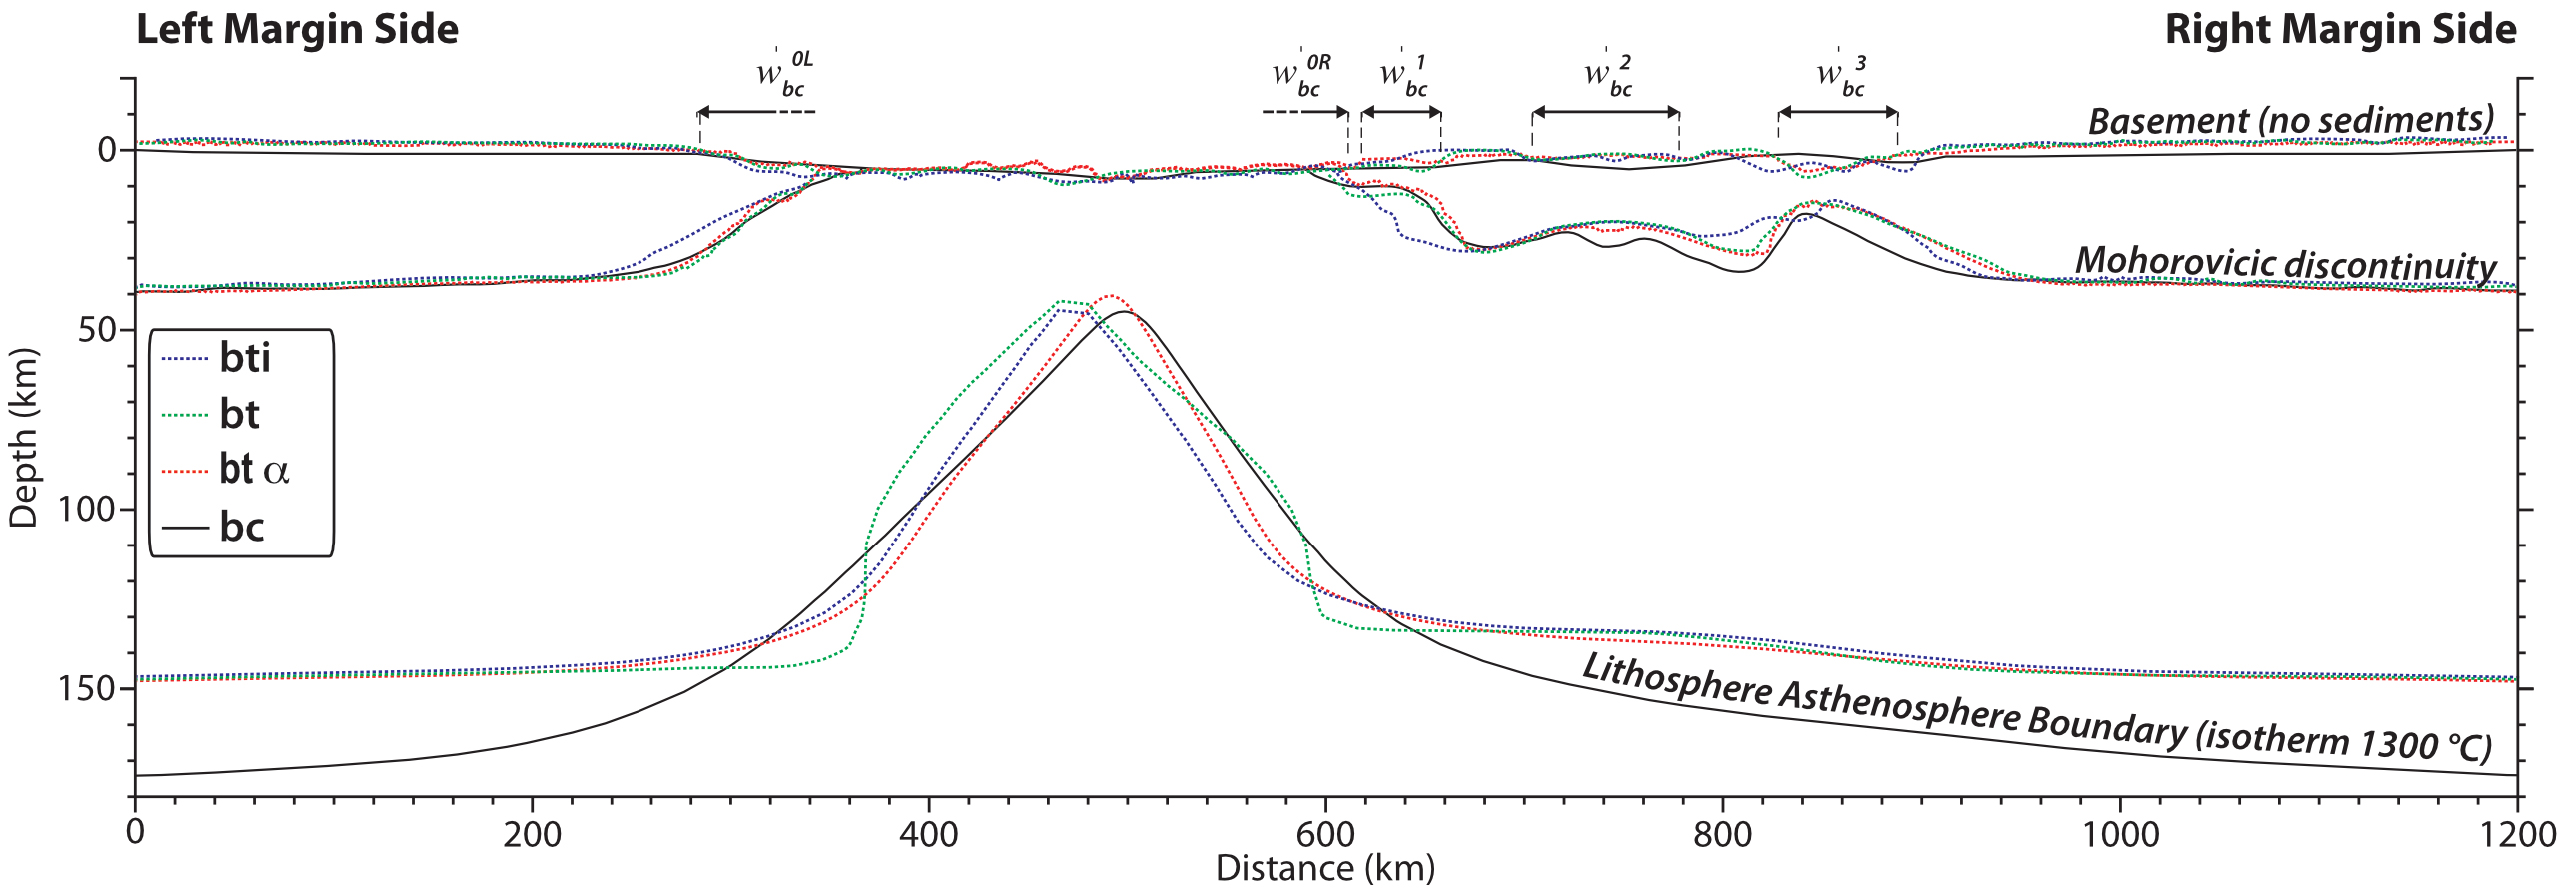
Based on our understanding of mantle convection and 2D approximation, we therefore tested whether a reduction of the coefficient of thermal expansion from 𝛼 = 3 × 10⁻⁵ K−1 to 𝛼 = 1 × 10⁻⁵ K−1 (see Figure 8 caption and Appendix A) would improve the shape of the curve. This implies that when reconstructing a section with a large strike-slip component, it might be wise to use slightly smaller coefficients of thermal expansion to better predict the temperature and mantle convection using 2D section calibrated with crustal deformation.
4.5. Validation and limits for reconstruction
The kinematics retrieved during calibration is consistent with the rifting propagation observed in the a posteriori 3D model. Indeed, the extension starts by forming a central rift which corresponds to the structure bc2 on the synthetic cross-section that is abandoned thereafter. Then, a strike-slip fault shifts the units to form the structure bc3 on the synthetic cross-section. Finally, the continental break-up occurs to the left of all these structures along with basins identified as bc0 and bc1 on the synthetic cross-section. Despite some resolution uncertainties especially near the flower structure, the 2D calibration (bt) manages to reproduce this 3D problem structure.
To assess whether the calibration is sensitive to the order and the timing of the different phases, we attempted a calibration bti in which P2 and P3 are switched in Table 3. When we compare this calibration with our preferred calibration bt, as well as with the synthetic cross-section bc in Figure 7, we observe that the calibration bti fails in reproducing the basin bc3 shown in Figure 5. This means that the sequence in which we apply the stretching phase not only influences the temperature but also the final geometry of the model. This influence of the deformation path on the architecture primarily stems from the thermo-mechanical feedback on the rheology. This demonstrates that the thermo-mechanical calibration approach can help mitigating uncertainties inherent in a purely kinematic approach during the back-stripping phase.
To conclude the kinematic module integrated to the 2D thermomechanical code pTatin2D succeeds in modelling complex 3D passive margins with a good predictivity in term of lithospheric thermal state. Moreover, this approach can be used to test different reconstruction options as the final geometry is found to be path-dependent contrarily to the purely kinematic approach. One should note that the method is very costly and should only be used address uncertainties between two scenarios when the timing of the deformation, borehole data and clear time correlations are missing.
Consequently, despite some limits, our new module can be used to reconstruct some natural cases of passive margins and to predict their thermal history where calibration points are missing.
5. Application to Iberia–Newfoundland conjugate rifted continental margins
5.1. Geological setting
The Iberia–Newfoundland rifted continental margins are located in the North Atlantic Ocean (Figure 9a). The rifted margins are asymmetric, hyperextended [Sutra et al. 2013; Manatschal et al. 2007] and are composed from east to west (Figure 9b) by the Galicia Interior Bank (GIB), the Galicia Bank (GB), the Deep Galicia Margin (DGM), the Newfoundland Basin (NB) and the Flemish Cap (FC). The formation of these conjugate margins is propagating from south to north [Nirrengarten et al. 2018] and results from the superposition of two consecutive rifts events [Péron-Pinvidic and Manatschal 2009]: a first event dated as Late Triassic to Early Jurassic and a second, more important event dated as Late Jurassic to Early Cretaceous and leading to the breakup of the southern North Atlantic [Tucholke et al. 2007; Tucholke and Sibuet 2007]. During the first phase, the extension was distributed over a wide area and the crustal thinning was very small [Tucholke and Sibuet 2007; Mohn et al. 2015]. To sum up, the calendar of these conjugate margins is as follows: Stretching (∼161 Ma), necking (∼145 Ma), mantle exhumation (∼137 Ma) until break-up (∼115–112 Ma). So, the duration of the whole rifting sequence is about ∼50 Myr until break-up [Sutra et al. 2013; Eddy et al. 2017; Tucholke et al. 2007; Bronner et al. 2011; Tucholke and Sibuet 2007; Péron-Pinvidic et al. 2007] and syn-rift sediment ages recovered at ODP Sites 638, 641 and 640 [Boillot and Winterer 1988] permit to constrain the subsidence in the distal part.
(a) Bathymetry of the Iberia–Newfoundland rifted margins in the Atlantic North from ETOPO1 1 Arc-Minute Global Relief Model. Profiles locations, the ODP drill holes and the magnetic anomalies M0 and M3 are marked on the map modified from Jeanniot et al. [2016]. (b) Seismic reflection/refraction interpreted profile of North Iberia–Newfoundland conjugate rifted margins modified from Sutra et al. [2013]. The kinematics inputs (x, w and L) are compiled in Table 4.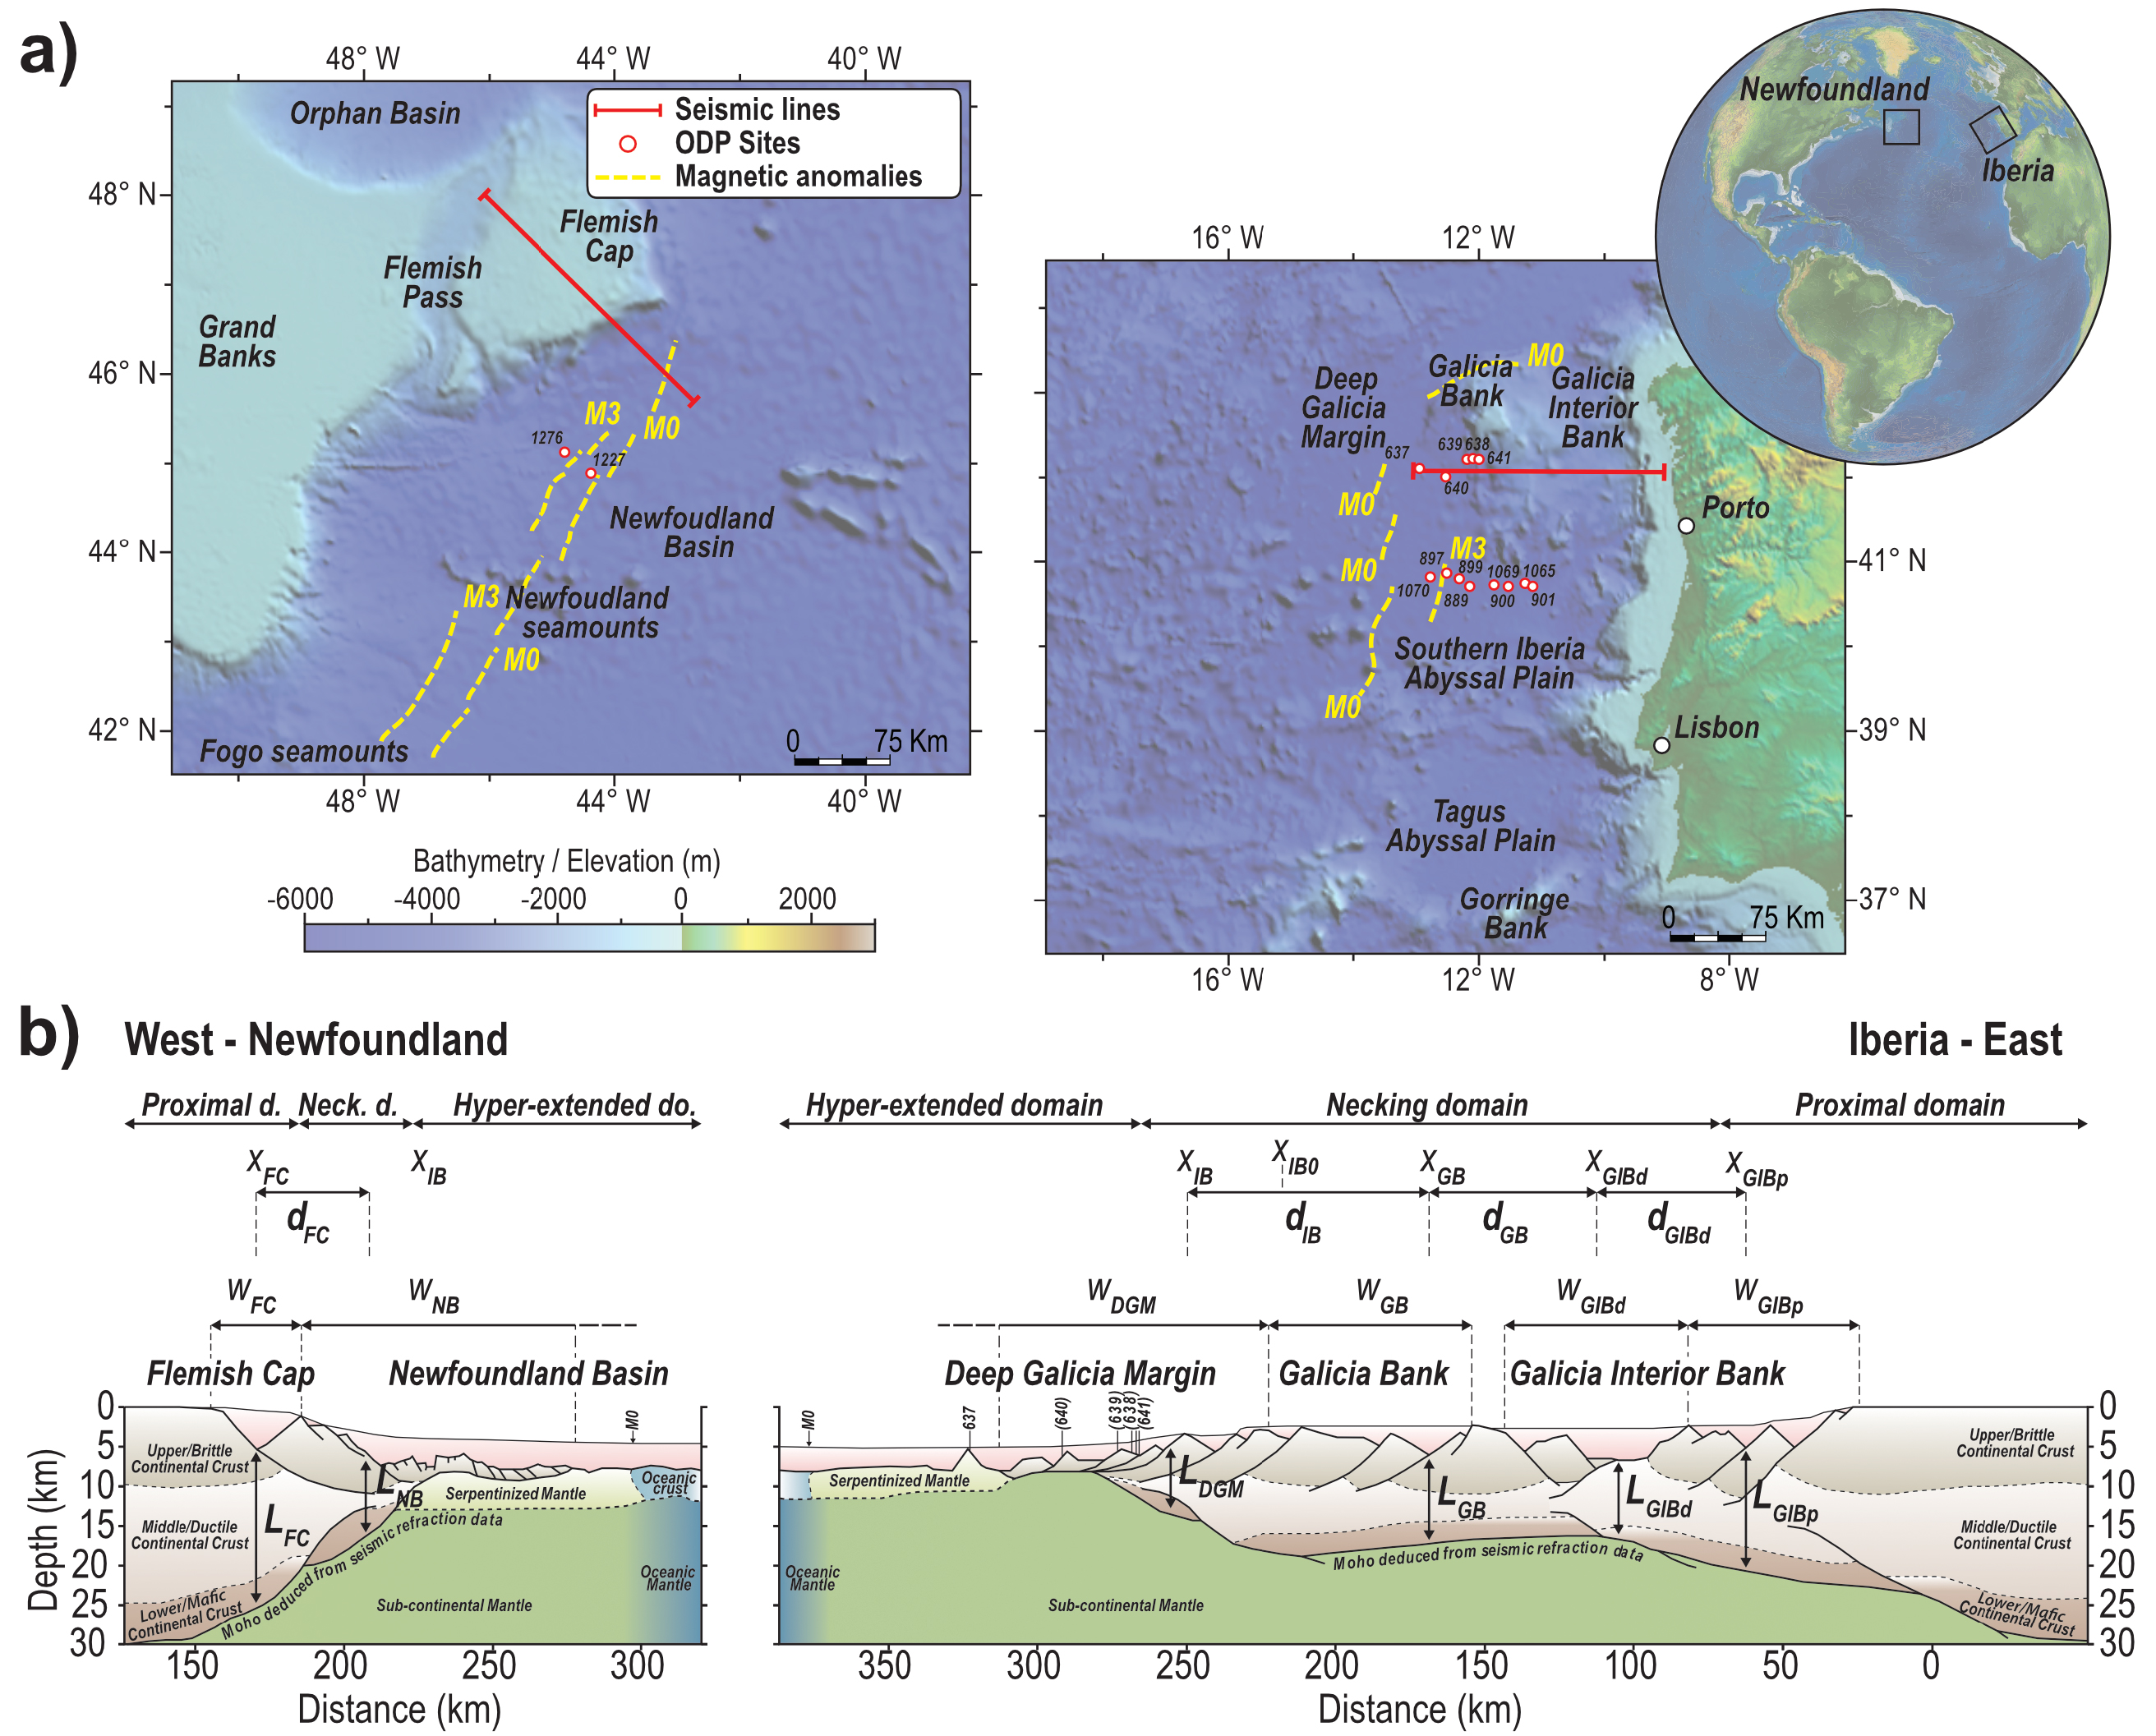
Numerous modelling studies have been already carried out in order to better constrain the evolution and the peculiar architecture of the Iberia–Newfoundland conjugate margins [Nagel and Buck 2004; Lavier and Manatschal 2006; Pérez-Gussinyé et al. 2006; Burov 2007; Mohn et al. 2015; Jeanniot et al. 2016; Brune et al. 2017]. Here, we focus on the north cross-section of Iberia–Newfoundland conjugate rifted margins which is documented as a magma-poor type margin [Manatschal et al. 2007] and therefore can be suitably modelled with our new module.
5.2. Model calibration
As previously noted, our new module is not the most efficient tool to test a large panel of back-stripping scenarios, but aims at computing a mantle scenario thermo-mechanically consistent with the crustal deformation. Following the same methodology as for the benchmark test, we have compartmentalized the Iberia–Newfoundland conjugate rifted margins in five tectonic units of final widths wFC, wNB∕wDGM, wGB, wGIBd and wGIBp. The Newfoundland Basin (NB) and Deep Galicia Margin (DGM) are considered as a single structural unit because they represent a conjugate structure. We separated the Galicia Interior Bank (GIB) into two parts called the GIBd (deep) and GIBp (plateau).
Using the same methodology as for the benchmark test, we derived the values for reconstruction parameters w, x, d, L, and the duration of the modeled rifting phases for the Iberia–Newfoundland rifted margins case (Figure 9b). These parameters are summarized in Table 4. According to the methodology described in the previous part, we calibrated our model to the geophysical model of the conjugate rifted margins of the Iberia–Newfoundland (Figure 9). The results of our calibration are presented in Figure 10. In this showcase of our method on a natural example, contrarily to the benchmark, the sediment packages are accounted for by the calibration. The subsidence history of the forward kinematic modelling in the DGM unit is constrained by subsidence estimates available from Boillot et al. [1988] in the ODP Sites 638–639 (Figure 9 for localization and Figure 11b for data). This information also permits to calibrate the timing and duration of the different modelled rifting phases.
Our favorite kinematically forced model. Brown transparent square delimits the zone of kinematic forcing at each phase.
Synthesis of different reconstruction parameters presented in Figure 9b
| Units/Basins | x | w | d | L |
|---|---|---|---|---|
| GIBp | 50 | 30 | 0 | 20 |
| BIBd | 110 | 30 | 60 | 10 |
| GB | 160 | 30 | 50 | 15 |
| IB (NB+DGM) | 230/240 | 50 | 70 | 10 |
| FC | 170 | 15 | 30 | 20 |
Comparison of kinematically forced simulation with the calibration data used for North Iberia–Newfoundland conjugate rifted continental margins. (a) Comparison of the architecture of passive margins (Moho and basement positions) between the best-fit simulation and data extracted from seismic reflection/refraction interpreted profile of North Iberia–Newfoundland conjugate rifted margins modified from Sutra et al. [2013]. (b) Subsidence model prediction near ODP Sites 638–639 (Figure 9a) for the best-fit simulation and comparison with subsidence estimates of ODP Sites 638–639 from Boillot et al. [1988] and model 3b in Jeanniot et al. [2016] for initial crustal thicknesses of 30, 35 and 40 km.
Lastly, the calibrated model presented in Figure 10 needs 8 phases listed in Table 5 in order to reconstruct the conjugate rifted margins of the Iberia–Newfoundland until break-up (Table 5). Some of them, with large changes in extension velocity, correspond to change in kinematics, others are needed to ensure that the deformation re-localizes at the right place. We have chosen a wide W of P0 to P1 because Tucholke and Sibuet [2007], Mohn et al. [2015] describe the first phase of extension as distributed over a wide area where the crustal thinning was very small. The first phase P0 is necessary to adjust the initial thickness of the crust and to concur to thermal subsidence during the period P1 but the timing is not geologically significant. P2 that starts at 161 Ma, represents the initiation of the second rifting event necessary to adjust the low subsidence rate observed in the subsidence estimates history (Figure 11b). The two next phases, P3 and P4, allow adjusting the calibration to the Galicia Interior Bank (Figure 9a) using a rift migration hypothesis different from those of Sutra et al. [2013] or Jeanniot et al. [2016] for the northern profile but compatible with the data. It allows separating GIB in two parts, the GIB deep and GIB plateau. The P5 and P6 are two short phases required to reconstruct the Galicia Bank and the Flemish Cap. The last kinematic phase P7 is needed to create the Newfoundland Basin (NB) and Deep Galicia Margin (DGM) conjugate margins. This chosen order agrees with the oceanward-younging age of sediments [Boillot and Winterer 1988]. In the model, the crustal break-up occurs at 110 Ma, but the continental mantle breaks at around 90 Ma.
Different kinematic parameters for each phase leading to the calibrated model of the Iberia–Newfoundland conjugate rifted margins
| Phases | P0 | P1 | P2 | P3 | P4 | P5 | P6 | P7 | P8 |
|---|---|---|---|---|---|---|---|---|---|
| vx (cm/yr) | 0.8 | 0.01 | 0.10 | 0.25 | 0.38 | 0.30 | 0.40 | 0.20 | 0.2 |
| te (Myrs) | 2 | 19 | 40 | 44 | 47 | 49 | 50 | 80 | 85 |
| (Ma) | 178 | 161 | 140 | 136 | 133 | 131 | 130 | 100 | 95 |
| ti (Myr) | 0 | 2 | 19 | 40 | 44 | 47 | 49 | 50 | 80 |
| (Ma) | 180 | 178 | 161 | 140 | 136 | 133 | 131 | 130 | 100 |
| X0 (km) | 705 | 705 | 705 | 860 | 800 | 750 | 650 | 680 | 680 |
| W0 (km) | 200 | 200 | 200 | 30 | 30 | 30 | 15 | 50 | 200 |
| E (km) | 16 | 1.7 | 21 | 10 | 11.4 | 6 | 4 | 60 | 30 |
5.3. Discussion and comparison with previous models
The velocity (vx) imposed on the model varies from 0.8 to 0.01 cm/yr with a mean of 0.3 cm/yr all along the simulation until break-up (Table 5). These values are consistent with extensional velocities documented before the break-up in both Nirrengarten et al. [2018] that range from 2.25 cm/yr to 0.2 cm/yr and Sutra et al. [2013] that range from 0.83 cm/yr to 0.25 cm/yr for the Iberian part. However, our calibration significantly differs in terms of subsidence history and while it passes through the grey boxes representing the borehole data at ODP sites 638–639. Notable differences emerge when we compare the predictions in terms of subsidence between our calibration (Figure 11b, red curve) and those published by Jeanniot et al. [2016, model 3b], represented in Figure 11b (black curve). The main difference is the fast uplift and subsidence event associated to the re-localization of the synrift deformation some 100 km east from the early depocenter at around 50 Myr of model time (150 Ma). This large oscillation results from the large crustal strength at the site where the deformation needs to be re-localized in order to fit the crustal thickness. This might be regarded as an artefact of the method, or a wrong choice in the reconstruction of training mainly on the 3D benchmark presented earlier. Yet, this way of re-localizing the deformation is consistent with the dynamics observed in 3D simulation of rift step-over [Le Pourhiet et al. 2017; Neuharth et al. 2021] or of single oblique rift propagators [Le Pourhiet et al. 2018; Jourdon et al. 2020], and is consistent also with the model of propagation proposed by Nirrengarten et al. [2018].
6. Conclusions
This new open-source forward kinematic thermomechanical modelling, associated with a “quick look” approach allows for the calibration and reconstruction of the thermal history of complex rifted margins using a crustal geophysical model and boreholes data. It performs as affectively in adjusting the data as simpler existing methods based solely on kinematics. However, the benchmark of our calibration of a 2D cross-section extracted from a complex 3D thermomechanical model shows that the mechanical feed-back limits the number of possible scenarios during the rifting stage. Our approach is predictive enough for quantitatively constraining the tectono-thermal evolution of the basins by calibrating both the crustal architecture and thermal history of the rifted margins, even when 2D simulations approximate 3D structural problems such as flower structures arising in 2D cross-sections offered by seismic lines. However, if the thermo-mechanical feedback may help to better choose between several possible reconstructions, the solution is non-unique and many flaws still need to be fixed in the future. On the technical side, adding a more quantitative measurement of the misfit of the model with the cross-section. Root means square minimisation of the distance between the mechanically modelled Moho and top-basement horizon and the geophysical model [e.g. Lovely et al. 2010] or volumetric strain field comparison [e.g. Durand-Riard et al. 2010] could help the automation of some parts of the calibration. We could test these approaches using additional synthetic cross-sections. Regarding the geological aspects, the most important bias and limitation of our approach is the impossibility to extract melt in order to model underplating and SDR at volcanic margins. This largely impairs the current possibilities of our software at simulating magmatic margins.
Data availability statement
The data that support the findings of this study are available from the corresponding author upon reasonable request.
The version of ptatin2D code that has been used to produce the results presented here is available publicly at https://bitbucket.org/ptatin/ptatin2d/src/restart/#0d4d8d1677edba59463041e934d9862c7824d921. All python scripts used to post-process the different are available at https://bitbucket.org/ptatin/ptatin2d/src/restart/ or as supplementary data.
Declaration of interests
The authors do not work for, advise, own shares in, or receive funds from any organization that could benefit from this article, and have declared no affiliations other than their research organizations.
Acknowledgements
We are most grateful to TOTAL SA, which funded this post-doctoral work. During the benchmark phase, the calibration was achieved as a “blind-test” by the first author, who did not know from which 3D simulation the third author extracted the 2D profile.