


 CC-BY 4.0
1. Introduction
Climate is the main driver of many components of natural and anthropogenic systems. Societies and ecosystems have adapted to long-term averages of precipitation and air temperature that have remained relatively steady over multi-year scales and can be categorized by climate types. However, the climate has been changing rapidly since industrialization, and future changes are expected to intensify by the end of the 21st century [Pörtner et al. 2022], with potential consequences on water resources [Arnell 1999; Donnelly et al. 2017; Hagemann et al. 2013], biodiversity [Chen et al. 2011; Parmesan and Yohe 2003; Román-Palacios and Wiens 2020; Trew and Maclean 2021], forest [Lancaster and Humphreys 2020; Vajda and Venäläinen 2005; Xu et al. 2020], agriculture [Bhattacharya 2019; Ceglar et al. 2019; Fraga et al. 2020], or the energy sector [Ahmad 2021; Linnerud et al. 2011].
While the Intergovernmental Panel on Climate Change (IPCC) recently released its sixth report [Masson-Delmotte et al. 2021; Pörtner et al. 2022] since 1990, gathering common scientific knowledge, conclusions, and breakthroughs regarding climate change issues, significant challenges remain in spreading this knowledge to the general public and decision-makers [Perga et al. 2023]. Many attempts have been made recently to improve communication on climate change impact, starting with the IPCC itself, which produces shorter and more readable summaries for policymakers and now works with artists to illustrate their main messages (see, e.g., front page of the IPCC special report [Intergovernmental Panel on Climate Change 2018] on Global Warming of 1.5 °C).
In France, as in many countries, impact studies have been conducted at regional or national scales [Bonnet et al. 2020; Chauveau et al. 2013], leading to scientific reports, papers, and adaptation plans (e.g., the French national plan for climate change adaptation [Ministère de la Transition Ecologique et Solidaire 2018]). However, this prolific scientific literature remains mainly among experts and has not yet become common knowledge [Perga et al. 2023], although there are several initiatives ongoing in France that aim to inject the most-up-to-date scientific knowledge in support of decisions made by socio-economic actors and public administrations (see the French Regional Groups of Climate Experts (GRECs) network, https://www.cnfcg.fr/index.php/grec-en). We thus need more efforts to produce data visualization tools for communicating the impacts of climate change [Perga et al. 2023], and maps of climate types can be extremely useful to this end, proving to be simple yet striking communication tools [Oliver 1991].
Climate type maps can be produced based on a typology of climates such as the well-known Köppen–Geiger classification [Köppen 1936] that reflects the different climate conditions that shape landscape diversity. This classification system describes the main climate classes as well as the precipitation and temperature regimes using a three-level label. The Köppen–Geiger classification has been applied using precipitation and air temperature data at a large scale [Ackerman 1941; Beck et al. 2018, 2023; Carvalho et al. 2020; Cui et al. 2021; Peel et al. 2007], but rarely at the local scale [Dubreuil 2022; Eveno et al. 2016]. This means that coarse data, poorly relevant at a local scale, are generally used in such analyses. Results are hence sometimes debatable when analyzing these outputs at the national scale. The case of the French Pyrenees is a clear illustration of this issue, where the poor representation of the mountain range topography results in an east–west climate disparity that is not reproduced by global climate models and in large biases in impact analysis [Pagé et al. 2008].
Projections of future climate types based on the Coupled Model Intercomparison Project Phase 5 (CMIP5) database exist [Beck et al. 2018, 2023], although the authors of this study stressed that a simple “anomaly method” was applied to account for the climate model signal at the global scale. This method accounts for the change in the mean signal only and bypasses finer temporal changes, such as longer drought periods in summer and more intense rainy seasons. This methodological choice can be explained by the difficulty in applying bias correction or downscaling methods at the global scale, since these can be computationally expensive and extremely challenging. Statistical bias correction methods based on quantile mapping [Michelangeli et al. 2009; Verfaillie et al. 2017] adjust the whole distribution of raw climate projections based on local observations and result in a more precise representation of local climate variability. These approaches, which are easier to set up and require lower computation costs, can be applied at the country scale to accurately inform local impact studies.
In this article, we use tailored high-resolution and bias-corrected climate projections to assess local changes in Köppen–Geiger climate types across France by the end of the 21st century. The climate dataset [Soubeyroux et al. 2021] is based on 20 global climate model (GCM)/regional climate model (RCM) couples from the EURO-CORDEX 12-km regional projections driven by CMIP5, covering three emissions scenarios, namely, representative concentration pathways (RCP) 2.6, 4.5, and 8.5. The data have been projected on an 8-km grid and bias-corrected with the ADAMONT [Verfaillie et al. 2017] and CDF-t [Michelangeli et al. 2009] methods, using the SAFRAN reanalysis [Quintana-Segui et al. 2008; Vidal et al. 2010] as the observational reference dataset. We first calculated the observed climate types and compared them with those produced with climate model outputs over the historical period (1976–2005). Then, we explored how climate types are expected to change both temporally and spatially for each emission scenario across the climate model ensemble. In total, we used a set of 84 climate projections to calculate climate types across France over a 30-year sliding window from 1976 to 2099.
2. Methods
2.1. Climate projections
We used air temperature and precipitation data from a selection of bias corrected CMIP5-based EURO-Cordex climate projections [Jacob et al. 2020] provided by the DRIAS portal [Soubeyroux et al. 2021]. These climate projections are based on three greenhouse gas emissions scenarios that reflect different levels of human pressure on the climate. RCP 2.6 is the scenario with the lowest greenhouse gas emissions and a global warming below 2 °C at the end of the century. RCP 8.5 is the scenario without regulation of greenhouse gas emissions and a global warming of 5 °C at the end of the century. RCP 4.5 lies between RCP 2.5 and 8.5, with greenhouse gas emissions stabilizing over the next decade and global warming of approximately 3 °C by the end of the century. These RCPs have been used as forcing data for GCM coupled to RCM in order to account for uncertainty in the future evolution of society and several GCMs and RCMs have been used to account for climate modeling uncertainty. Time series of air temperature and precipitation from RCMs were bias-corrected based on the fine-scale SAFRAN reanalysis [Quintana-Segui et al. 2008; Vidal et al. 2010] using two statistical methods, namely, ADAMONT [Verfaillie et al. 2017] and CDF-t [Michelangeli et al. 2009], based on the quantile–quantile mapping approach. Regarding ADAMONT, the corrections are applied by season and by weather regime [Verfaillie et al. 2017], while the CDF-t method is applied on a monthly basis [Michelangeli et al. 2009]. Combining the RCPs, GCMs, RCMs, and bias correction methods results in a total of 84 climate projections, including 22, 22, and 40 projections for RCPs 2.6, 4.5, and 8.5, respectively (Table 1). The projected times series of temperature and precipitation are available on an 8-km grid in France, at a daily time step from 1976 to 2099.
Combinations of all the GCM, RCM, and RCP scenarios used in the present study
| GCM | RCM | RCP 2.6 | RCP 4.5 | RCP 8.5 |
|---|---|---|---|---|
| CNRM-CM5-LR | ALADIN63 | ✓ | ✓ | ✓ |
| CNRM-CM5-LR | HadREM3-GA7-05 | ✓ | ||
| CNRM-CM5-LR | RACMO22E | ✓ | ✓ | ✓ |
| EC-EARTH | HadREM3-GA7-05 | ✓ | ✓ | |
| EC-EARTH | HIRHAM5 | ✓ | ||
| EC-EARTH | RACMO22E | ✓ | ✓ | ✓ |
| EC-EARTH | RCA4 | ✓ | ✓ | ✓ |
| HadGEM2-ES | ALADIN63 | ✓ | ||
| HadGEM2-ES | CCLM4-8-17 | ✓ | ✓ | |
| HadGEM2-ES | HadREM3-GA7-05 | ✓ | ✓ | |
| HadGEM2-ES | RegCM4-6 | ✓ | ✓ | |
| IPSL-CM5A-MR | HIRHAM5 | ✓ | ||
| IPSL-CM5A-MR | RCA4 | ✓ | ✓ | |
| IPSL-CM5A-MR | WRF381P | ✓ | ✓ | |
| MPI-ESM-LR | CCLM4-8-17 | ✓ | ✓ | ✓ |
| MPI-ESM-LR | RegCM4-6 | ✓ | ✓ | |
| MPI-ESM-LR | REMO2009 | ✓ | ✓ | ✓ |
| NorESM1-M | HIRHAM5 | ✓ | ✓ | |
| NorESM1-M | REMO2015 | ✓ | ✓ | ✓ |
| NorESM1-M | WRF381P | ✓ |
All the combinations were adjusted with the ADAMONT and CDF-t methods and all have simulations over the 1976–2005 historical period.
2.2. Climate classification
The Köppen–Geiger climate classification [Beck et al. 2018; Köppen 1936; Peel et al. 2007] uses mean annual or monthly air temperature and precipitation amounts that are compared with the related thresholds during summer and winter seasons to describe climate conditions on three levels (Table 2). The first level (letters A–E) expresses the main classes within tropical (A), arid (B), temperate (C), cold (D), and polar (E) climates. The second letter expresses the precipitation regime, such as dry summer (s), or no dry season (f). The third letter expresses the air temperature regime, such as hot (a), warm (b), or cold (d) summer. We computed the Köppen–Geiger climate types over 30-year periods from 1976–2005 to 2070–2099, for 8568 grid points at an 8-km resolution in France, and for each of the 84 projections of future climate, as well as for the historical reference computed with data from the French SAFRAN reanalysis [Vidal et al. 2010]. For each grid point and 30-year period, we retained the most frequent climate type (among all the available climate projections) as the dominant one to produce maps and for statistics.
Precipitation and temperature criteria of the Köppen–Geiger climate classification according to Peel et al. [2007]
| 1st | 2nd | 3rd | Description | Criteria | Relevant for France |
|---|---|---|---|---|---|
| A | Tropical | Tcolda ⩾18 | |||
| f | - Rainforest | Pdryb ⩾60 | |||
| m | - Monsoon | Not Af and Pdry⩾ 100 - MAPc/25 | |||
| w | - Savannah | Not Af and Pdry < 100 - MAP/25 | |||
| B | Arid | MAP < 10 ∗ Pthresholdd | |||
| W | - Desert | MAP < 5 ∗ Pthreshold | |||
| S | - Steppe | MAP ⩾5 ∗ Pthreshold | |||
| h | – Hot | MATe ⩾ 18 | |||
| k | – Cold | MAT < 18 | |||
| C | Temperate | Thotf > 10 and 0 < Tcoldg < 18 | Yes | ||
| s | - Dry summer | Psdryh < 40 and Psdry < Pwweti/3 | Yes | ||
| w | - Dry winter | Pwdryj < Pswetk/10 | |||
| f | - Without dry season | Not Cs and Not Cw | Yes | ||
| a | – Hot summer | Thot⩾22 | Yes | ||
| b | – Warm summer | Not Ca and Tmon10l ⩾4 | Yes | ||
| c | – Cold summer | Not (Ca or Cb) and 1⩽Tmon10 < 4 | Yes | ||
| D | Cold | Thot > 10 and Tcold⩽0 | Yes | ||
| s | - Dry summer | Psdry < 40 and Psdry < Pwwet∕3 | |||
| w | - Dry winter | Pwdry < Pswet∕10 | |||
| f | - Without dry season | Not Ds and not Dw | Yes | ||
| a | – Hot summer | Thot⩾22 | |||
| b | – Warm summer | Not Da and Tmon10⩾4 | Yes | ||
| c | – Cold summer | Not Da, not Db, and not Dd | Yes | ||
| d | – Very cold winter | Not Da and not Db and Tcold < −38 | |||
| E | Polar | Thot < 10 | Yes | ||
| T | - Tundra | Thot > 0 | Yes | ||
| F | - Frost | Thot⩽0 |
a Tcold = monthly temperature of the coldest month; b Pdry = monthly precipitation of the driest month; cMAP = mean annual precipitation; dif precipitation during winter > 0.7 ∗ MAP, then Pthreshold = 2 ∗ MAT, else Pthreshold = 2 ∗ MAT + 28; eMAT = mean annual temperature; f Thot = monthly temperature of the hottest month; g Tcold = monthly temperature of the coldest month; h Psdry = monthly precipitation of the driest month in summer; i Pwwet = monthly precipitation of the wettest month in winter; j Pwwet = monthly precipitation of the wettest month in winter; k Pswet = monthly precipitation of the wettest month in summer; l Tmon10 = number of months with temperature > 10 °C.
3. Results
3.1. Climate models reproduce historical climate types well
Observed climate types computed with the SAFRAN reanalysis across France for the period 1976–2005 (Figure 1b) show a large proportion of land under a temperate climate, with 93% of France associated with a first level of the Köppen–Geiger classification in the category temperate (C), followed by 6.2% in the category cold (D), and 0.8% in the category polar (E) climate. Temperate climate grid points stand in the low-elevation areas. They are distributed among temperate climates without a dry season and warm summer (Cfb) for 85% of France, except for the Mediterranean region and the island of Corsica (southeast France), where temperate climates with a dry season and a hot (Csa, 4.8%) and warm (Csb, 2.4%) summer are located in low and high elevations, respectively. A few grid points show a temperate climate without a dry season and hot summer (Cfa, 0.6%) at the transition zone between Csa and Csb in southeast France, in low-elevation areas between the Pyrenees, Massif Central, and Alps mountain ranges (see Figure 1a for the main mountainous areas and regions of France mentioned here). The cold climate grid points are located in mid-mountainous regions such as the Vosges (northeast France), Jura (mid-east), Alps (southeast), Massif Central (mid-south), and the Pyrenees (southwest). They are distributed among areas of cold climate without a dry season and a warm summer (Dfb) for 4.5% of France, mostly located in the low-elevation mountainous areas, while areas of cold climate without a dry season and cold summer (Dfc, 1.6%) stand in middle-elevation mountainous areas. One grid point of cold climate with a dry and warm summer (Dsb, 0.01%) is located at a high-elevation grid point on Corsica. The polar climate grid points consist of tundra (ET, 0.8%) located in high-elevation areas of the Alps and Pyrenees.
Maps of (a) elevation and French regions mentioned in the text, (b) the Köppen–Geiger climate types computed with SAFRAN, and (c) the most frequent climate type computed with the climate model outputs across France over the historical time period (1976–2005). The red squares highlight differences in climate types between those computed with SAFRAN and the most frequent one computed with climate model outputs.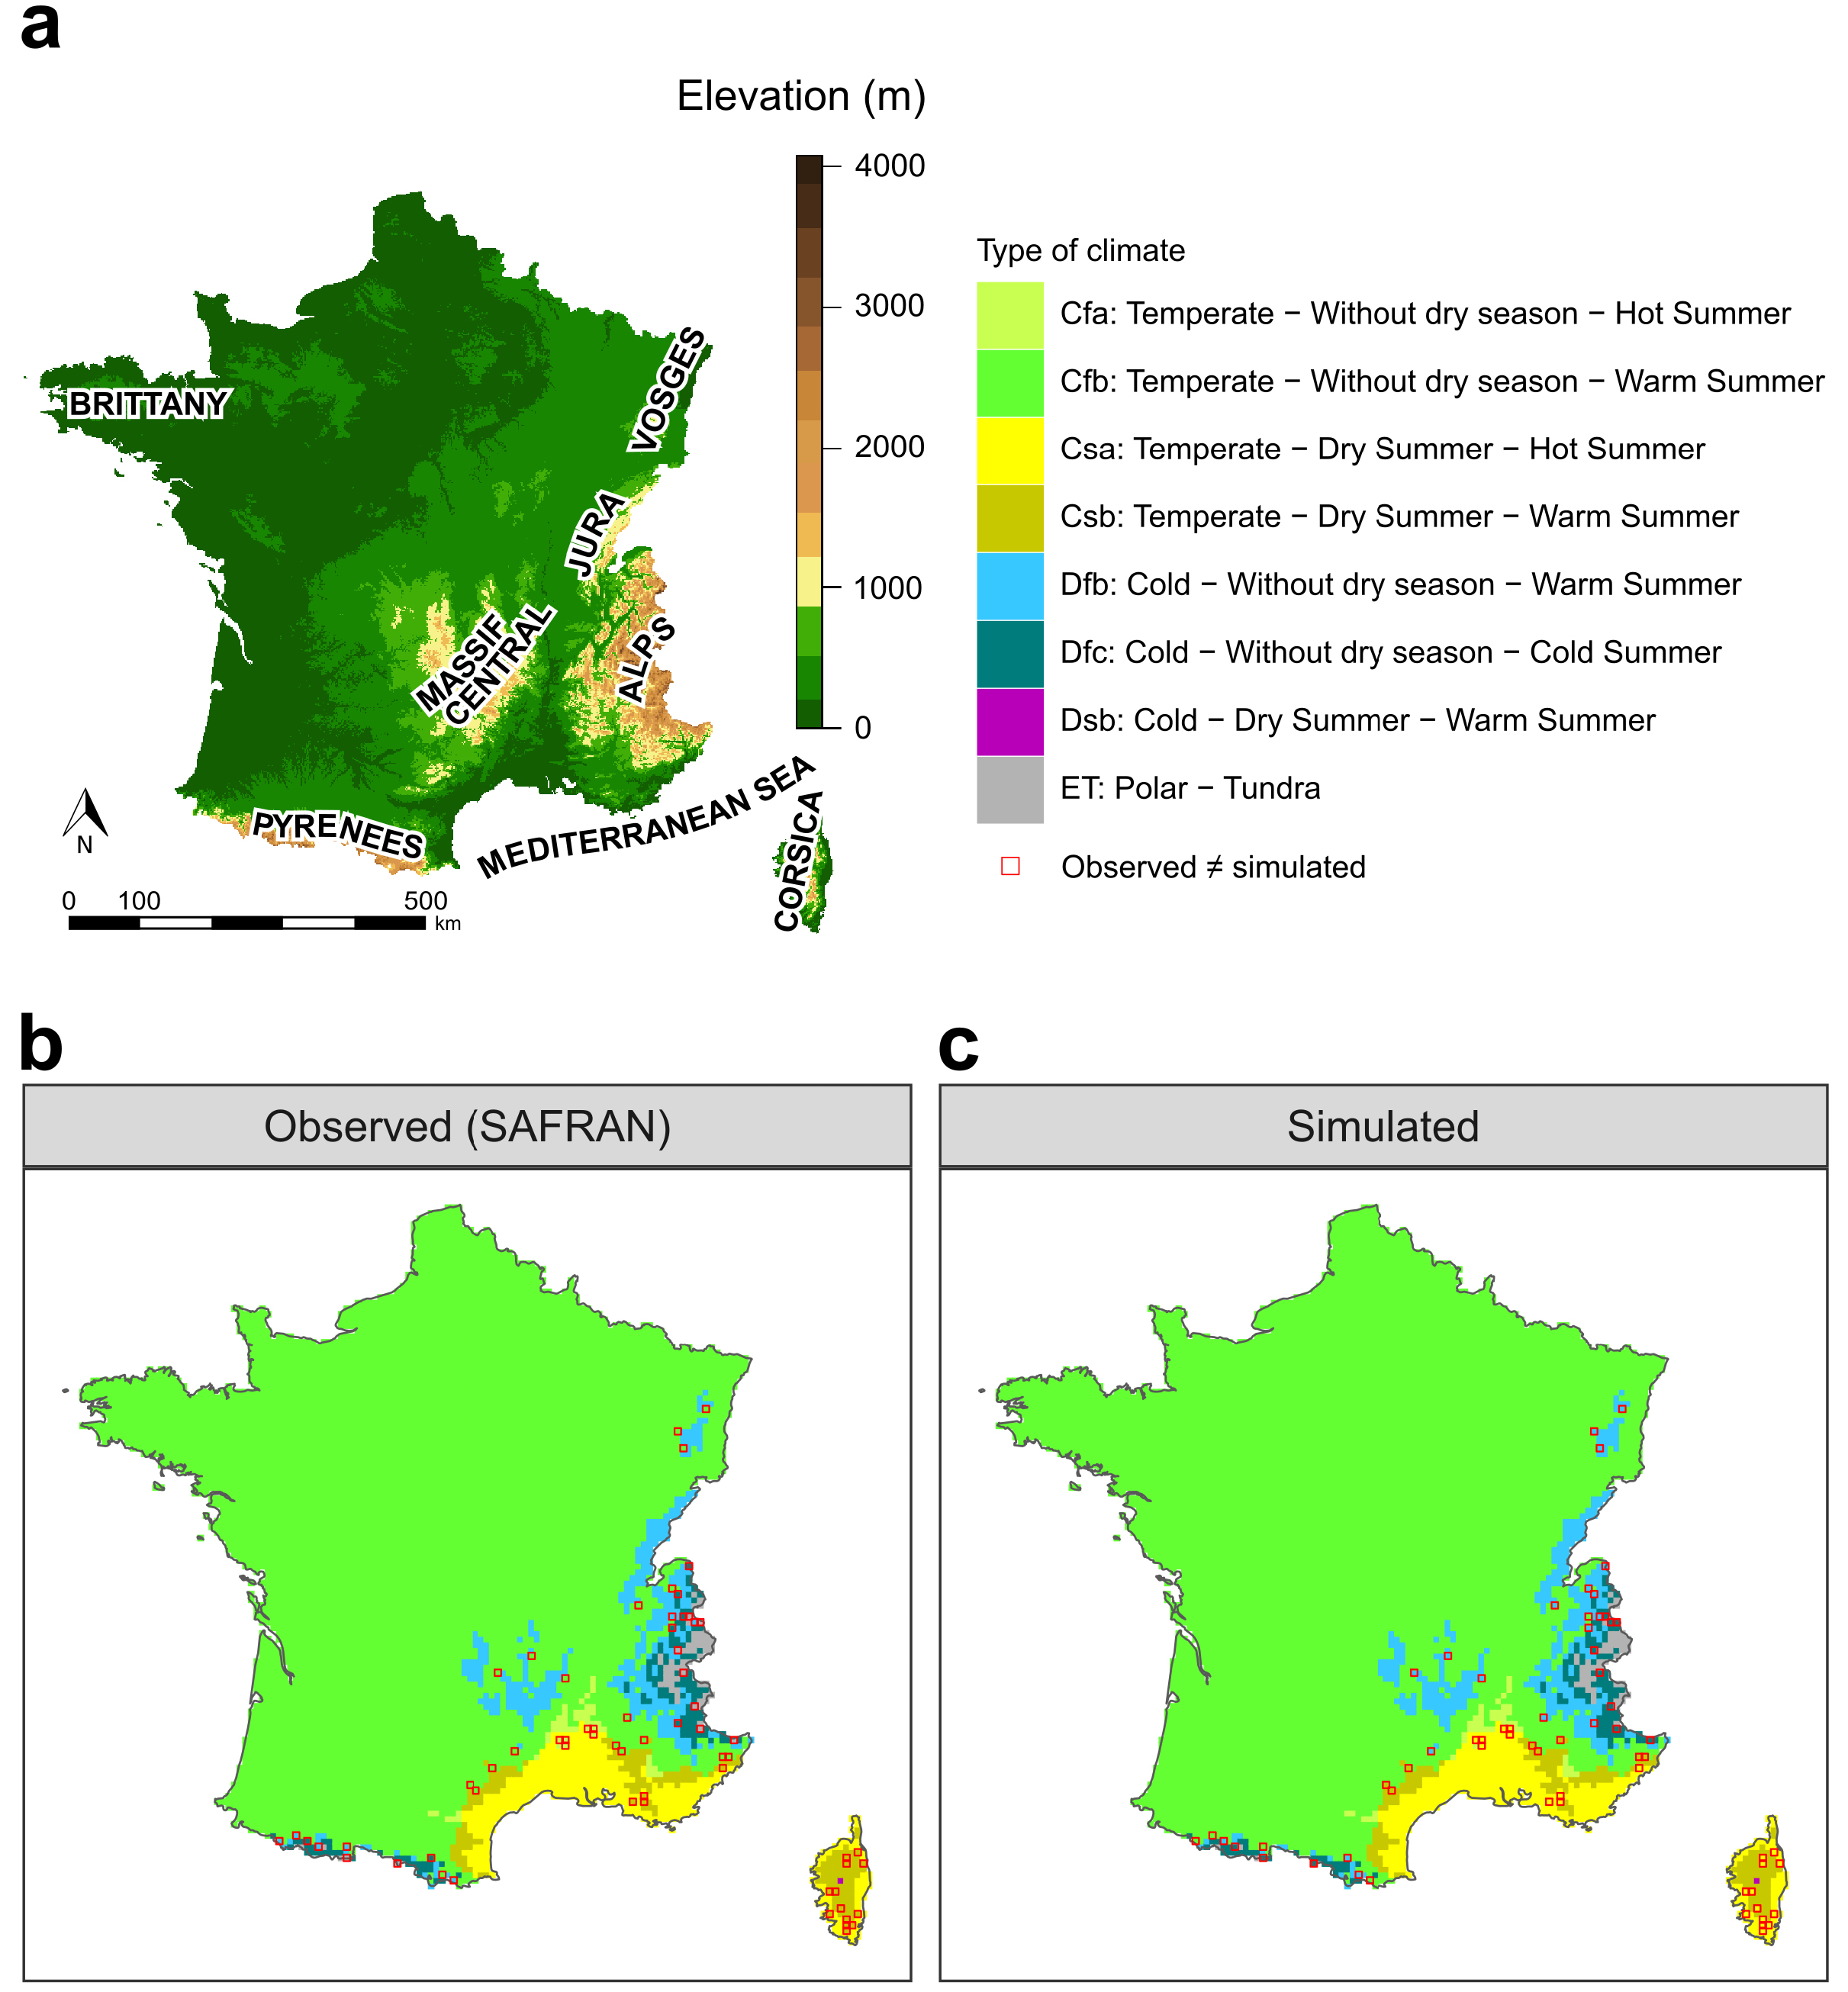
The most frequent climate types computed with climate model outputs for the historical time period (1976–2005) are in agreement with those computed with the SAFRAN data (Figure 1c). Indeed, the most frequent climate type computed with the climate model outputs corresponds with the type computed with the SAFRAN data for 99.24% of the grid points. A further analysis showed that the remaining 0.76% of grid points are divided into 0.70% for which the second most frequent simulated climate type matches the observed one, and only 0.06% for which neither the first nor the second most frequent simulated climate types match the observed one. Disagreements are observed for grid points located at transition zones between two climate types, and in steep regions such as the Alps and Pyrenees (Figure 1). The agreement rates between climate models (i.e., the proportion of climate models that predict the climate type most frequently simulated) are very high for the historical time period. Among all grid points, the mean agreement rate is 95% (minimum and maximum of 46% and 100%, Figure 3) with most of the grid points (90%) showing agreement rates higher than 83%.
Overall, these results show the good ability of climate modeling chains to simulate the present climate over France, which was expected given the statistical processing applied in this study. This lends confidence to the use of these simulations in our study.
3.2. Future climate types diverge with RCPs starting from mid-century
In the near future (2020–2049), moderate changes in climate types are projected regardless of the greenhouse gas emissions scenario (17–20% of grid points, see Figure 2 and Supplementary Figure S1) compared to the historical 1976–2005 period.
Maps of the Köppen–Geiger climate types computed with climate projection data for France during the historical period (1976–2005), the near future (2020–2049), and the far future (2070–2099) for RCPs 2.6, 4.5, and 8.5. The colors refer to the most frequent climate type computed among all climate projections.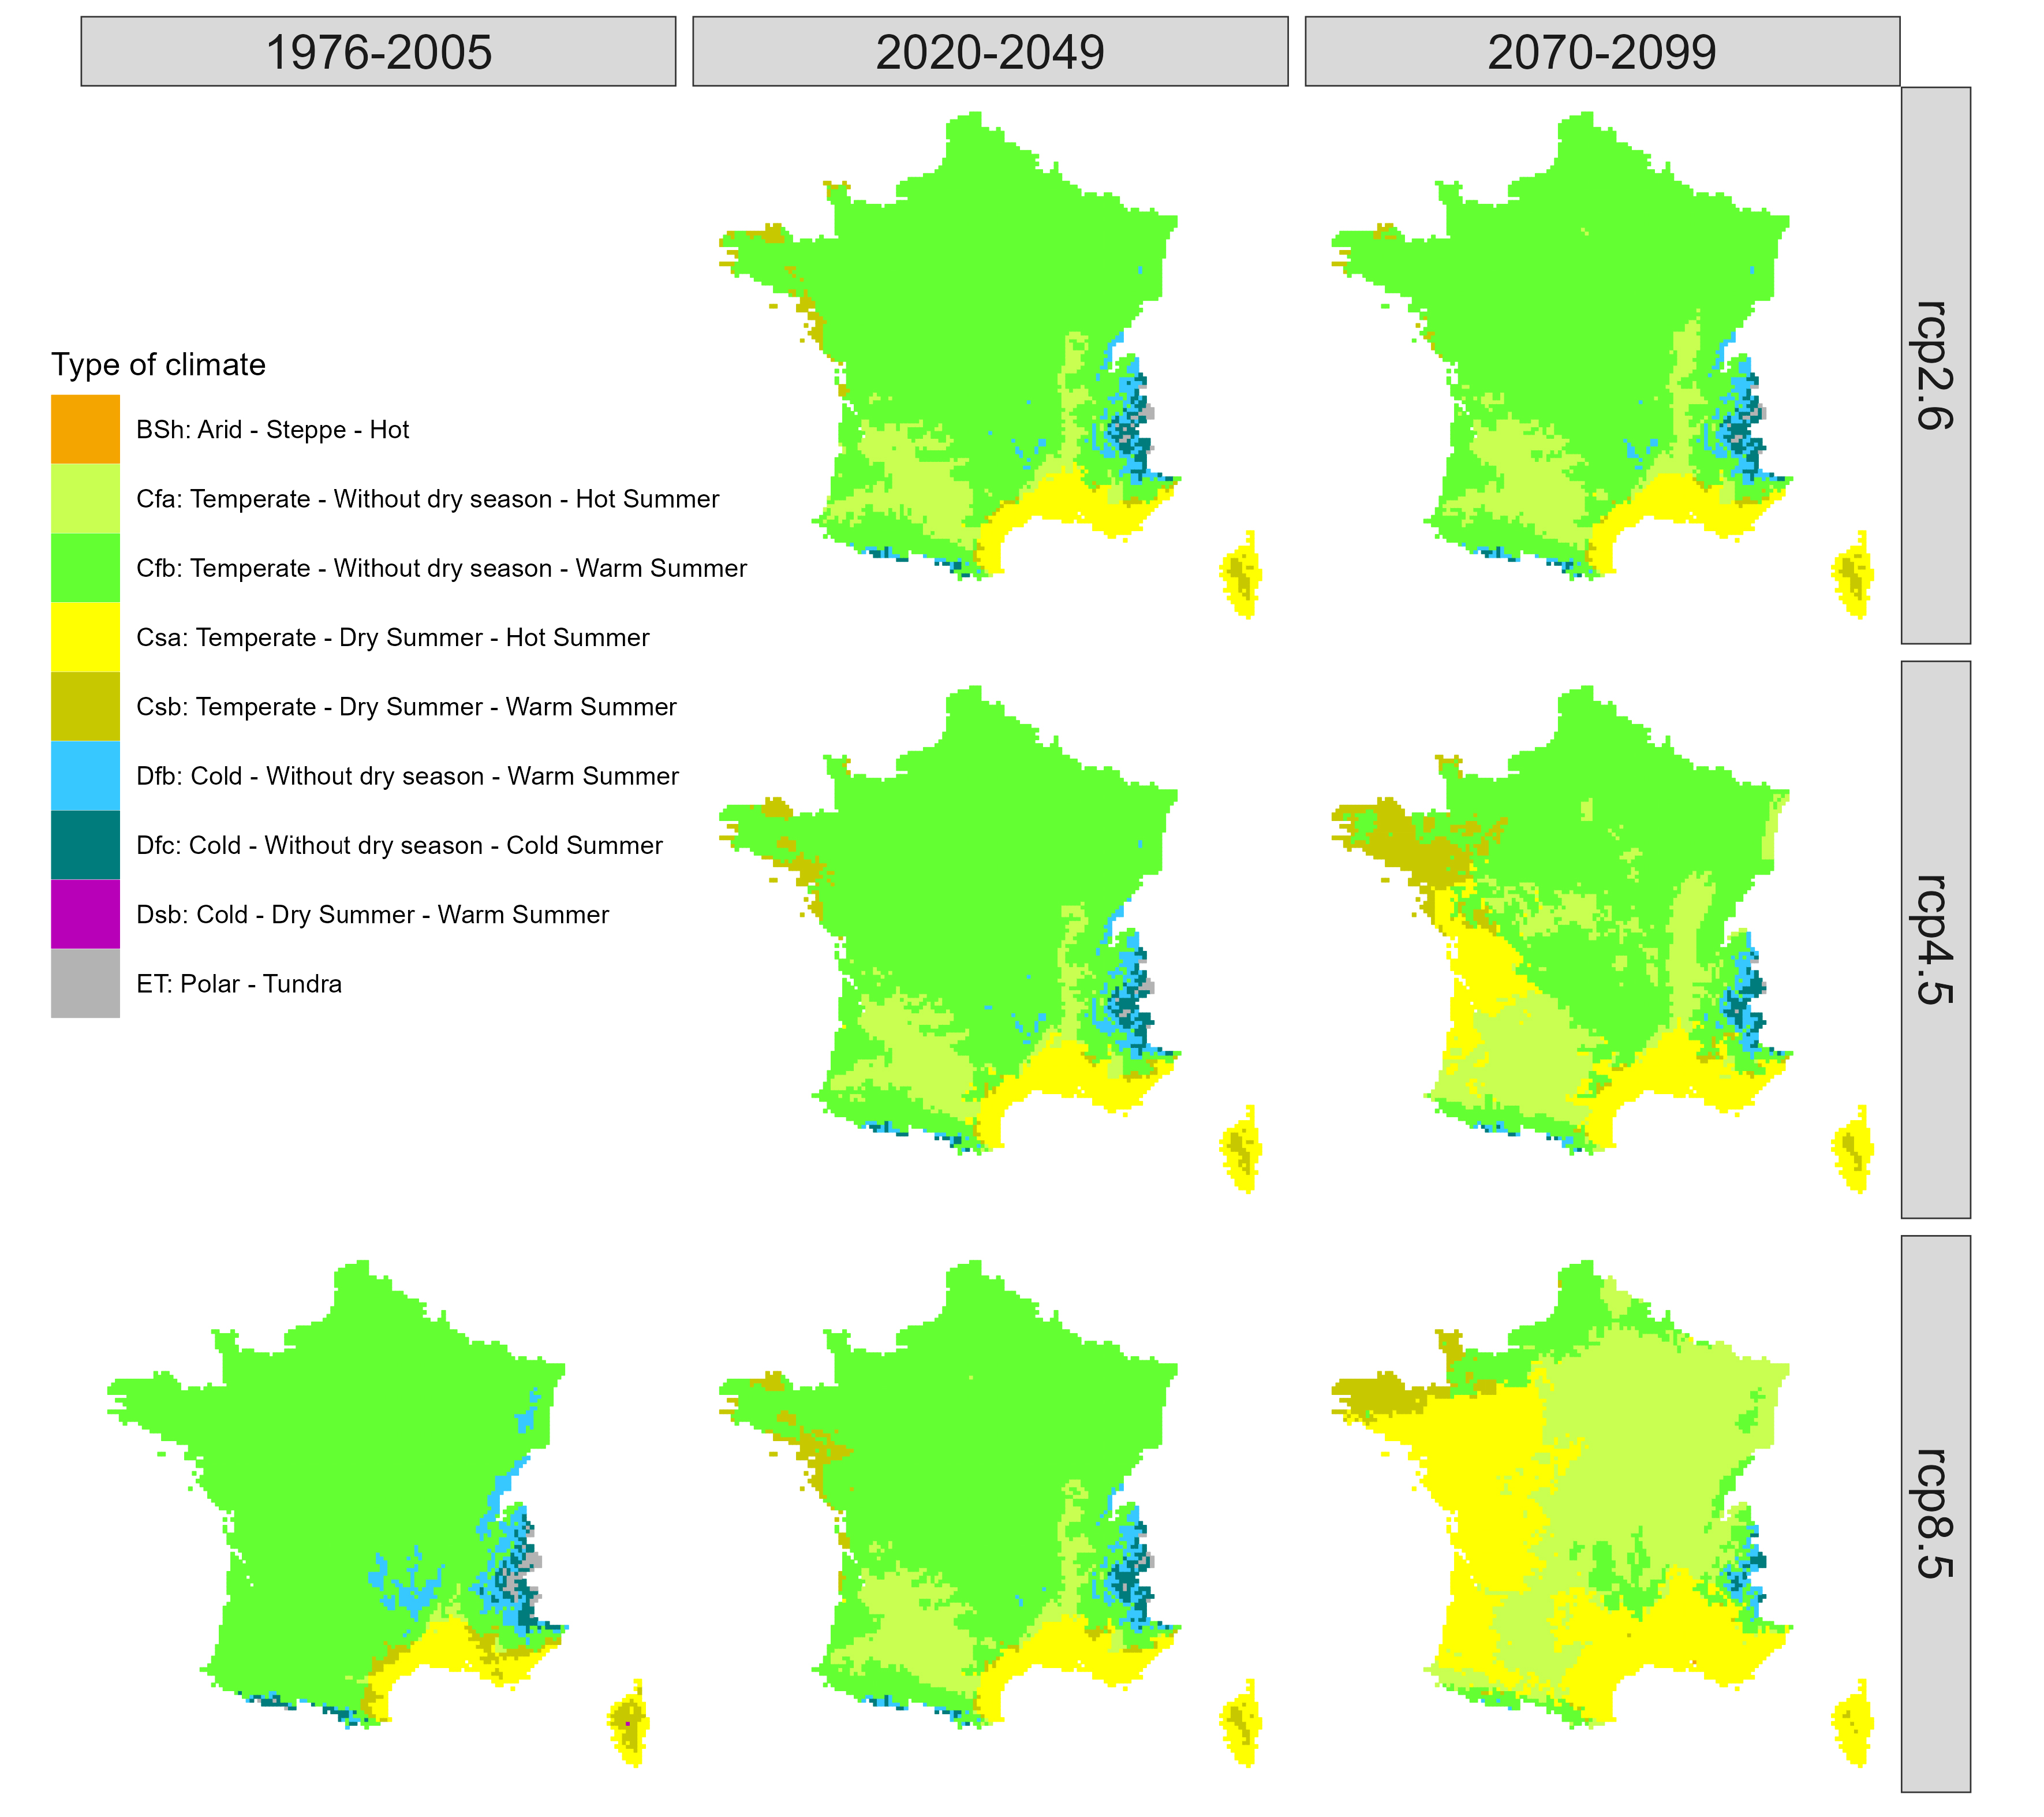
Agreement rates (i.e., the proportion of climate models that predict the climate type most frequently simulated, see Figure 2) for France during the historical period (1976–2005), and in the near-future (2020–2049), and far-future (2070–2099) periods, for RCPs 2.6, 4.5, and 8.5.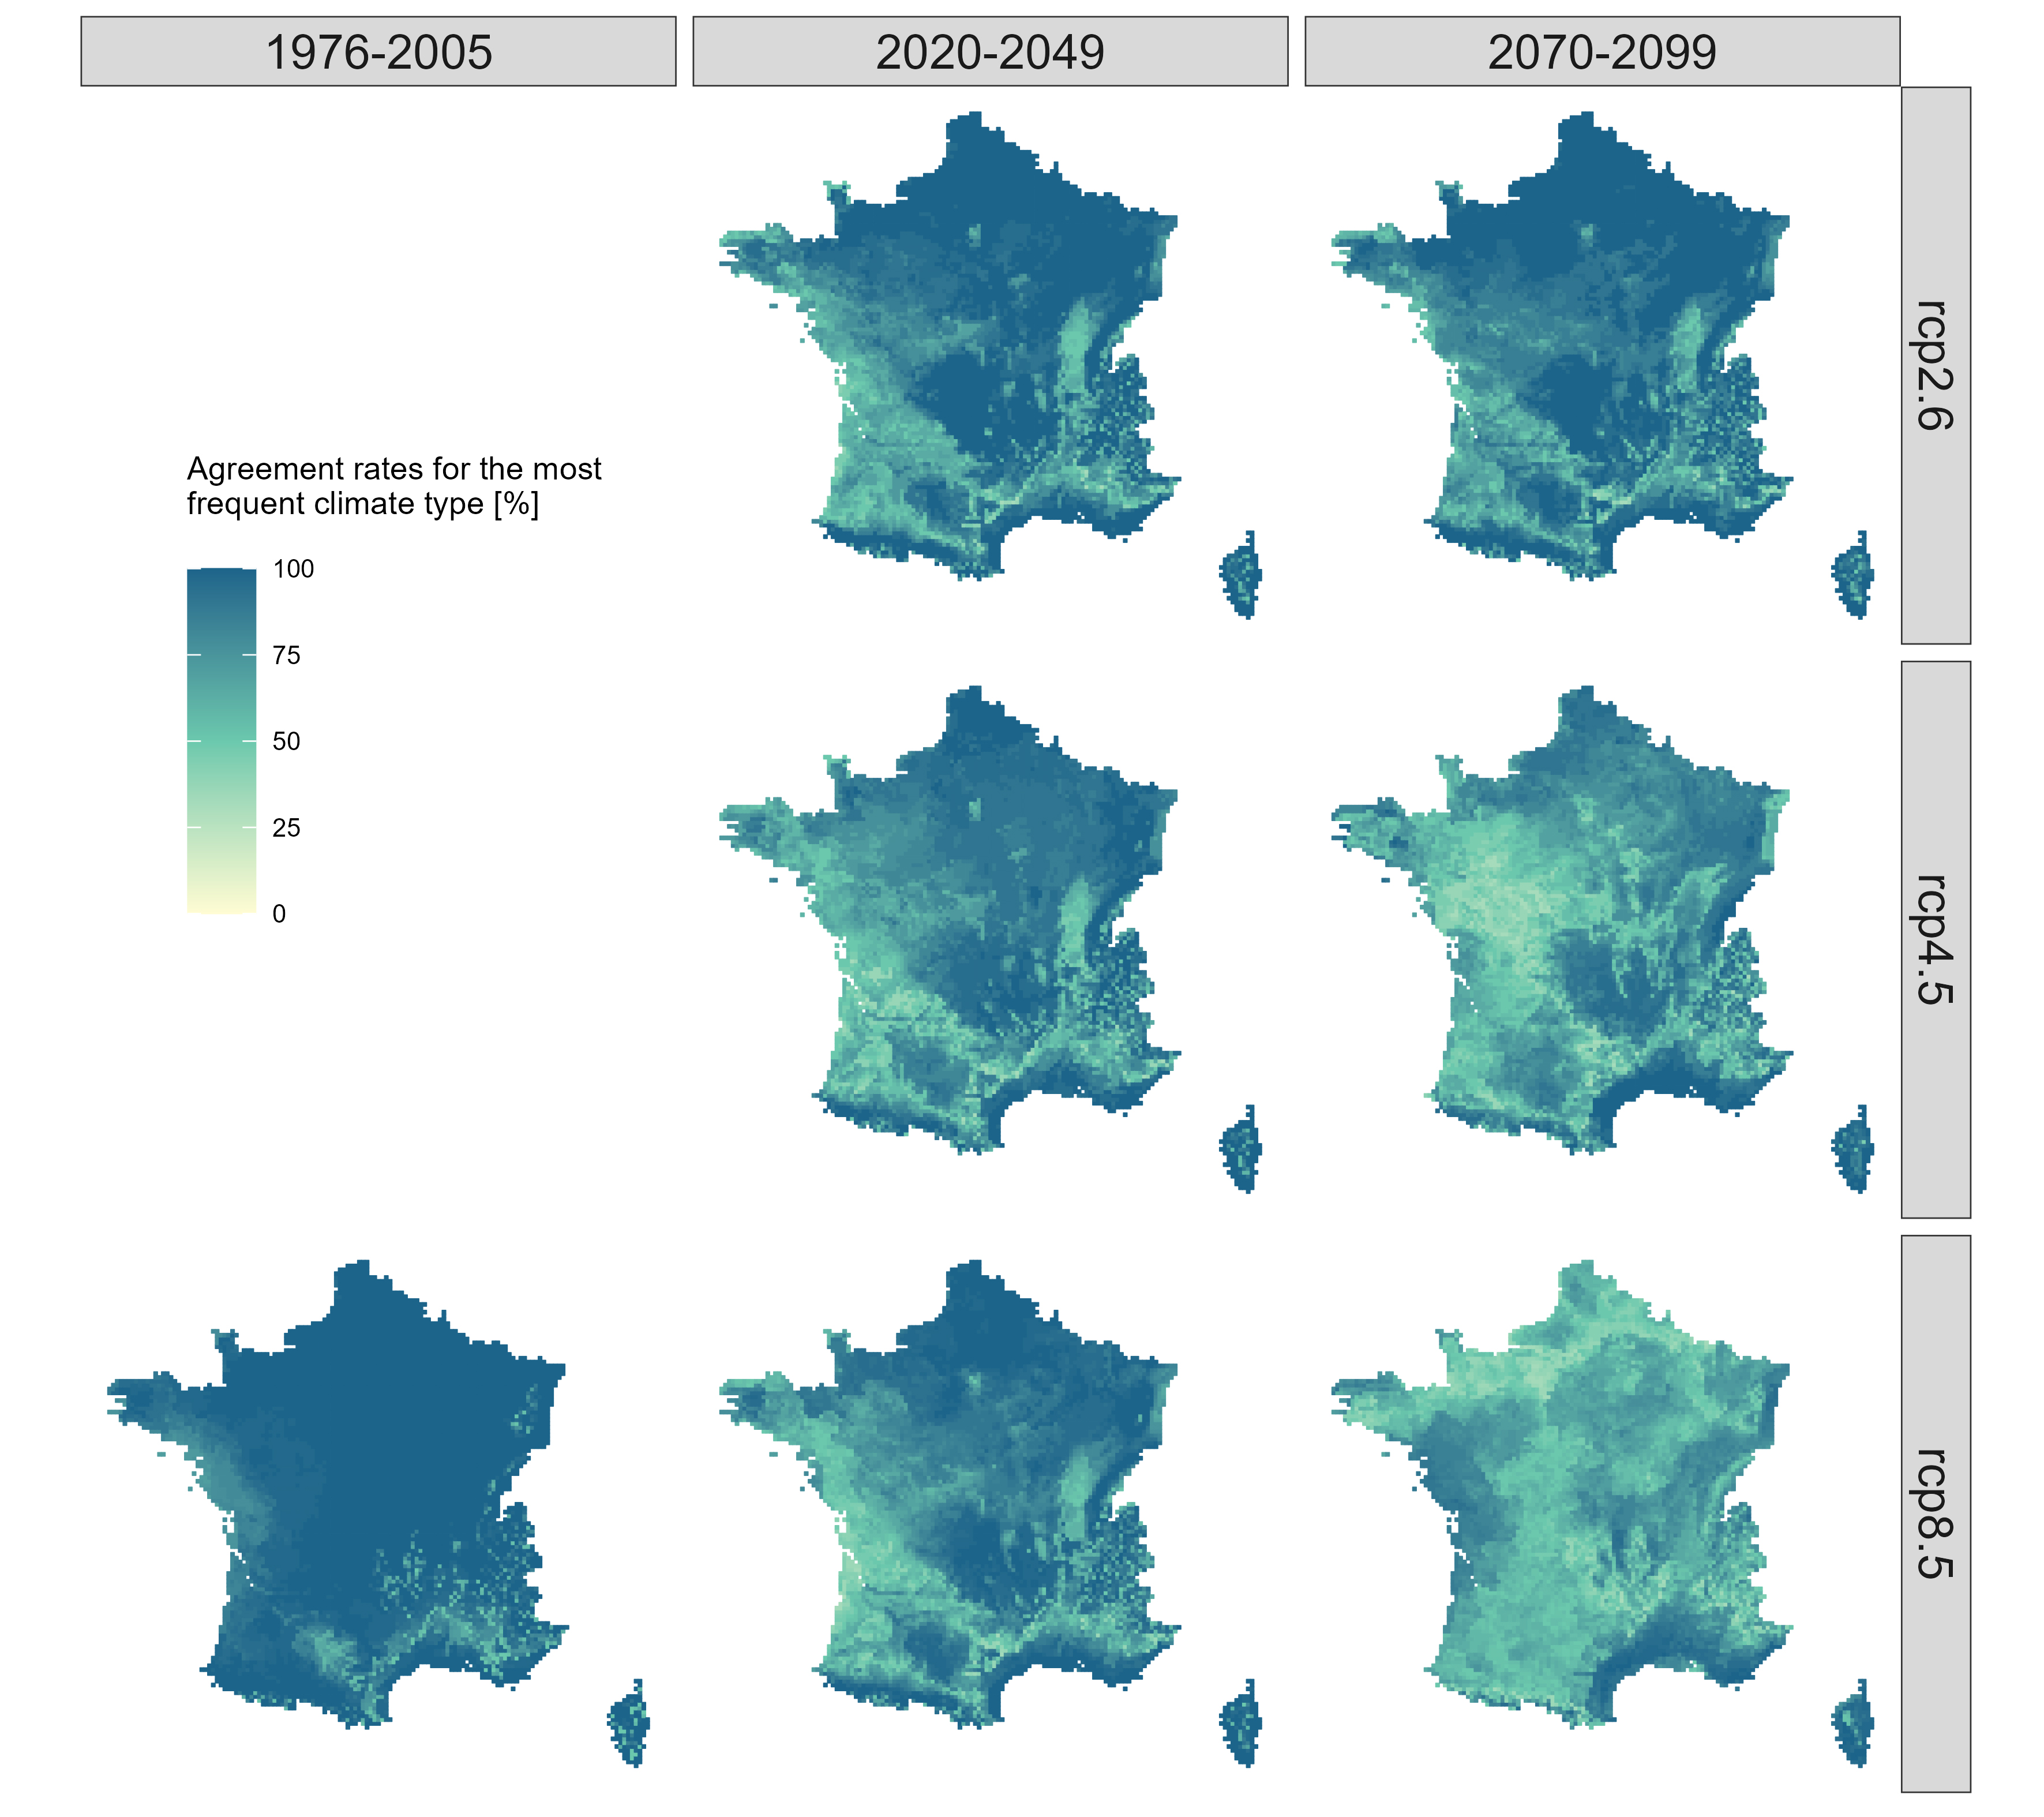
Changes in the near future are mainly constrained to the mid-mountainous regions, the south, and the western France (Figure 2). Low-altitude regions in southwest and southeast France show major changes with approximately 9% of the grid points shifting from a temperate climate without a dry season and warm (Cfb) to hot (Cfa) summer (Figure 2 and Supplementary Figure S1). The Vosges, Jura, Massif central, and Alps mid-mountainous regions show a transition from a cold to a temperate climate without a dry season and warm summer (from Dfb to Cfb for 5% of France). Western France also shows local shifts from a temperate climate without a dry season and warm summer (Cfb) to a dry season (Csb).
However, in the far future (2070–2099), the spatial distribution of climate types shows diverging trajectories depending on the emissions scenario with a breakpoint around 2040 (Figure 5 and Supplementary Figure S1). This leads to 18%, 42%, and 86% of the grid points showing changes in climate type by 2070–2099 for RCPs 2.6, 4.5, and 8.5, respectively. In the far future and under the high-emissions scenario (RCP 8.5), the climate types remain unchanged for a very small number of grid points located in the north (Cfb) and around the Mediterranean coast (Csa). Compared with the historical period, the proportion of grid points with a temperate climate without a dry season and warm summer (Cfb) decreases from 85% to 14% of France (Figures 2, 4, and 5). The Cfb climate type changes to mostly a temperate climate and a hot summer without a dry season (Cfa, 43%) northeast, and with a dry season (Csa, 29%) in the west of France (Figures 2 and 4). In the mountainous regions, almost all grid points with a cold climate without a dry season and warm (Dfb) or cold (Dfc) summer change to a temperate climate (Csb), and all grid points with a polar climate (ET) change to a cold climate Dfc and Dfb (Figures 2 and 4). Brittany, located in northwestern France, would see a shift from a temperate climate with a warm summer and no dry season (Cfb) to a temperate climate with a dry and warm summer (Csb) and with a dry and hot summer (Csa), the latter being typical of the Mediterranean climate in the historical period (Figure 2). Based on the climate projections, a new—for France—climate type could also be expected in southeast France where a grid point showing a temperate climate with a dry and hot summer (Csa) would shift to an arid steppe hot climate (BSh, Figure 2 and Supplementary Figure S2).
Percentage of grid points with most frequent climate types among climate projections and their transitions from the historical (1976–2005) to the far-future period (2070–2099) for RCPs 2.6, 4.5, and 8.5. Percentage values are calculated on the total surface area of France, all types of climate considered.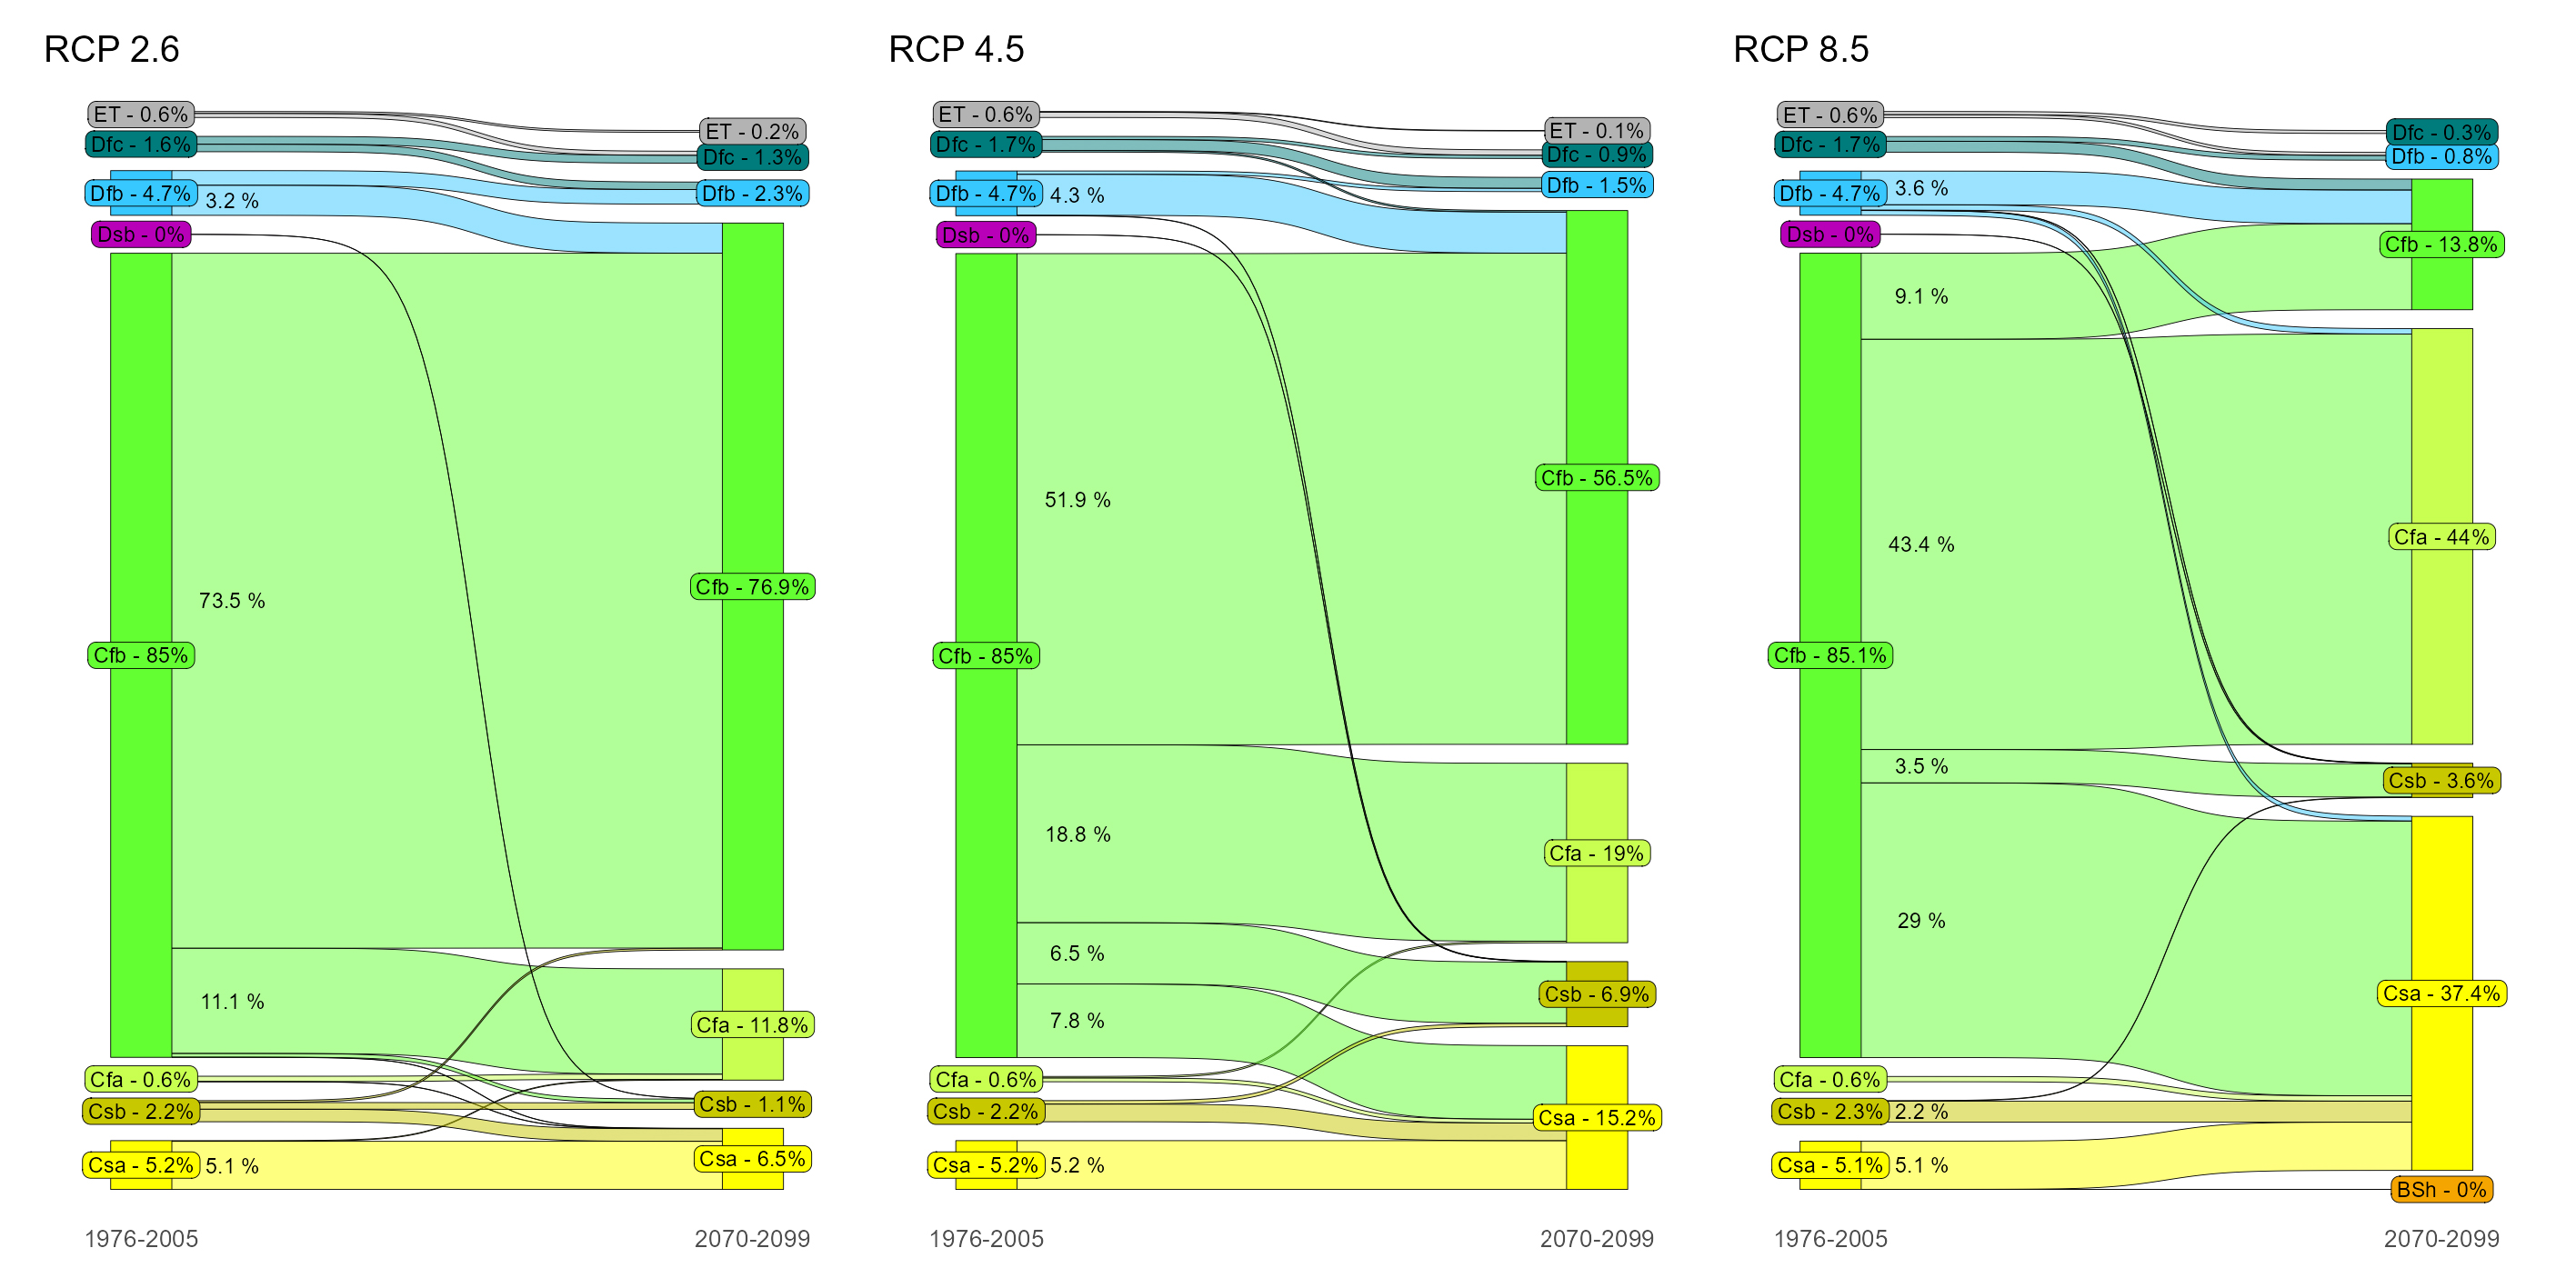
Proportion of France covered by the most frequent climate types (among climate projections) for 30-year rolling periods from 1976 to 2099 for RCPs 2.6, 4.5, and 8.5. The vertical gray lines indicate the center of the historical, the near-future, and the far-future periods, respectively.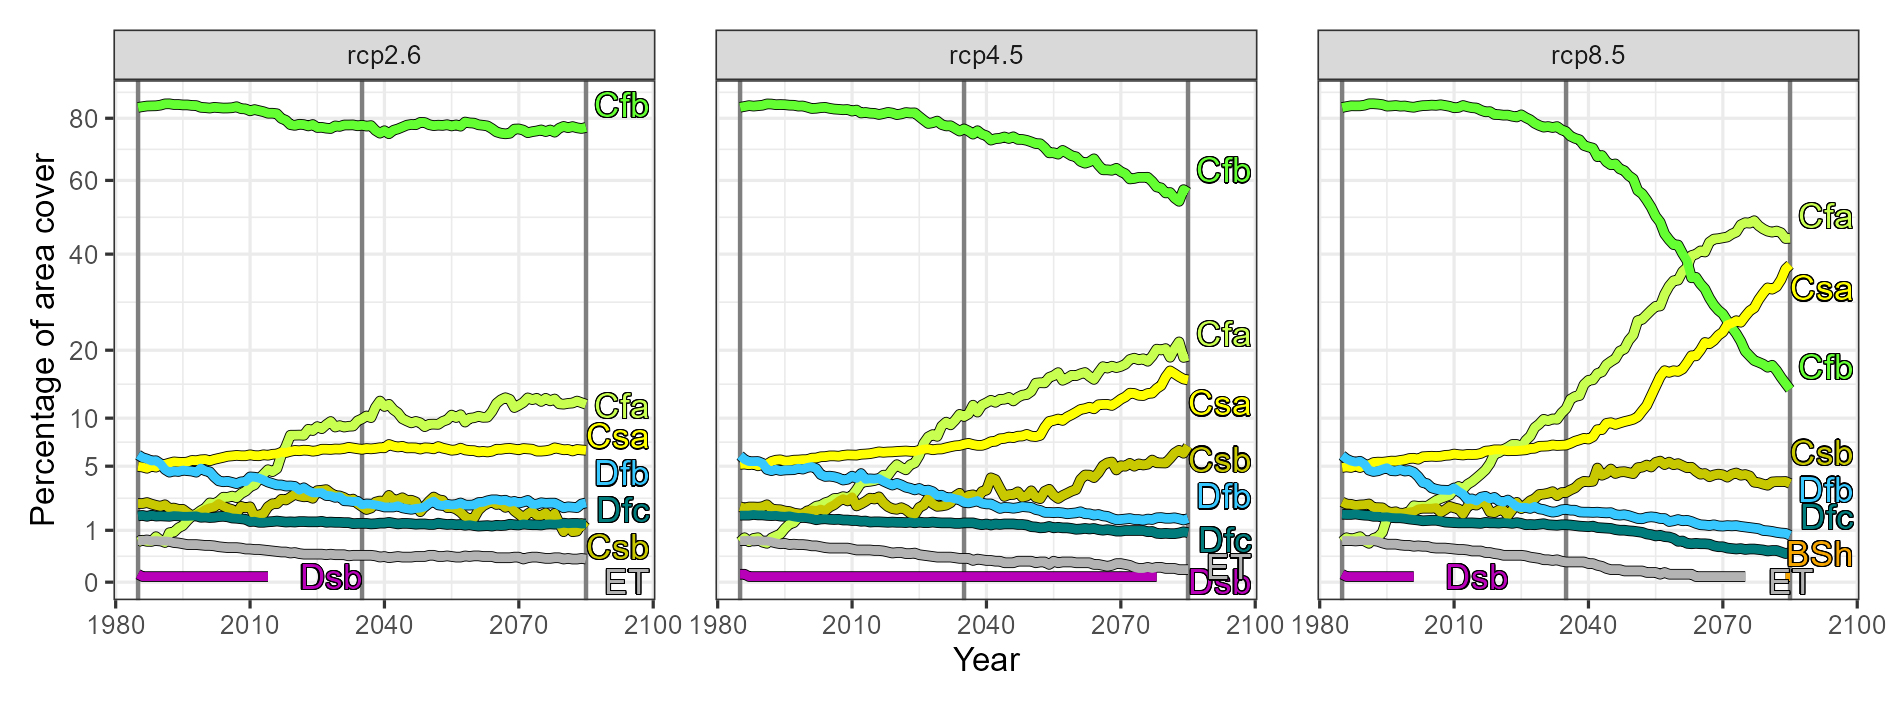
The agreement rates between projections of the most frequent climate type computed with the climate model outputs decrease in the future and for the high-emissions scenario, compared to the agreement rates of the historical period (Figure 3). For the 2070–2099 period, the mean (quantiles 10th and 90th) agreement rates are 88% (64–100%), 71% (45–91%), and 65% (48–85%) for RCPs 2.6, 4.5, and 8.5, respectively. The lower agreement rates are essentially observed in transition zones between two climate types (Figures 2 and 3).
3.3. Changes in climate type: towards a drier and warmer climate
The transitions in climate types share the same spatiotemporal patterns from 1980 to 2040, regardless of the emissions scenario (Figure 6). However, after 2040, the speed and extent of transitions from one type to another depend on the emissions scenario, with the higher and lower spread observed for the high- and low-emissions scenarios, respectively (Figures 5 and 6). The intermediate-emissions scenario (RCP 4.5) shows intermediate spatial and temporal patterns of climate transitions.
Spatial and temporal changes of climate type transition of the most frequent climate types (among climate projections) in France for RCPs 2.6, 4.5, and 8.5. The first and second labels in the column headers refer to the climate type before and after the transition, respectively, while the color bar refers to the year of transition.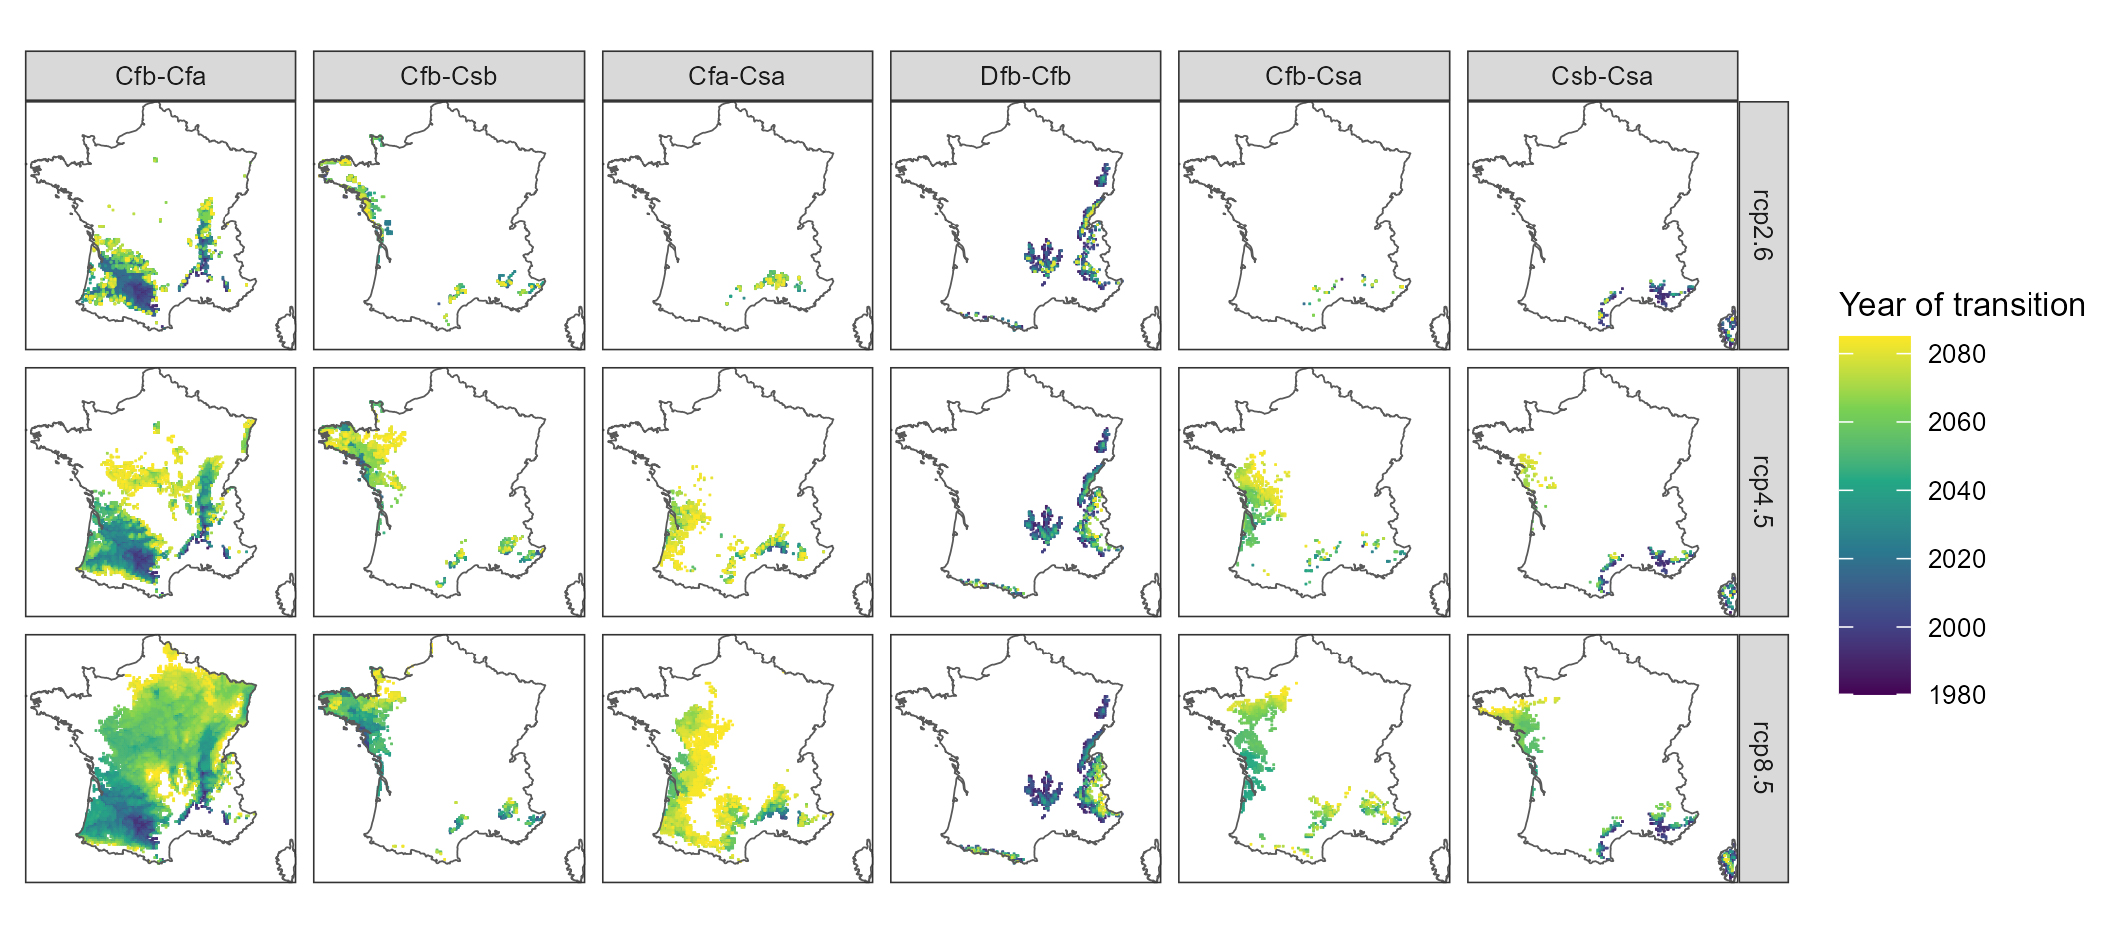
The low-altitude areas between the Massif central and the Pyrenees mountains and the Alps in southeast France show a transition from a temperate climate without a dry season and a warm to hot summer (from Cfb to Cfa) that starts around 2000 (Figure 6 and Supplementary Figure S3). For the low-emission scenarios, the Cfb–Cfa transition spreads slowly northward, while remaining spatially limited to southwest and southeast France. However, for RCPs 4.5 and 8.5, this transition shows a wider spread up to the center of France by 2050 and to the north and east of France, as well as in the mid-mountainous regions by 2080. This climate transition is expected to spread northward at a mean velocity of approximately 7 km⋅yr−1 for the high-emissions scenario (700 km in ca. 100 years, Figure 6). Some of these areas might even change a second time from no dry season to a dry summer (from Cfa to Csa) in the west and south of France after 2070 for the high-emission scenario (Figure 6 and Supplementary Figure S3).
The west of France would transition from a temperate climate without a dry season and warm summer to a temperate climate with a dry and hot summer (from Cfb to Csa) southwest, and to a temperate climate without a dry season (from Cfb to Csb) northwest, after 2040 with RCPs 4.5 and 8.5 (Figure 6 and Supplementary Figure S3). Under the high-emission scenario, some areas in Brittany (northwest France) might also change a second time from warm to hot summers (from Csb to Csa) by the end of the century (Figure 6 and Supplementary Figure S3).
The mountainous regions would transition from a cold climate without a dry season and a warm summer to a temperate climate (from Dfb to Cfb). This trend starts by 2000 in the low-altitude regions and spreads in higher mountains until 2040 regardless of the emission scenario (Figure 6), although the higher altitudes would see climate type changes with RCPs 4.5 and 8.5 only.
Furthermore, climate types in mountainous regions are layered based on elevation: 0–650 m for Cfa, Cfb, and Csa, and 200–1500 m, 450–1900 m, 1100–2800 m, and 1600–3300 m for Csb, Dfb, Dfc, and ET, respectively, over the historical period (Figure 7). For the high-emission scenario, an upward shift of approximately 1000 and 650 m is expected for the Dfb and Dfc climate types, respectively, while the ET climate type disappears by the end of the century (corresponding to a mean vertical velocity of approximately 11, 6.4, and 6.3 m⋅yr−1, respectively). These mountainous Dfb, Dfc, and ET climate types will be replaced by the Cfb climate type under the high-emission scenario (Figures 4 and 7). Reversely, a downward shift of approximately 500 m is expected for the Csb climate type, which was mostly located on Corsica in 1976–2005, while we expect it to be located in Britain region in 2070–2099 (Figures 2 and 7).
Distributions of the elevations for each climate type (the most frequent one among climate projections) for RCPs 2.6, 4.5, and 8.5 and for each period. Statistics are displayed by boxplots where the lower and upper hinges correspond to the 25th and 75th quantiles, the horizontal bar is the median, the upper and lower whiskers extend up to 1.5 times the interquartile distance from the 25th and 75th quantiles, and the dots are the outliers beyond the end of the whiskers.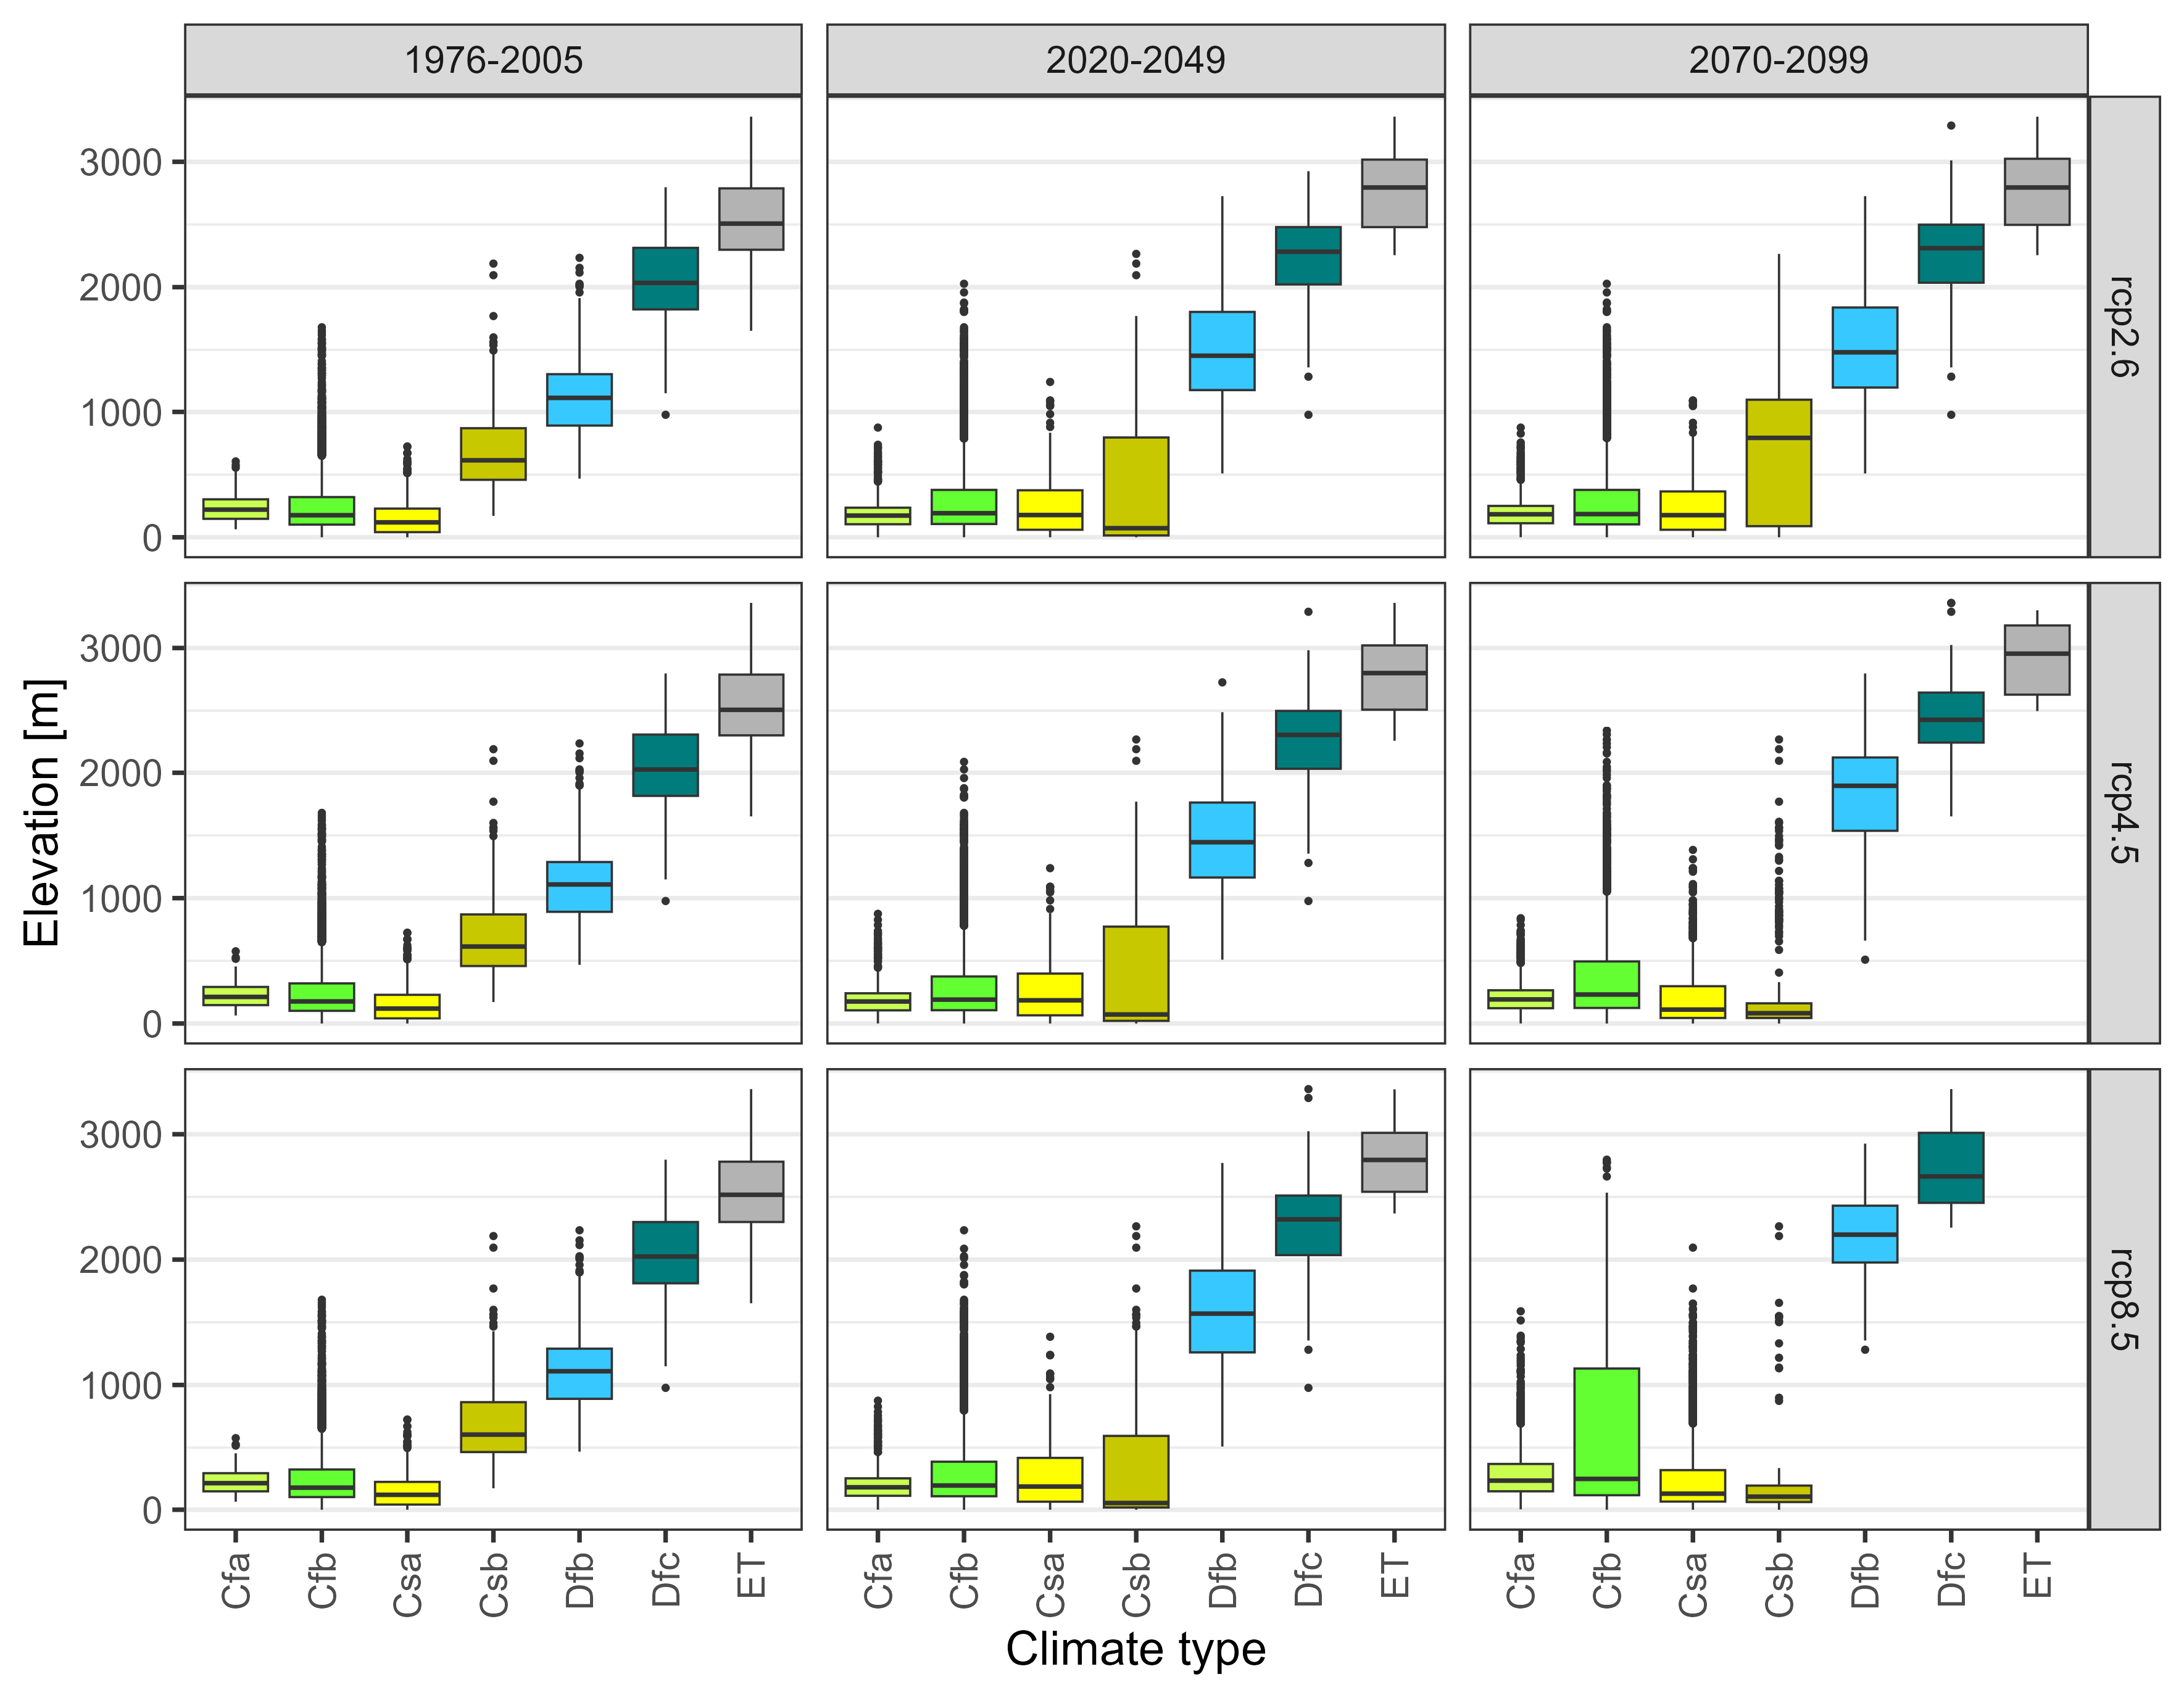
4. Discussion
4.1. Climate changes both horizontally and vertically
Climate types in France for the historical 1976–2005 period were mostly a temperate climate (Cfb, Csa, Csb, and Cfa) located in the low-elevations areas, followed by a cold climate (Dfb and Dfc) located in the mid-mountainous region, and a polar climate (ET) located in the high-elevation areas.
These results are well correlated with those of other studies on the mean climate types in France during past periods. Indeed, Dubreuil [2022] and Eveno et al. [2016] also applied the Köppen–Geiger classification and found that Cfb was the main climate type observed in France, and that the Csa climate type was restricted to the Mediterranean region. Joly et al. [2010] computed climate types using factor analysis and found similar patterns with a large influence of oceanic climate from the west to the east of France, and Mediterranean climate in south-east, which they explained by the barrier effect of the mountains limiting the spread of these climate types.
Climate types computed with the climate projections are consistent with those computed with observed data across France in the historical 1976–2005 period. This shows the ability of climate models to simulate future air temperature and precipitation, and thus future climate types based on climate projections. Nevertheless, this good agreement in the historical period was expected since the bias correction methods were calibrated on the same temperature and precipitation data and on similar periods. Even though the climate types computed with the model outputs showed good agreement rates for the historical period, the agreement rates slightly decrease in the future, meaning that different futures are possible. However, the long-term dynamics (i.e., increasing or decreasing trends in the proportion of area covered by a climate type) remain consistent within climate projections. Thus, climate models agree on the change in climate type, but can diverge in terms of temporality.
In the near future, changes in climate types are similar for the three RCPs, but major changes are expected in the far future for the high-emission scenario. This emission scenario would lead to faster climate type changes and over a larger area in the future. Climate type transitions are expected spatially both horizontally and vertically (i.e., in mountainous regions). A major transition is expected from the temperate climate without a dry season and warm summer to the temperate climate without a dry season and hot summer. These results are in line with the “Mediterraneanisation” of the climate in France mentioned by Dubreuil [2022], who also observed a lower interannual variability of annual climate types under RCP 8.5 by the end of the century. Indeed, Eveno et al. [2016] and Dubreuil [2022] showed that computing the classification on annual scales (vs. a multi-year mean as done in the present study) could result in different climate types attribution, highlighting the potential interannual variability of climate.
In addition, the complexity of very local climates may not be well reflected by global-scale methods such as the Köppen–Geiger classification [Joly et al. 2010]. Therefore, some modifications of its criteria may be recommended [Eveno et al. 2016; Planchon and Rosier 2005]. For example, a modification of the criterion used to define the dry season in temperature region (Cs) was suggested by Bagnouls and Gaussen [1957]. We applied this modification (i.e., the climate is considered as belonging to Cs when the monthly precipitation is lower than 2 times monthly temperature in June, July, or August) to our dataset. We found that in 2070–2099 under RCP 8.5, the climate type Csa covered a larger part of France, while climate types during the historical period were very similar, except for north western France where the modified classification leads to a drier climate (Csb), which seems less plausible (Supplementary Figure S4).
The transition to drier and warmer climate type is expected to rapidly spread northward, at an unprecedented speed of approximately 7 km⋅yr−1 horizontally and 5 m⋅yr−1 vertically, although these speeds were not uniformly observed across the country. Similar northward migrations of agro-climatic zones were observed across Europe over the past few decades [Ceglar et al. 2019].
As mentioned by Dubreuil [2022], the Köppen–Geiger climates type are computed on temperature and precipitation data only, thus ignoring how other climate variables may change (e.g. wind speed, cloud cover, air humidity, etc.). Therefore, similar climate types for different locations at different time periods (also known as climate analogues) may not cover exactly the same climate conditions (i.e. Csa climate type in the north may be slightly different from Csa in the south of France).
4.2. Impact of new climate conditions
The velocities of horizontal and vertical changes raise serious questions about the ability of our societies and ecosystems to adapt to new climate conditions in such short time scales under a high-emission scenario. Vegetation in natural forests has two strategies to adapt to changing climatic conditions: resilience or migration [Corlett and Westcott 2013; Lancaster and Humphreys 2020; Thompson et al. 2009]. The vertical migration of mountain tree lines has been observed at a mean velocity of 1.2 m⋅yr−1 (ranging from −10.2 to 16.9 m⋅yr−1 in boreal, temperate, and tropical regions) in relation to climate changes [He et al. 2023].
The horizontal migration velocities of natural forest range between 200 and 1500 m⋅yr−1 [Corlett and Westcott 2013; Iverson et al. 2004], which is much slower than the 7 km⋅yr−1 that we obtained. These rapid changes will very likely cause massive forest dieback for many species, or favor invasive species. In addition, this climate change may also limit the potential of vegetation to accumulate carbon [Higgins et al. 2023]. Rapid changes in vegetation cover could affect the water cycle through evaporative and energy fluxes that depend on land use and vegetation type [Vajda and Venäläinen 2005]. It may for example lead to stronger extreme floods in the Alps [Wilhelm et al. 2022]. The cascading impacts on water resources and on water-dependent energy sources have also been focused on strongly at both the global and national scales [Ahmad 2021; Chauveau et al. 2013; Lemaitre-Basset et al. 2021; Linnerud et al. 2011; RTE 2021], which reflects the increasing concerns regarding adaptation needs across a wide range of socioeconomic sectors.
Our results suggest that changes in climate types can be more limited under the low-emission scenario, both in terms of spatial and temporal dynamics. With this emission scenario, changes in climate types would be constrained to smaller areas located mainly in mountainous regions and in southwest France, and the velocities of change should be more consistent with a natural and achievable adaptation speed of ecosystems and society. However, this low-emission scenario is far from warranted, and the worst-case scenarios need to be considered with attention. Finally, we would like to stress that many European countries share the diverse climatic and topographical conditions found in France, and that similar changes are therefore expected throughout Europe.
5. Conclusion
Climate maps are often taught in high schools to introduce the notion of climate and therefore represent good candidates to raise public awareness on the impacts of climate change. We applied the Köppen–Geiger classification across France on a high-resolution grid with bias-corrected climate projections to assess past and future changes in climate conditions.
Our results show good agreement between climate types computed with climate projections and reanalysis climate data for the 1976–2005 period. Changes in climate types are expected in the near future for approximately 20% of France, regardless of the emission scenario. However, major changes are expected after 2040 under RCP 8.5 for 86% of France, towards warmer and drier summers, leading to a massive expansion of the temperate, hot summer with and without dry season (Csa and Cfa, respectively), as well as the expansion of temperate climate in mountainous regions. These changes could reach an average transition speed of up to 7 km⋅yr−1 northwards, with unprecedented consequences on agriculture, biodiversity, and water and energy management, not to mention on societies.
This work aims at contributing to the general audience’s understanding of the consequences of climate change we are experiencing as a global society. We believe that it may help inform decision-makers in designing mitigation and adaptation plans in France, as well as inspire similar studies worldwide. It advocates for rapid and significant mitigation measures and illustrates the kind of future environments we would need to adapt to in our lifetime.
Declaration of interests
The authors do not work for, advise, own shares in, or receive funds from any organization that could benefit from this article, and have declared no affiliations other than their research organizations.
Funding
This study was carried out within the Explore2 project funded by the French Ministry for Ecology (contract no. 2103295967). The postdoctoral position of the first author was funded by the same project.
Acknowledgements
The SAFRAN climate reanalysis was provided by Météo-France and the climate projections were retrieved from the DRIAS website and made available by Météo-France and the Institut Pierre-Simon Laplace (IPSL). The authors thank the Euro-CORDEX initiative for making available the raw regionalized climate projections, as well as Olivier Planchon for his precious help during the revision of the manuscript.