


 CC-BY 4.0
1. Introduction
Young or active basaltic oceanic volcanoes form high islands mainly consisting of stacks of lava flows with high hydraulic conductivities that promote deep infiltration of surface waters, first into shallow aquifers and later deep into the basaltic bedrock basal aquifer. Consequently, and despite very high rainfall rates, surface water resources are scarce. Moreover, prospecting inland groundwaters is a challenge due to the extreme depth (hundreds of metres) of the water table. The analysis of deep volcanic aquifers is therefore an important recent field of research. Numerous studies which have been conducted on other islands and volcanic archipelagos emphasise the difficulty in defining a general representation of the circulation and water–rock interaction conditions of deep groundwater in such terrains (Cruz and Silva, 2001; Custodio, 1989; Ecker, 1976; Izquierdo, 2014; Izuka et al., 2010; Lau and Mink, 2006; Mac Donald et al., 1983; Peterson and Moore, 1987).
These various analyses highlight how difficult it is to define a general representation of the deep groundwater circulation conditions in such media.
In Reunion Island, Join, Coudray, et al. (1997), Join, Folio and Robineau (2005), Join, Folio, Bourhane, et al. (2016) have defined a general framework to explain the continuity of the water table close to the sea level in the coastal area towards the higher altitude water table inland. This involves lower permeability at the core of the island. Bret et al. (2003) described the presence of secondary mineralisation (clays and zeolites) that should contribute to reducing initial volcanic hydraulic conductivity and contributed to this conceptual model, which remained to be improved by direct investigations. Pursuing that approach, we benefited from the Salazie Amont tunnel project, a water diversion gallery drilled inside the Piton des Neiges volcano at an average depth of 1000 m. Bored in the early 2000s, this tunnel provided a unique opportunity to observe the groundwater flow path and to analyse the water composition in the deepest part of the volcano: the springs occurring at various levels in the massif’s cliff walls were surveyed and sampled. The chemical contents of this spring water are used as testimony to the chemical processes which are active during gradual infiltration.
Using flow and chemical data from the tunnel’s seepage waters, the purpose of this paper is to characterise the groundwater flow paths and to document the weathering processes resulting in the genesis of clays as secondary minerals of alteration processes within the volcanic terrains down to the tunnel level, in coherence with the significant evolution of the water’s chemical composition. Hypotheses for groundwater patterns in volcanic terrains are improved by chemical modelling. The results are interpreted with regard to the structural and geological knowledge of the flank of this volcano.
2. Study area
2.1. Site description
Located in the south-western Indian Ocean (21°S/55°E), east of Madagascar, Reunion Island has the climate of a high humid tropical island, mainly defined by a hot rainfall season from December to April and a fairly temperate dry season from May to December. Some of the rainfall values recorded are among the highest in the world (up to 14,000 mm⋅yr−1 and 270 mm⋅h−1). From a geomorphological perspective, Reunion fits typically in to the category of high volcanic islands. It is formed of two shield volcanoes (Figure 1). Covering the northwestern two thirds of the island, Piton des Neiges (3069 m) has been extinct for 20,000 years (Gillot and Nativel, 1982), while the still-active volcano of Piton de la Fournaise has erupted approximately once a year since 1998. Both present high relief marked by deep erosional cirques with steep cliff walls known as remparts.
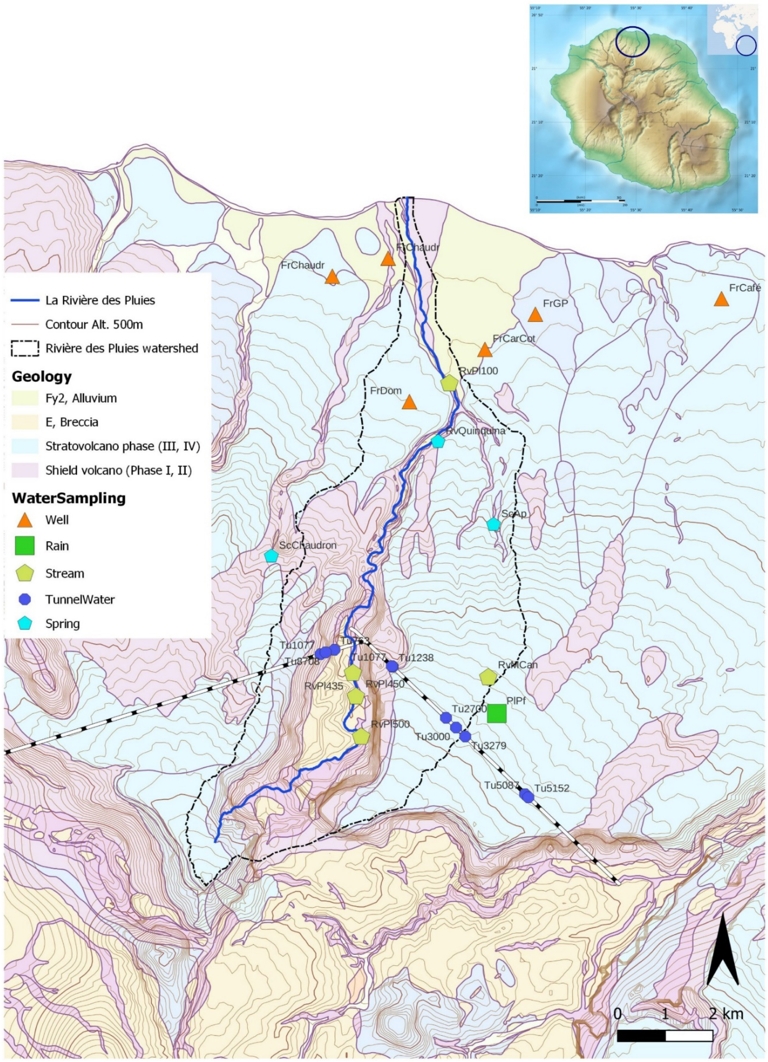
Location map and sampling. Sampling points are identified by a code and a symbol according to their type and location. Plxx = precipitations, Frxxx = boreholes, Scxx = springs, Rvxx = stream or river, Tuxx = tunnel.
Located in the northern part of Piton des Neiges, the study area consists of the Rivière des Pluies watershed, which comprises two preserved flanks of Piton des Neiges surrounding the proto-cirque named Grand Éboulis, drained by an entrenched torrential river. This exceptional landscape, marked by a one thousand meter-high cliff rempart, provides a unique opportunity to observe the interior of a volcano from the summit of the cliff corresponding to the preserved structural surface, known as a planèze, down to the oldest terrains of Piton des Neiges, around 1000 m below. At the cliff bottom, a water tunnel has been drilled, revealing significant water inflows with physico-chemical and isotopic characteristics at depths rarely investigated in such volcanic environments.
2.2. Geology and mineralogy
The lithology of the Rivière des Pluies watershed is linked to the volcanic formations of Piton des Neiges (Upton and Wadsworth, 1972; Billard and Vincent, 1974; Kluska, 1997; Salvany et al., 2012). The authors agree in defining two very different major periods of activity, reflected in both the petrology and geomorphology of the massif. Its typical shield volcano period (phases 1 and 2 according to Billard and Vincent, 1974), from 2.1 to 0.43 Ma, consisted mainly of olivine basalts and oceanic lava flows. After a period of volcanic quiescence from 0.430 to 0.30 Ma, dominated by alteration and erosion of the massif, volcanic activity shifted to a stratovolcano-building stage (phases 3 and 4 in Billard and Vincent, 1974), with the emission of differentiated feldspar-rich lavas (0.34 to 0.029 Ma). Olivine phenocrysts predominate in the shield volcano period, while plagioclases becomes the dominant stage in the stratovolcano series (Valer, 2016). Plagioclases are clearly more calcic in the differentiated lava series, reaching An88 composition (Smietana, 2011) in particularly plagioclase-rich lavas.
Secondary mineral phases have been identified both in the shield volcano series and soils in the differentiated stratovolcano series. They confirm efficient weathering processes from surface to depth. Smectites and occasionally vermiculites were observed. Microscopically, these clays appear as a fine band (<10 μm) lining the vacuoles in the basaltic lava. The oldest oceanites sampled in the hydraulic gallery contain numerous zeolites, which are massive, fibrous or lamellar and tend to fill the voids in the vacuoles. These include phillipsite, chabazite, thomsonite and mesolite (Bret, 2002; Bret et al., 2003).
2.3. Hydrogeological setting
2.3.1. Water balance
At the top of the planèze above the tunnel, an experimental watershed of the Ravine Mère Canal is part of the Rivière des Pluies watershed covering an area of 0.65 km2 upstream from the hydrometric station. The site was instrumented with two meteorological stations, enabling water-balance components to be calculated. Average annual rainfall is 4207 mm, of which 20% is evapotranspiration, 38% runoff, for a deduced infiltration of 42%, i.e., 1768 mm or 56l/s per km2 (Bonnier, 2010).
2.3.2. Groundwater conceptual model
The stacking of lava flows and associated scoriaceous products presents high hydraulic conductivities favoring rapid and deep infiltration, as described for active shield volcanoes. However, these hydrodynamic characteristics display spatial variability (e.g., variations in lava flow thickness, or presence of dikes or pyroclastic ash products), and there is still little information available for estimating hydrodynamic properties on the scale of a massif.
In the high elevation part of the Piton des Neiges volcano, groundwater flow is evidenced by springs that mark aquifer outlets and appear in deeply incised valleys. A hydrogeological conceptual model has been proposed (Join, Folio, Bourhane, et al., 2016; Join, Folio and Robineau, 2005), describing three types of aquifers. (1) Superficial groundwaters within the perhydrated andosols occur in the cloud forest area at high elevation (above 1300 m Ngr). (2) Perched groundwaters refer to the intercepted part of deep infiltration due to local impervious horizons such as palaeosols and paleovalleys. Springs of that type occur mainly in the cliff walls of erosion canyons. (3) Finally, a deep saturated zone extends above the oldest volcanic units, and defines the phreatic zone at the origin of the permanent flow of the entrenched valley of Rivière des Pluies located approximately 1000 m below the cloud forest area. On the basis of this diagram, we can assume that the groundwater flows sampled in the bored tunnel at the bottom of the valley allow us to characterise the basal aquifer.
The conceptual model can be reduced to two layers: a vadose zone, comprising superficial and perched groundwater, and a phreatic zone corresponding to the base water table. The vadose zone in Reunion Island is of the exceptional thickness of several hundred metres, which is due to the extreme permeability of the most recent volcanic formations. Vertical infiltration predominates, with temporary surface or perched water tables. The phreatic zone, on the other hand, represents a saturated zone associated with the base water intercepted by the tunnel and tapped by drilling in coastal areas.
During the tunnel drilling operations, fluid pressure measurements of more than 30 bars were recorded at the bottom of the phreatic zone in a borehole drilled horizontally as the tunnel progressed. These measurements enabled us to locate the top of the water table at an altitude of around +900 m Ngr. As the average ground level above is around +1500 m Ngr, we can deduce a thickness of 600 m for the vadose zone.
Several water samples in the catchment area and the tunnel were dated using the tritium isotope method. The results enabled us to refine this conceptual model. They provide residence time for water taken from the vadose zone (surface and perched water tables) and the phreatic zone (tunnel and borehole). Sanquer et al. (2010) suggest ages ranging from 75 years at the top of the phreatic zone to 150 years for the oldest water samples dated in the tunnel.
3. Materials and methods
3.1. Water sampling and analysis
An initial campaign of sampling and chemical analysis was carried out during the excavation of the water transfer tunnel (2006–2014). Waters from the tunnel, springs and boreholes corresponding to the vadose and phreatic zones were sampled simultaneously. This initial dataset was complemented by chemical analyses carried out as part of the hydrological monitoring of the Rivière des Pluies watershed within France’s research infrastructure of OZCAR (Critical Zone Observatories: Research and Application) and its observatory ERORUN (Observatory of Erosion in Reunion) dedicated to observing the water cycle and critical zone (Toulier et al., 2024).
From the complete dataset, 419 analyses were selected on the basis of a quality criterion defined by a percent charge-balance error (%CBE) of less than 5% (Supplementary Table 1).
The samples analysed were grouped into five categories according to the type of sampling carried out, distinguishing between borehole waters (Frxxx) taken from the water table downstream from the catchment area, rainwaters (PlPF1340) taken from a rain gauge located at 1340 m altitude in the cloud forest area, surface water taken from the Rivière des Pluies or its tributaries on the massif (Rvxxxx), tunnel waters (Tuxxx) taken from various depths in the water transfer tunnel, and finally spring waters (Scxxx) taken from various points on the massif and corresponding to superficial or perched aquifers.
3.2. Hydrochemical modelling
3.2.1. The modelling strategy
Reunion Island provides a most interesting field for studying water–rock interaction processes, with extremely high rainfall on basaltic rocks known for being very reactive to alteration in the weathering process. We thought that the modelling approach might be useful in order to better understand how the composition of the infiltrated rainwater undergoes major change, to reach the composition of well waters. We know from the analytical data on samples (cf. Supplementary Table 1) that the resulting solutions are still diluted in subsurface aquifers first, but become more concentrated in deep aquifers as shown by samples collected in the tunnel, with pH values as high as 9 to 10.
To approach the problem we first applied a modelling strategy with two major steps according to the hydrogeological conceptual model defined in Figure 2: (1) a vadose episode with the first reaction of rainwater with basaltic rocks at near-surface CO2 conditions, (2) a subsequent phreatic episode with proceeding alteration under variable pCO2, no longer controlled by the atmosphere, with a possible sharp increase in the pH values due to the loss of the pH buffering effect of CO2. In our modelling approach the results of the first simulation led us to define a more complex modelling process, as described later, with a third episode at depth with the probable influence of some deep CO2.
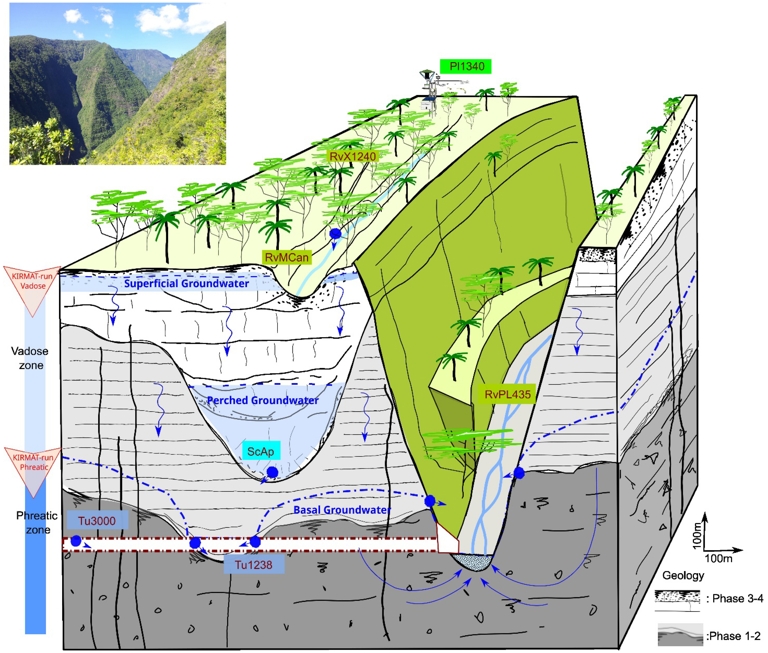
Hydrogeological settings. Hydrogeological conceptual model of inland aquifers and water pathways from rainwater to the tunnel waters. Representation of the vadose zone (=superficial and perched groundwater) and phreatic zone (=basal groundwater).
3.2.2. Modelling the reactive transport
We used the geochemical code KIRMAT (KInetics of Reaction and Mass Transfer) first described by Gérard, Clément, et al. (1998), Gérard, Fritz, et al. (1998), when it was created for simulating water–rock interaction processes in an open 1-D system with the circulation of fluid, in order to predict the cumulative effect of alteration with time in open cells. The simulated primary minerals may dissolve and secondary precipitated minerals are predicted. Among the latter, the clay minerals are considered as solid solutions with variable compositions (Tardy and Fritz, 1981).
The KIRMAT modelling is a one-dimensional model particularly adapted to the simulation of the consequence of alteration in a fractured pathway. Each calculation is made at a given temperature in the range from 0 °C to 300 °C. Input data describe the initial composition of the reactive cells, including rock and aqueous solution. The aqueous solution is considered to saturate porosity. Its chemical composition is described in terms of major and minor chemical elements with indication of Eh and pH values. The pCO2 partial pressure may be used as a fixed parameter. The rock characteristics include total porosity, permeability (cf. Section 3.2.3), reactive surface area, and mineral composition with kinetic dissolution rate constants of minerals (cf. Section 3.2.4).
Primary minerals are dissolved as a function of dissolution rates calculated along the process following Equation (1):
| (1) |
Dissolution kinetic rates kd (moles/kg/yr) from (Madé, 1991)
| Kda | Kdn | Kdb | |
|---|---|---|---|
| T = 19 °C | |||
| Forsterite | 1.907 × 10−0 | 1.875 × 10⁻³ | 7.447 × 10⁻⁶ |
| Fayalite | 2.374 × 10⁻¹ | 2.377 × 10⁻⁴ | 9.376 × 10⁻⁷ |
| Anorthite | 2.112 × 10⁻² | 6.762 × 10⁻⁴ | 2.711 × 10⁻⁶ |
| Albite | 2.124 × 10⁻² | 7.244 × 10⁻⁴ | 2.844 × 10⁻⁶ |
| Mugearite glass | 1.355 × 10⁻³ | 1.352 × 10⁻⁵ | 5.408 × 10⁻⁸ |
| T = 21 °C | |||
| Forsterite | 2.109 × 10−0 | 2.042 × 10⁻³ | 8.128 × 10⁻⁶ |
| Fayalite | 2.656 × 10⁻¹ | 2.600 × 10⁻⁴ | 1.023 × 10⁻⁶ |
| Anorthite | 2.394 × 10⁻² | 7.800 × 10⁻⁴ | 3.00 × 10⁻⁶ |
| Albite | 2.438 × 10⁻² | 8.128 × 10⁻⁴ | 3.162 × 10⁻⁶ |
| Aphyric glass | 1.596 × 10⁻³ | 1.622 × 10⁻⁵ | 6.456 × 10⁻⁸ |
| pH limits for Kds | pH < 6 | 6 < pH < 7 | pH > 7 |
For validation of this kinetic approach, the KIRMAT code has been progressively improved and applied to different types of alteration systems: weathering processes (Ackerer et al., 2018; Schaffhauser et al., 2014), geothermal studies (Lucas, Chabaux, et al., 2017; Lucas, Ngo, et al., 2020), nuclear waste storage (Marty et al., 2010; Ngo et al., 2014) and recently the simulation of possible hydrogen generation in geothermal systems (Murray et al., 2020).
The Code KIRMAT does not use the reactive surface area values as generally derived from BET measurements which lead to very high values of surface areas (about tens of m2/g of rock). These values correspond to all forms of porosity including microporosity almost, not connected to circulated fluids. In KIRMAT we refer to the rock surface in contact with a given amount of circulating fluid in macroporosity and we estimate the total surface (St) area of minerals in contact with the fluid in small fractures or cracks using a geometrical model of fissures. The surface area corresponding to each rock-forming mineral (Seff), used in the kinetic rate law for dissolution, is then calculated using the volumic fraction (Fv) of this mineral in the basaltic rock (Seff = St ⋅ Fv). In this study we used two different values for the VGW modelling runs (St = 10 m2/kg H2O) and PGW runs (St = 100 m2/kg H2O) respectively.
The formation of secondary minerals produced in the process is simulated at thermodynamic equilibrium.
The dissolution equations for both primary and secondary minerals are presented in Table 2 in the Supplementary Data with the solubility products.
The vertical evolution of the water chemistry in the volcanic massif has been modelled using a succession of boxes intersecting two successive different lithological zones (Figure 3):
- First box representing the 600 m-thick vadose zone made up of differentiated mugearite volcanic flows (30 simulated cells of 20 m in length).
- Second box representing the 300 m-thick phreatic zone located in basaltic volcanic flows corresponding to the ancient phase of the oceanite series (15 simulated cells of 20 m in length).
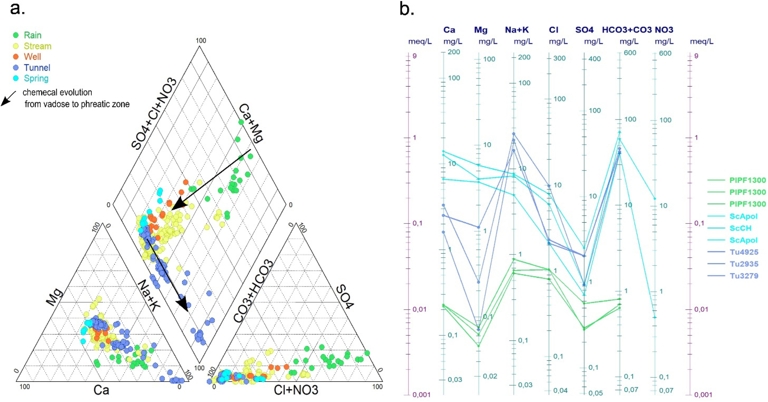
Chemical evolution of major ion components. (a) Piper diagram for all sampled water; (b) Schoeller diagram for representative waters of rainwaters (PLPFxx), spring waters (SCxx) and tunnel waters (Tuxx).
The circulation of the fluid flow between the successive cells is defined by a given effective velocity (Darcy’s velocity/porosity).
A feedback effect of the calculated dissolution/precipitation processes on porosity and permeability in the reactive cells is included (Lucas, Chabaux, et al., 2017). Concerning the control of CO2 along the simulated process, KIRMAT offers two options as indicated in Table 7: using a selected fixed value for a given calculation run (see runs PGW2 a and b, and VGW) or a given initial value allowed to evolve as a response to the chemical evolution of the system (see runs PGW1 a and b).
For the purposes of this study, KIRMAT has been adapted to store not only the calculations but also all the chemical data necessary to apply the code DIAGRAMMES (Simler, 2021) in order to produce the Piper and Schoeller diagrams for the solutions.
The kinetics of dissolution of primary minerals in the reactive cells is controlled by kinetic reaction rates given in Table 1 (Madé, 1991) and in Complementary Material (Annexe Table 2).
The parameters governing fluid flow and solute transport differ between the vadose and phreatic zones, and have therefore been modelled sequentially along two distinct pathways to reflect the contrasting petrological characteristics. The vadose zone, primarily composed of mugearite and plagioclase-rich lavas, differs from the phreatic zone, which lies within the basaltic shield volcano phase. Additionally, pCO2 is assumed to remain close to atmospheric levels in the vadose zone, whereas it may decrease in the phreatic zone.
3.2.3. Estimated hydrodynamical parameters
In order to simulate the mineralisation processes from infiltration of rainwater (Figure 2: point PL1340) through 600 m towards a 300-m thick phreatic zone (Figure 2: point Tu3000), we use hydrodynamic properties that could represent the global structure of the volcano defined by two main volcanic units (a shield volcano substratum overlaid by the recent stratovolcano). These two units have been assimilated to hydrogeological layers (Figure 2). Their permeability and porosity parameters are defined on the basis of previous hydrogeological modelling work carried out in Reunion Island. Values of hydraulic conductivity and drainage porosity range respectively from 1 × 10⁻⁹ to 1.5 × 10⁻⁴ m/s and 0.1% to 15% (Belle et al., 2018; Folio, 2001; Maréchal et al., 2014).
Using KIRMAT, effective velocity is of major importance. For that purpose, we used carbon-14 and tritium dating of the groundwaters sampled from the streams, springs and tunnel waters within the Rivière des Pluies watershed (Sanquer et al., 2010).
The vadose zone
The time taken for the water to go through the vadose zone is assessed at 77 years using isotopic time dating (ibid.) of the top of the basal groundwater (from 75 to 82 years), i.e., an effective velocity of 600/77 = 7.79 m/yr or a Darcy velocity of 0.779 m/yr for a porosity of 10%.
The phreatic zone
Dating of the tunnel waters has provided ages ranging from 77 years to a maximum of 147 years. The youngest waters correspond to significant water inflows in draining sectors marked by fractures and numerous dikes, and we can assume that the water sampled in these sectors characterises the top of the water table. In contrast, the oldest water is found in the least drained areas and corresponds, conversely, to sampling close to the wall of the water table, whose maximum thickness has been estimated at around 300 m. These observations enable us to estimate the vertical transfer time between the roof and the water table wall as 147 − 77 = 70 years. From this we can deduce the effective velocity for the vertical component of the flow in the phreatic zone, i.e., a Darcy velocity of 0.429 m/yr considering a porosity of 10% in the phreatic zone (300 m and 70 y). These values are consistent with the hydraulic conductivity estimates used to simulate the tunnel’s drainage capacity (Maréchal et al., 2014).
3.2.4. Geochemical conditions and parameters
Initial composition of rocks
To characterise the average mineralogy of the volcanic terrains in these two environments, we used the mineralogical compositions collected and analysed by Hoareau et al. (2005) as part of his experimental work on leaching volcanic rocks from Reunion Island. We choose two aphyric-textured samples whose composition was deemed representative of the two modelized volcanic series (Table 2).
Mineralogical composition of the basalts and volcanic glasses used in the simulations (in moles)
| Simulation | Vadose | Phreatic |
|---|---|---|
| Lava | Mugearite | Aphyric basalt |
| An/Ab | 1.5 | 1.5 |
| Forsterite | 0.0643 | 0.1444 |
| Fayalite | 0.1112 | 0.1283 |
| Albite | 0.1469 | 0.1136 |
| Anorthite | 0.2204 | 0.1703 |
| Glass | 0.4572 | 0.4434 |
| Total | 1 | 1 |
| Composition of the glass (atoms per 2O) | ||
| Si | 0.8892 | 0.805 |
| K | 0.1542 | 0.0558 |
| Na | 0.2398 | 0.0487 |
| Ca | 0.0247 | 0.3778 |
∗The composition of the glass has been calculated from the total composition of the basalt (in % oxides) and the An/Ab ratio = 1.5. The solubility product K of the glasses has been calculated from the solubility products of oxides using an ideal solid solution mode.
Initial composition of waters (Table 3)
The water entering the vadose zone has the composition of typical rainwater collected on the volcano (sample reference PlPF1300 of 17 July 2019).
Major ion chemistry (mg/L) of entering water in the modelling process for the vadose (No 3) and phreatic pathways (No 459) (a) cations, (b) anions
| (a) | ||||||||||
| n | Reference | Name | Date | T (°C) | pH | c25 °C | Ca | Mg | Na | K |
| 3 | PlPF1300 | PlPF1300 | 17 July 2019 | 23.9 | 6.3 | 15.8 | 0.38 | 0.21 | 1.53 | 0.15 |
| 459 | 38714 | Phreatic pathway | 21 | 8.2 | 183 | 16.40 | 5.65 | 11.90 | 0.25 | |
| (b) | ||||||||||
| n | Reference | Name | Date | HCO3 | CO3 | Cl | SO4 | NO3 | SiO2 | |
| 3 | PlPF1300 | PlPF1300 | 17 July 2019 | 1.23 | 0 | 2,54 | 0.65 | 0 | <DL | |
| 459 | 38714 | Phreatic pathway | 97.7 | 2.70 | 4.62 | 7.07 | 0 | 24 | ||
The water entering the phreatic zone has the composition of the simulated water leaving the overlying vadose zone.
When the initial composition of the water in rock (infiltrated rainwater) was defined, the results of preliminary modelling indicated that its precise composition does not exert a significant impact on the final concentration profile during simulation times that are longer than the water residence time in the column (77 years in the vadose zone and 70 years in the phreatic zone).
Temperature
The mean temperature of spring water sampled in the vadose zone was 19.14 °C, with a standard deviation of 1.43. Typical phreatic water samples from the tunnel had a mean temperature of 21.26 °C, with a standard deviation of 2.37. Accordingly, we chose a temperature of 19 °C to simulate the vadose zone, and 21 °C for the phreatic zone.
4. Results and discussion
4.1. Concentrations of major elements
4.1.1. Chemical characteristics of the aqueous solutions sampled in the field
The evolution of the chemical composition of rainwater from Plaine des Fougères to the transfer tunnel clearly shows two distinctly different pathways in the vadose zone and the phreatic zone. The first pathway, named Vadose Geochemical Way (VGW), concerns the chemical evolution of rainwater as it moves towards the perched groundwater and the top of the water table (springs and boreholes). The second, named Phreatic Geochemical Way (PGW), concerns the marked evolution of samples taken at different depths in the tunnel towards water at the base of the water table. All the water samples taken are represented in a Piper diagram (Figure 3a).
The VGW pathway corresponds to an increase in concentration of the four major cations (Ca, Mg, Na, K) together with alkalinity (
We have selected nine representative samples from each type of water (rainwater, borehole water, tunnel spring water) in order to detail the global mineralisation with a Schoeller diagram (Figure 3b).
This diagram clearly discriminates the rainwater group (PlPF1300) from spring waters (ScApol and ScCH) and groundwaters sampled at different depths in the tunnel (TU4925, Tu2935, Tu3279). It highlights the general increase in mineralisation between rainwater and groundwater. It also shows the significant chemical evolution between the vadose zone and the phreatic zone, marked mainly by an increase in Na at the expense of Ca and Mg.
It should be noted that this geochemical trend goes together with a continuous increase in pH, reaching 8 to 9 for VGW and 9 to 10 for PGW. This general evolution in pH is typical of alteration processes at low temperature (around 20 °C) when the gas CO2 is available for providing protons:
| (2) |
| (3) |
| (4) |
Equation (4) shows clearly that increased alkalinity goes together with increased pH at a given pCO2 and also that the pH will increase even further if the pCO2 diminishes as expected with depth in the phreatic zone.
4.1.2. Observed secondary mineralogy sampled in the tunnel
Rock samples collected during drilling operations were analysed, with four samples examined using a Bruker X-ray diffractometer to characterise the secondary mineralogy. In the deepest section of the tunnel, between PM 3065 and 3209, clay minerals were predominant, specifically identified as smectite-type montmorillonite across all four samples. These findings align with observations in other tunnel sections, indicating that the abundance of zeolites seen in outcrops of older volcanic formations diminishes towards the volcano’s core, where clay minerals are more prevalent (Bret et al., 2003).
4.2. Hydrochemical functioning
4.2.1. Simulation results
The quality test of the composition of water samples collected in the field was conducted using the numerical code KIRMAT. In this necessary first step in any modelling approach to water–rock interactions, the calculations determined the chemical speciation of all chemical elements in the aqueous solutions. As mentioned in Section 3.1, this makes it possible to begin by checking the electrical neutrality of the solution as an important quality index of the analytical data set. For the discussion and comparison with simulated values, we only selected representative samples shown in the Schoeller diagram.
Figure 4 presents the results of our simulation based on the proposed modelling approach. In the initial simulation stage, starting with rainwater (PlPF1300) interacting with mugearite rocks, we observed the evolution of the water composition along the vadose zone under constant pCO2 conditions. Following this, the final water composition from the vadose zone simulation served as the input for a second simulation step, which models basalt weathering under phreatic conditions with variable pCO2. The Piper diagram (Figure 4a) shows that the simulated water composition closely aligns with the measured data, a result further corroborated by the Chadha diagram (Chadha, 1999) (Figure 4b). The Schoeller diagram confirms that the KIRMAT model effectively predicts the formation of spring water in the vadose zone and tunnel water in the phreatic zone.
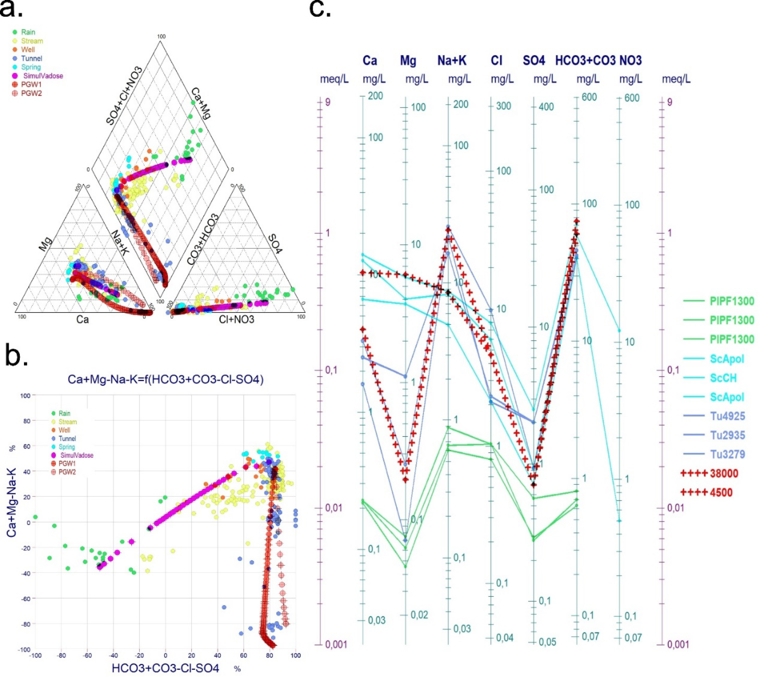
Chemical evolution of major ion components for simulated versus sampled waters described with a Piper diagram and a Chadha diagram (all samples) and a Schoeller diagram (selected samples and simulated waters). (a) Piper diagram for all sampled waters; (b) Schoeller diagram for selected waters. Red crosses correspond to increments of calculation of simulated vadose pathway (Increment 38,000) and phreatic pathway (Increment 4500); (c) Chadha diagram for all sampled waters.
In contrast, in the simulation of the phreatic zone with variable pCO2, the less evolved samples from the tunnel are not as well simulated. The rapid increase in pH is accompanied by a marked drop in Mg concentration, which becomes underestimated at the start of the simulation compared to the lowest mineralized waters collected in the tunnel. Sensitivity tests revealed that the system is strongly influenced by the partial pressure of CO2. Assuming complete consumption of dissolved CO2 in the phreatic zone would result in a total loss of Mg and very high pH values (≫10), not observed in the most basic tunnel waters.
The issue of CO2 control (or not) in the alteration process is a geochemical key point, as it will regulate/control the pH. In the upper part of the volcanic massif (VGW), the pCO2 may remain not far from the atmospheric value (10−3.5) and this will be considered in our simulation conditions. However, the alteration process will progressively cut this relation with near-surface conditions as solutions move and infiltrate the deeper part of the volcanic massif.
It is clear that deep-waters collected in the phreatic zone (PGW) show a high pH value (9 to 10). This is consistent with a é in pCO2 far from atmospheric conditions.
However, the possible saturation with respect to calcite may introduce the well-known pH buffer of calcite.
We used the modelling approach to further understand what happens at depth with CO2. To better represent the diversity of the waters sampled, we propose the hypothesis of a magmatic CO2 input (Bénard, Di Muro, et al., 2023), thus maintaining a minimal level of pCO2 in the fractures.
We suggest modelling a second circulation pathway in order to account for fractured zones subject to potential magmatic CO2 diffusion. Two models of water evolution in the phreatic zone result in the following:
Firstly, a PGW1 path, corresponding to the least draining zones of the aquifer (2.5% to 10% porosity), where pCO2 is consumed from its initial value in the vadose zone and drops to very low values, reaching as low as 10−7. With this option, a very low value of pCO2 (10−7) is reached after under 70 years (54 years) because we limited the decrease to that value. This evolution of the pCO2 goes together with a substantial increase in the pH, which reaches values of between 9 and 10, and even more if the simulation is forced to 70 years, which was ultimately unrealistic if we compared the final solutions of the simulations to the composition of samples collected in the tunnel.
For that reason, we tested an alternative PGW2 pathway, representing groundwater circulation in draining fractures (10% or 2.5% porosity) connected to a CO2 supply of deep origin, enabling the initial pCO2 of the vadose zone to be maintained. Such a CO2 supply helps to control the pCO2 in equilibrium with the circulation of solutions at depth at a level not very different from the near surface conditions (−4 < logpCO2 < −3) instead of decreasing pCO2 to very low values like that obtained in the modelling with variable CO2 option ( logpCO2 = −7) which goes together with a very high pH value up to 10 and more. This may happen in some zones of the massif not concerned by this deep CO2 effect but is not realistic for most of the circulation pathways concerned by our study as shown by the data for waters samples collected in the tunnel (Table 4). This is the reason why we tested both options for CO2 (fixed under deep CO2 influence or variable.
pH and pCO2 in the samples from the tunnel
| Sample no | 300 | 302 | 307 | 308 | 312 | 320 | 325 | 327 |
| Location | TU 8751 | TU 4932 | TU 9075 | TU 1238 | TU 2935 | TU 5087 | TU 3000 | TU 1238 |
| Date | 09 June 2017 | 10 October 2010 | 08 May 2021 | 04 October 2019 | 08 March 2019 | 10 April 2007 | 05 October 2021 | 05 October 2021 |
| t (°C) | 18.9 | 25.1 | 20.2 | 19.7 | 23,9 | 24.1 | 24.5 | 19.7 |
| Ionic balance | 3% | 1% | 3% | 2% | 2% | 0% | 2% | 4% |
| pH | 8.48 | 9.5 | 8 | 8.6 | 9.68 | 8.6 | 10.02 | 8.85 |
| log pCO2 | −3.763 | −4.965 | −3.135 | −3.912 | −5.145 | −3.983 | −5.525 | −4.186 |
The relation between pH and pCO2 in the samples from the tunnel is documented in Table 4 for eight samples covering the pH range 8 to 10. Their pCO2 equilibrium varies from 10−3.14 to 10−5.5, which supports our hypothesis of the presence of some deep source of CO2 in the system, as samples with pCO2 values as low as 10−7 were never found. With the two options PGW1 and PGW2, we simulated a kind of minimum and maximum effect of that possible CO2 diffusion at depth.
The results of the PGW1 and PGW2 simulations not only enable us to better describe the variable chemical composition of the various waters collected in the tunnel, but also suggest the hypothesis of continuous diffusion of deep magmatic CO2 associated with double porosity in fractures of volcano-tectonic origin. This potential contribution of deep magmatic CO2 is well documented in the two massifs of Reunion Island, based on observations of the soils and thermo-mineral waters of the two volcanic edifices (Liuzzo et al., 2015; Boudoire et al., 2023; Bénard, Famin, Sanjuan, et al., 2023; Bénard, Famin, Agrinier, et al., 2024).
4.2.2. Evolution of minerals in the simulated zones
Each primary mineral in the rock is dissolved acccording to its kinetic dissolution rate. Of the secondary minerals predicted by the simulation, the majority are due to a clay phase whose detailed composition in the different simulations is given in Table 5. These compositions were predicted in the last cell of the simulated domains for the maximum duration. Both phases are simulated as ideal solid solutions. The kinetics of dissolution of primary minerals in the reactive cells is controlled by kinetic reaction rates given in Table 1.
As shown in Table 5 for run PGW1 or PGW2, the simulations made with two different values of porosity did not show differences in terms of clay composition in the simulated cells after the selected duration: the chemical evolution of the solutions is directly related to the interaction duration and not to porosity. However, in the next section we will see that the consequence in terms of amounts of minerals produced can be observed in Table 6 total mass balance in the reservoir is related to the amount of solution reacting with the basalt, and therefore related to the porosity for a given flux of water. Decreasing the porosity from 10% to 2.5% decreases the volumic balance by a factor of 4.
Composition of clay produced in the simulation
| Simulation | Porosity (%) | Si | Al | Fe (III) | Mg | O | (OH) | Ca |
|---|---|---|---|---|---|---|---|---|
| VGW | 10 | 3.371 | 2.25 | 0.126 | 0.38 | 10 | 2 | 0.315 |
| PGW1a | 10 | 3.01 | 1.656 | 0.188 | 1.72 | 10 | 2 | 0.495 |
| PGW1b | 2.50 | 3.01 | 1.656 | 0.188 | 1.72 | 10 | 2 | 0.495 |
| PGW2a | 10 | 3.407 | 1.76 | 0.146 | 1.031 | 10 | 2 | 0.297 |
| PGW2b | 2.50 | 3.407 | 1.76 | 0.146 | 1.031 | 10 | 2 | 0.297 |
Minerals dissolved or precipitated (cm3/kg H2O)
| Alteration pathways | PGW1a | PGW1b | PGW2a | PGW2b | VGW |
|---|---|---|---|---|---|
| Temperature | 21 °C | 21 °C | 21 °C | 21 °C | 19 °C |
| U = DARCY global (KIRMAT) (m/y) | 0.4286 | 0.107 | 0.4286 | 0.107 | 0.78 |
| p = porosity − (0 < p < 1) | 0.1 | 0.025 | 0.1 | 0.025 | 0.1 |
| incr = final increment of calculation | 10,786 | 10,787 | 2918 | 2919 | 38,714 |
| t = duration (y) | 54.84 | 54.77 | 70 | 70 | 77 |
| Final pH | 10.91 | 10.91 | 8.57 | 8.57 | 8.27 |
| Final log pCO2 | −7 | −7 | −3.26 | −3.26 | −3.33 |
| Dissolution (cm3/kg H2O) | |||||
| Forsterite | 0.2403 | 0.240 | 0.3067 | 0.3067 | 0.01299 |
| Fayalite | 0.0285 | 0.0284 | 0.0363 | 0.0363 | 0.00298 |
| Anorthite | 0.5536 | 0.553 | 0.7016 | 0.7016 | 0.08493 |
| Aphiric glass | 0.0018 | 0.0018 | 0.0022 | 0.0022 | 0.000225 |
| High albite | 0.3719 | 0.371 | 0.4897 | 0.4897 | 0.05945 |
| Total dissolved | 1.1921 | 1.1942 | 1.5365 | 1.5365 | 0.1626 |
| Precipitation (cm3/kg H2O) | |||||
| Clay solid solution end-members: | |||||
| Pyrophyllite | 2.79 × 10⁻⁴ | 2.75 × 10⁻⁴ | 0.064 | 0.064 | 0.03326 |
| Talc | 8.23 × 10⁻³ | 8.21 × 10⁻³ | 0.3975 | 0.3975 | 0.1578 |
| Fe3 Pyrophyllite | 2.60 × 10⁻⁷ | 2.6 × 10⁻⁷ | 3.27 × 10⁻⁵ | 3.27 × 10⁻⁵ | 1.21 × 10⁻⁵ |
| Ca Muscovite | 2.79 × 10⁻¹ | 2.79 × 10⁻¹ | 0.6578 | 0.6578 | 0.07253 |
| Ca Phlogopite | 5.07 × 10⁻¹ | 5.06 × 10⁻¹ | 0.2516 | 0.2516 | 0.002 |
| Ca-Ferrimuscovite | 8.46 × 10⁻² | 8.45 × 10⁻² | 0.1079 | 0.1079 | 0.00885 |
| Total clay solid solution | 0.8791 | 0.8663 | 1.4799 | 1.4789 | 0.1323 |
| Calcite | 0.0271 | 0.0283 | 0.1324 | 0.1324 | 0.00017 |
| Phillipsite-K | 0.0024 | 0.0024 | 0.0016 | 0.0016 | 0 |
| Laumontite | 0.2676 | 0.2649 | 0 | 0 | 0 |
| Minerals other than clay | 0.2971 | 0.2956 | 0.1324 | 0.1324 | 0.00017 |
| Total precipitated | 1.1762 | 1.1654 | 1.6113 | 1.61131 | 0.1325 |
| Volumic balance of minerals | −0.0199 | −0.0288 | 0.0748 | 0.0748 | −0.0307 |
4.2.3. Extrapolating simulation results
In KIRMAT modelling, all the calculations are made as a reference to 1 kg H2O of solution. In order to predict the evolution of a given reservoir in the basaltic massif, one must consider the porosity of the rock to extrapolate the simulated mass balances to the scale of the reservoir under consideration. This is shown in Table 6 for PGW1 and PGW2 with porosity 10% (a) and 2.5% (b).
It is interesting to note that in all the simulations the volumic balance between dissolved minerals and precipitated minerals remains near equilibrium after 147 years, which corresponds to an evolution in porosity of less than 1%. The tendency is to increase the porosity in the vadose zone slightly and in the first phreatic pathway (PGW1a,b) and to reduce the porosity slightly in the final one. A significant evolution of the porosity would only be predicted for the long geological term.
However, these evolutions correspond to significant volumes of dissolved and produced minerals after only 147 years. A volume V of a given dissolved or precipitated mineral, calculated by KIRMAT in cm3/kg H2O, can be extrapolated at the site scale (approximately 1 km3 of basaltic terrains), taking into account the porosity n. Therefore, the volumic balance of minerals (V [cm3/kg H2O]) corresponds in 1 km3 to a total dissolved or precipitated amount of mineral: Vtot(m3) = 106 V⋅n.
It appears that the predicted amounts of minerals precipitated are about 10 times higher in the phreatic phase than in the vadose phase. In 1 km3 of basaltic terrains, clay minerals are the main secondary minerals and amount to 16,000 m3 in the vadose phase and 120,000 to 160,000 m3 in the phreatic pathway.
5. Conclusion
Since 2008, first as part of the monitoring of the excavation of the Salazie Amont tunnel and then as part of the ERORUN research infrastructure, sampling of rainwater, springs, river boreholes and tunnel water has been conducted from the rainwater infiltration zone at 1300 m altitude down to the deepest level of the phreatic zone reached by the tunnel (alt. 350 m). By selecting more than 400 water analyses, we were able to identify an initial evolution in water mineralisation in the vadose zone, which is perfectly distinct from that observed in the various samples taken in the phreatic zone.
To parameterize the KIRMAT water/rock interaction model, we made realistic assumptions about the geochemical composition of the rocks and the partial pressure of CO2 in the vadose and phreatic zones. In the phreatic zone, we tested the possibility of magmatic CO2 degassing, with results that enable us to better frame the variability of sampled waters when they were taken from fractures or dikes.
In this context, the KIRMAT simulation tool enabled us to reconstitute the dual evolution of rainwater flowing through 1000 m of volcanic formations. The simulated mineralogical balances enable us to characterise the precipitation of neo-formed clay minerals in the phreatic zone.
Ultimately, these results make it possible to clarify the flow of materials in underground volcanic flows and for the first time to characterise the dynamics of progressive impermeabilization within a shield volcano. These dynamics partly explain the decrease in permeability of volcanic formations on a spatial and temporal scale, which diminishes towards the inner zones of the massif and according to the age of the volcanism.
Declaration of interests
The authors do not work for, advise, own shares in, or receive funds from any organisation that could benefit from this article, and have declared no affiliations other than their research organisations.
Acknowledgments
The ERORUN observatory funded by OSU-Reunion is a part of the OZCAR research infrastructure (http://www.ozcar-ri.org), which is financially supported by the University of Reunion Island and the CNRS/INSU France. We thank Y. Benoit, M. David, G. Lebeau, S. Ferreira and P. Stamenoff for providing technical laboratory assistance. Geochemical data and dating conducted through the Salazie Amont tunnel project were funded by the Office de l’Eau Réunion.
The authors wish to acknowledge the contribution of both reviewers for their critical reading of the manuscript and their many useful remarks.
We are grateful to E. Nicolini for our helpful discussions and also the Office de l’Eau Réunion, the CVH-DEAL, Météo-France and the Département de La Réunion for participating in the ERORUN observatory work by providing part of the Supplementary Data included in this data paper.
C. Northam is thanked in particular for her careful proofreading and improvement of the English language.