


 CC-BY 4.0
1. Introduction
Painted caves have long been the focus of study for prehistorians, and they carry symbolic value for the populations. The conservation of these significant sites has also drawn particular attention in scholarship; with a focus on their location in the critical zone, as defined by geophysicists (Lee et al., 2023), mainly situated in the unsaturated zone. The thermal and hydric equilibrium of these caves is contingent on various factors, including the overlying massif, water circulation in fractures and altered zones, and the extent of vegetation covering the massif which plays a major role in this equilibrum. Long-term monitoring programmes provide valuable data that facilitate a comprehensive understanding of the critical zone. In particular, the rising temperatures observed since the 1980s are altering the hydric state, bringing changes to condensation and precipitation phenomena that may endanger parietal works (Malaurent, in Coye, 2023). In addition, alterations of microbiological or physico-chemical origin linked to thermo-hydric conditions can damage both the rock and the art on it.
A number of research programmes are currently being developed around certain sites that contain decorated caves. The Altamira cave in Spain, for example, has been the focus of particular attention for many years. Recently, Bayarri et al. (2024) developed photogrammetry methods inside and outside the cave, as well as RADAR measurements with 400 and 900 MHz antennas. Their work demonstrates the essential role of water circulation in the massif that results from a dense network of vertical fractures and a central fracture partially filled with cement. They demonstrate the decisive role played by this rapid circulation of water in the alteration of the rock art, as well as of the rock material through its dissolution; and they propose limited access to the cave during periods of high water accumulation. Valois et al. (2010) studied the surroundings of the prehistoric cave of Mayenne Sciences (Saults, France); using Electrical Resistivity Tomography (ERT) and seismic refraction tomography, they detected karstic dissolution zones as well as a filled cave below the prehistoric cave. The circulation of water surrounding caves has also been studied. Leopold et al. (2021), again using ERT, studied the infiltration of water in the massif surrounding the Golgotha cave (Australia) up to the cave itself. They identified permanent reservoirs and fast hydrological flow pathways. Their data were correlated with those recorded on the drips. Eucalyptus roots were observed at a depth of 40 m. The same type of monitoring was carried out on the Villars cave by Zhang et al. (2024). They demonstrated that there is a link between temporary reservoirs identified by ERT time-lapse and geochemical drip monitoring, confirming flow times ranging from rapid to several months. To demonstrate the impact of rainfall on the conservation of rock art in an arid and shallow environment, Liu et al. (2020) set up artificial watering and took ERT measurements above the Mogao Grottoes (Gansu Province, China). The migration of rainwater in the form of water vapour induces salt damage in wall paintings. At the thermal level, which also governs condensation and precipitation phenomena, Domínguez-Villar et al. (2023) show that the temperature inside the Los Pinos cave (Spain) has been stable for five years, demonstrating that the transfer takes place solely by thermal conduction through the massif. By contrast, Sedaghatkish et al. (2024) show that the effect of convection dominates the aeraulic behaviour of open caves in direct relation to the outside temperature. In their study of the caves of Chauvet Pont d’Arc and Pech Merle, Perrier et al. (2023) show that atmospheric pressure variations affect temperature, groundwater dripping in underground cavities and aquifer piezometric levels. A number of recent studies show the decisive role played by forests in water circulation in the vadose zone (Carrière et al., 2020; Larcanché, Sirieix, Verdet, et al., 2024; Loiseau et al., 2023). Given the findings of the research cited above, it is now clear that the conservation of rock art in caves requires precise knowledge of the entire critical zone.
One of the many caves studied to date is Lascaux. The Lascaux cave was discovered in 1940, early on in the Second World War. It was opened to the public in 1948, after major development work had been carried out, particularly at the entrance, where dozens of cubic metres of scree had been excavated. The beauty and density of the cave paintings have earned Lascaux the nickname the “Sistine Chapel of the Palaeolithic”. It has welcomed up to 1800 visitors a day, despite its small size (total developed length 250 m, average height 4 m) and shallow depth (from surface to 20 m). Condensation phenomena linked to visits and driving pigments were described as early as 1955 and, in 1960, green disease was observed (Sarradet M., in Leroi-Gourhan and Allain, 1979). Faced with the progress of the deterioration, in 1963 André Malraux, then Minister of Cultural Affairs, decided to close the cave to the public and set up a scientific council. The cave was subsequently purchased by the French state in 1972. The Lascaux cave was the first prehistoric site to be the subject of large-scale scientific studies for conservation purposes. The initial studies concerned geology, hydrogeology and geochemistry, led by H. Schoeller (ibid.), and after by Vouvé (1968). Studies of thermal and aeraulic behaviour followed (Lacanette and Malaurent, 2014; Malaurent et al., 2007). Research programmes in hydrogeology have also been conducted in recent years, culminating in PhD theses written by Lopez (2009), Minvielle (2015) and Houillon (2016). The need to avoid destructive drilling on the cave site in the interests of preservation led to a ban on drilling in the 1970s. Attempts at geophysical measurements were soon made, in particular a microgravimetry survey (Vouvé J., in Leroi-Gourhan and Allain, 1979). Some ERT measurements were carried out in the context of Lopez’s PhD thesis (Lopez, 2009). At the request of both the scientific council and the DRAC Nouvelle-Aquitaine (Regional Department of Cultural Affairs), a major geophysical measurement survey was initiated in 2012 to describe the geometry of the limestone promontory and its heterogeneities (Xu, Sirieix, Marache, et al., 2016). A time-lapse ERT device was set up to the north of the cave entrance in the same year (Xu, Sirieix, Riss, et al., 2017). While the initial aim of the measurements was to describe the contacts between the limestone and detrital formations, they soon proved to be of major interest in understanding the spatial distribution of temporary reservoirs. More recently, it has shown the importance of studying the influence of forest cover on the unsaturated massif (Larcanché, Sirieix, Verdet, et al., 2024). Taking into account the geological heterogeneities highlighted by geophysical measurements (Lharti, Sirieix, Riss, et al., 2023) has also facilitated a detailed study of the thermal behaviour of the massif surrounding the cave.
Lascaux is a highly protected site and has been subject to metrological monitoring for more than 60 years. Here, geophysics has proven itself an indispensable tool for describing the cave environment and quantifying the impact of the environment on the conservation of the cave. The long-term nature of this work has been a factor in its successful implementation. The aim of this article is to demonstrate the value of geophysical monitoring over a period of more than 10 years in an unsaturated karstic environment that houses an internationally renowned decorated cave; indeed, Lascaux has been a UNESCO World Heritage Site since 1979. The site has been equipped with sensors for so long now that we have been able to calibrate and correct data and validate certain results. Complete knowledge of the phenomena observed over a long period of time is the key to being able to both analyse and interpret the data reliably.
The first part of this article is devoted to the various measurements and methods used, with details of the corrections and precautions necessary for their quality and repeatability. The second part will then describe the main results of the time-lapse survey performed over these 11 years, explore the role of the forest and characterise the impact of the massif’s heterogeneities on its thermal behaviour. The article then proposes how all of these results may be analysed.
2. Site description, materials and methods
2.1. The Lascaux cave site
The Lascaux cave is located in an unsaturated limestone massif that formed in the Cretaceous period. The cave is located on the western flank of the Lascaux Hill. Geological and geomorphological knowledge of the site was refined in 2020 by Verdet etal The geological map extracted from this study (Verdet et al., 2020) shows that the Santonian limestone is present in the upper part of the cave up to around 180 m NGF, and that most of the cave develops in Coniacian limestone (Figure 1). Both are detrital limestones, but the Santonian limestone is composed of small plates, whereas the Coniacian is more compact. The interface between these limestones therefore appears to be a permeability interface, calling into question the existence of a marly interface (Vouvé, 1968), which has never been observed at the site.
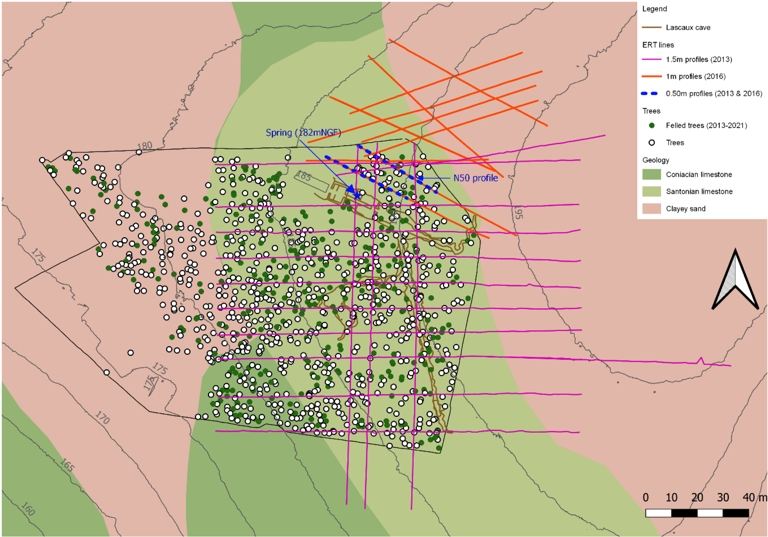
Plan view of the geology of Lascaux Hill with a projection of the cave and the position of the various ERT profiles, trees and felled trees. Geological background after Verdet et al. (2020).
The map in Figure 2 presents the names of the different chambers in the Lascaux cave.
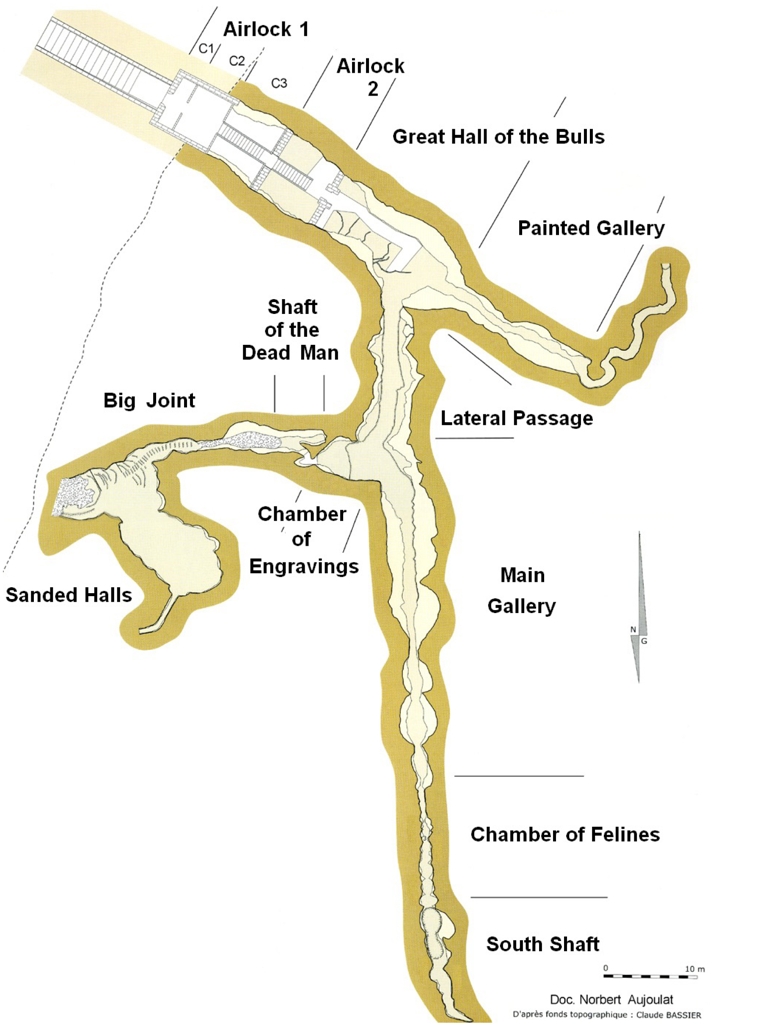
Map of the Lascaux cave after Aujoulat (2013).
The site is essentially covered by forest, with downy oak dominating the limestone section above the cave, pine to the west over sandy-clay detrital formations and chestnut to the east over sandy detrital formations. All trees within the enclosure have been inventoried and georeferenced. These trees, along with those felled in 2016 and 2021, are shown in Figure 1.
In addition, a Digital Terrain Model (DTM) survey of the Lascaux Hill surface was acquired in 2017 with a definition of 0.2 m, along with a 3D survey of the cave linked to the DTM. All geophysical measurements (the position of each electrode) and the sensors used are recorded in a topographic survey using a tacheometer. All of these data ensure that the sensors on the Lascaux site are well positioned and that the 3D analysis has been conducted with exceptional accuracy.
2.2. Microclimatic sensors
Numerous sensors (174) have been installed in the cave and in the outside environment to ensure the conservation of the rock art and the support of the cave. Temperature sensors, with a sensitivity of 0.001 °C and relative accuracy of 0.01 °C, are installed in the cave itself, at more than 20 positions in the rock (0.02 m deep in the walls) and more than 120 in the air. The outdoor sensors are installed from the surface at depths of 0.5 m and 1 m, and more recently at 0.04, 0.07, 0.20 and 0.35 m. Three weather stations are located on the hillside: in direct sunlight; under the pines; and under the oaks. All of this equipment is described in detail in Lharti’s PhD thesis (Lharti, 2023).
The cave has no perennial water inflow, but non-perennial water inflow is observed every year in airlock 1; in the Sanded Halls; in the Chamber of Felines; in the Shaft of the Dead Man; and seeping into the Great Hall of the Bulls, as described by Houillon (2016). The flow rate of the emergence located in airlock 1 of the cave is measured continuously.
2.3. Electrical resistivity tomography
Slingram, Spontaneous PolariSation and RADAR methods were deployed at this site. Their depth of investigation remained very limited, probably due to the low resistivity of the Santonian limestone and the noise associated with the sensors and acquisition units installed on site. It was therefore decided very quickly to deploy ERT on the site.
To date, 2D ERT has been used for a number of purposes. It was employed not only was it to provide monitoring of the upstream part of the non-perennial source at airlock 1 (Xu, Sirieix, Riss, et al., 2017), but also to reconstruct a 3D model of the site (Xu, Sirieix, Marache, et al., 2016; Verdet et al., 2020).
Four profiles (Figure 1) have been measured on a monthly basis since 2012, with an interruption in 2014. In this article, we present one of these profiles, called N50 (represented by the blue dotted line in Figure 1), which is 35.5 m long and comprises 72 electrodes spaced 0.5 m apart.
Several 3D reconstructions were carried out using 2D surveys acquired at different times and scales in order to gain a better understanding of the geometry of the formations encountered on the site. The first was carried out in March and April 2013. ERT profiles were laid out perpendicular to the known major fracture network (Lopez, 2009) and in two other directions. Most profiles were made using 96 electrodes spaced at 1.5 m. Profiles with only 1 m and 0.5 m spacing completed the measurements to optimise the geostatistical modelling. The position of these profiles is shown in Figure 1. To gain a better understanding of the site geometry to the north of the enclosure, upstream of the emergence of airlock 1, new measurement surveys were carried out in March and June 2016. These were conducted using 72 electrodes 1 m and 0.5 m apart, giving better resolution. The layout of these profiles is shown in Figure 1.
In all cases, the electrical arrays used are gradient and forward and reverse pole–dipole. These three electrical arrays are then concatenated to form a single image. Concatenation is performed by taking the gradient array first, then the pole–dipole arrays, to ensure that the position of the remote electrode is correctly taken into account with Res2dinv software (v.405.38). Inversion is performed using an L1 norm and mesh refinement.
2.4. Clustering method
After applying a clustering method to temporal resistivity monitoring data acquired at a hazardous waste landfill cover (Genelle et al., 2012), this method was adapted and applied to the data acquired at Lascaux. The clustering method used is Hierarchical Ascending Classification (HAC). This method consists of establishing, a posteriori as opposed to a priori (unsupervised method), a partitioning or a sequence of nested partitions of a set of individuals whose pairwise distances and agglomeration method are known. This method uses Euclidean distance and Ward’s (1963) agglomeration method, and is described in detail by Lharti (2023). The resulting dendrogram takes the form of a tree schematising the stages in the grouping of individuals, enabling the choice of the desired number of clusters (partitions) and the distances separating them. The reasons for choosing this method over a K-means method, a hybrid method or a DBSCAN (Sabor et al., 2021) are examined by Lharti, Sirieix, Riss, et al. (2023). The HAC is based on a posteriori selection of the number of clusters and improved data segmentation. This method is applied not only to the ERT time-lapse, but also to the data acquired over a large area covering the volume surrounding the cave, in order to simplify them by partitioning.
In the case of time-lapse, we have chosen to normalise resistivity values by the block size. This is because the block size assigned by the inversion varies with depth: the deeper the blocks, the larger their size. As a result, a given volume of rock will be represented by an unequal number of blocks, and therefore resistivity values, depending on whether it is shallow or deep. The choice of normalisation means taking into account surface resistivity densities. In the case studied here (profile N50, Figure 1), where resistivity decreases with depth, this has the advantage of increasing the contrast between the lower resistivity values present at depth and the higher values on the surface.
This method is, however, used without normalisation when it is applied to the classification of 3D data acquired at great depth.
2.5. Correcting the effect of temperature on electrical resistivity
Electrical resistivity is affected by the temperature of the rock. The implementation of the time-lapse and the need to compare resistivity values acquired in both winter and summer mean that these values must be corrected for the effect of temperature. In the case of 2D resistivity tomography images, we apply a correction to the centre of the blocks of each image level (i.e., to the depth of the different levels making up the image). Among the many existing models for correcting resistivity for the effect of temperatures, we chose the ratio model (Xu, Sirieix, Ferrier, et al., 2015). The difficulty then lies in collecting the temperature at different depths.
As a first step (Xu, Sirieix, Riss, et al., 2017), we employed the thermal diffusion model outlined by Lacanette and Malaurent (2014). This thermal model takes into account external air temperatures and temperatures recorded in the cave walls at different depths and makes the assumption that thermal diffusivity is homogeneous and isotropic over all the massif surrounding the cave. This enables the temperature of the massif to be estimated as a function of depth. Close to the surface, two temperature sensors were installed at depths of 0.5 m and 1 m, with a measurement interval of 15 min. Having noted a discrepancy between the model data and the sensor measurements on the day of the measurement, we performed a calibration of the temperature data from the model, close to the surface, the principle of which is detailed by Xu (2015).
Noting that this discrepancy between measurements and model could be significant at shallow depths and at certain times of the year, it appeared necessary to refine our model in order to increase the accuracy of resistivity values close to the surface. This is absolutely essential when we are concerned with the effect of the forest on the massif, i.e., the very shallow part of the massif. Instead of using air temperature data at the surface, a new model based on a heat balance at the surface has been developed. This takes into account exchanges by radiation, convection and conduction, as well as energy losses in the soil due to evapotranspiration. The latter is estimated by the classic Penman–Monteith model, widely used by agronomists (Salmon et al., 2023). The input data for this model (radiation, temperature, air speed and relative humidity) are measured on site by weather stations installed in different positions: directly in the sun; under the oaks; and under the pines. Additional data are also supplied by Météo France. To validate the new model, a temperature sensor was installed 0.04 m deep in the soil and left to gather data for 4 months. This model enabled us to determine a better single optimal thermal diffusivity for the whole massif. While the study by Salmon et al. (ibid.) showed that the massif could not be considered homogeneous, the thermal model showed values much closer to those measured at the soil surface. This model was used to process all the monthly data acquired since 2012.
2.6. Geostatistical 3D modelling of ERT images
The first ERT coverage of the 2.5 ha site was conducted over two weeks from late March to early April 2013. In total, around 20 2D profiles were acquired from 96 electrodes. These data were exploited and described for the first time by Xu, Sirieix, Marache, et al. (2016).
For data acquired in 2016, in the north of the cave, on-site acquisition took place over a one-week period in June and October. A total of 11 profiles were acquired for each measurement survey. The profiles were repositioned in exactly the same place for both surveys. The electrode spacing was chosen to be of maximum 1 m, in view of the first measurement survey (Xu, Sirieix, Marache, et al., 2016; Xu, Sirieix, Riss, et al., 2017) which showed geological structures with a higher resolution. The 2D images were acquired from northwest–southeast and southwest–northeast directions (Figure 1) to ensure that they were perpendicular to the geological structures of interest. At least two electrode spacings were used so that spatial correlations could then be studied for different distances between points. Indeed, two more profiles with electrodes spaced 0.5 m from one another were acquired. A total of 26,571 items of electrical resistivity data were available, with average resistivities of 161 Ω⋅m in June and 191 Ω⋅m in October, testifying to an overall drying up of the massif.
Following the inversion of the resistivity images, a 3D model was constructed using geostatistical methods. The variographic maps produced for each measurement survey indicate the presence of horizontal/vertical anisotropy, as well as an N130 direction. This latter feature corresponds approximately to the contact between the detrital and limestone formations, and is a known direction in this region (Verdet et al., 2020). An experimental variogram is calculated for each measurement survey (one in June and one in October). A theoretical variogram is then fitted to each of the calculated experimental variograms in the principal directions. The theoretical model is the sum of three structures based on spherical or exponential models, the same for both surveys. The range is reached at 1.5 m in the vertical plane and 9 m in the horizontal plane for a neighbourhood of 10 m, over the two measurement surveys. This shows that the structures identified do not vary over time. After conclusive cross-validation, 3D estimation using the ordinary kriging method was carried out using 0.5 m × 0.5 m × 0.5 m cells.
3. Results of ten years of ERT measurements at the Lascaux site
3.1. Time-lapse over ten years
Before describing the time-lapse of the electrical resistivity of the different formations of the Lascaux massif, it is necessary to describe the hydric context over the ten years. Analysis of the annual rainfall shows no change over time, with an average of 865 mm/year over the ten years. The least rainy years are 2014–2015, 2016–2017, 2018–2019 and 2021–2022. The summers, i.e., the periods of foliation with heavy transpiration of the oaks on the Lascaux site, run from April to October. The wettest summers recorded are in 2016, 2019 and 2021. The wettest winters are in 2014, 2016, 2018 and 2020. Precipitation generally exhibits a significant increase, becoming especially intense during October, except in September 2020 and in November 2017, before dropping off sharply from May to June onwards.
The profile presented is the N50, 25.5 m long, shown in blue in Figure 1. All the ERT images acquired on this profile since 2012 and after correction for temperature have been analysed using the HAC method (Section 2.4). This method is used to construct a dendrogram that groups the data according to their resistivity value and temporal variations in their resistivity. The dendrogram (Figure 3) has been threshold to group the data into five clusters that we consider sufficiently representative of the environment. Thresholding into three clusters distinguishes the clusters according to their depth in the massif: superficial clusters 1 and 3; intermediate cluster 2; and the deepest clusters 4 and 5. A seven-cluster threshold separates cluster 1 into two clusters according to depth, and cluster 2 is also divided into two clusters around 25 m along the profile.
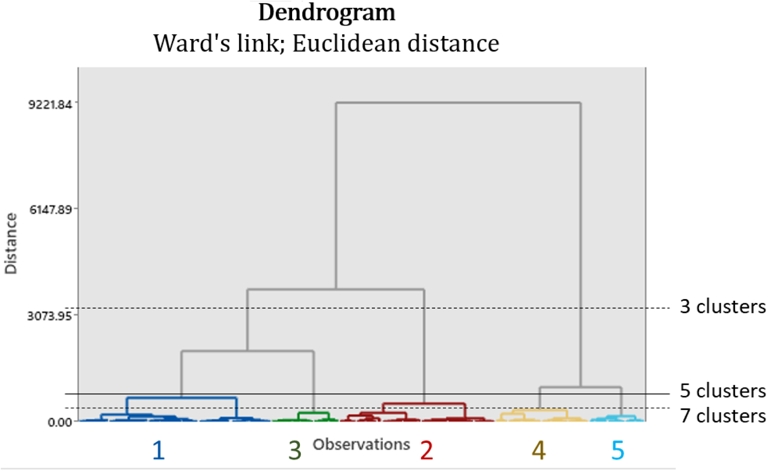
Dendrogram of electrical resistivity values for profile N50 between 2012 and 2023.
The spatial distribution of the five clusters is shown in Figure 4 together with the trees identified within a 5 m radius of the profile (Day et al., 2010). Some of these trees were felled in November 2016.
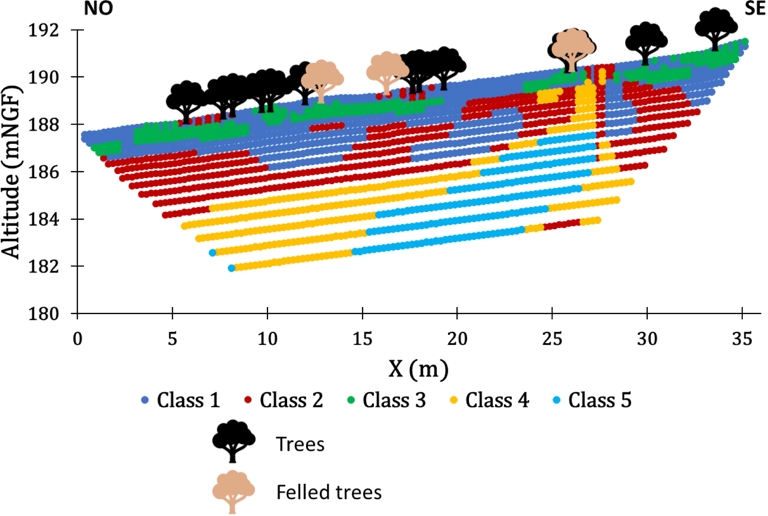
Resistivity blocks by cluster and projection of trees located within a 5 m radius of the profile.
This classification provides statistical values for each cluster. The median values for each cluster, together with the flow rate measured at the emergence of airlock 1 and the effective rainfall, are shown in Figure 5. The median values for each cluster evolve in the same way over the 11 years of measurement. Each year, there is an increase in electrical resistivity in summer (from May to July, depending on the cluster) and a plateau of lower resistivity starts from November to January.
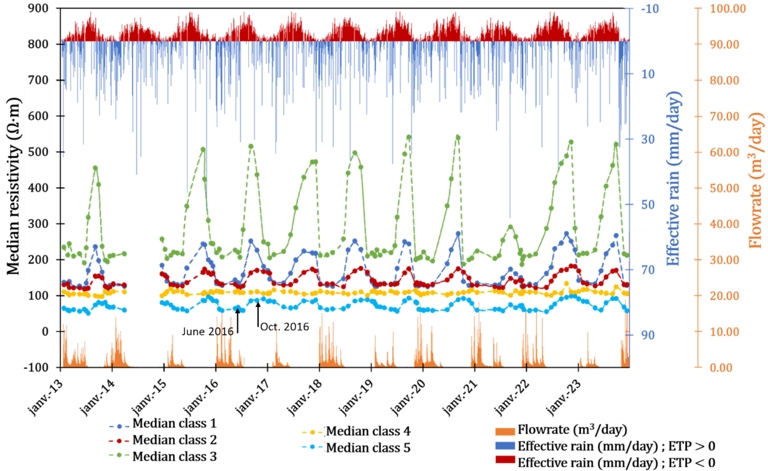
Evolution of median resistivity for each cluster, flowrate through airlock 1 and effective rainfall between the beginning of 2013 and the end of 2023.
As far as low electrical resistivity values are concerned, the plateau is reached every winter for almost all clusters. In the following section, we will assume that the values representing the lowest 25% of median resistivity (1st quartiles) represent the lowest resistivity values.
The 1st quartiles of the median resistivity value are different for each cluster:
Clusters 1 and 2, corresponding to the levels closest to the surface, have an identical minimum electrical resistivity (1st quartile) of 130 Ω⋅m. Cluster 1 generally extends from the surface down to 1.3 m and sometimes up to 2.4 m. Cluster 2 is generally below cluster 1 and down to a depth of 3.7 m.
Cluster 3, located roughly between the surface and 1 m depth, and mainly between 0.6 and 0.8 m, reaches the highest value of 213 Ω⋅m.
Cluster 4, deeper and located around cluster 5, has the value of 105 Ω⋅m.
Cluster 5, located the deepest (between 3.2 and 7 m), has the lowest value on this profile with 61 Ω⋅m.
The differences in minimum resistivity values between the clusters are significant, and undoubtedly reflect the nature of the geological materials from which they are composed and state of weathering that they have undergone.
As for the maximum median resistivity values, there is no plateau, in contrast to the minimum values. For all clusters, the maximum resistivity value is significantly lower in the summer of 2021, which is associated with a very wet summer.
In detail, each of these five clusters behaves differently in terms of both amplitude and cycle duration. The amplitude of the medians is very high for cluster 3, located under the trees, and reaches 300 Ω⋅m. For superficial clusters 1 and 2, it is 120 and 60 Ω⋅m, respectively, bearing in mind that cluster 2 is generally deeper than cluster 1. Concerning the deeper, less resistive clusters, the amplitude is lower with values of 20 Ω⋅m and 40 Ω⋅m for clusters 4 and 5, respectively.
The annual cycle of the different clusters shows repeatability over 11 years, even if slight shifts are observed for some of them, depending on previous rainfall.
Cluster 1, which is the most superficial, generally shows maximum resistivity in September; but this maximum resistivity was reached in late October in 2015, 2017 and 2022, which were less rainy years. This cluster responds fastest after the beginning of the autumn rains. This cluster reaches the minimum resistivity plateau between December and January, and remains there for several months. The increase in resistivity occurs between March and June (for the years 2016, 2019 and 2021).
Cluster 3, which is located mainly below the trees, reaches maximum resistivity in September and sometimes early October, as it is for cluster 1. Two years show a maximum reached late in November (2017 and 2022). The start of the minimum plateau is generally reached in January, sometimes in November (years 2013, 2019, 2020, 2023), i.e., one month earlier than cluster 1. The end of the plateau is almost always in late April or early May, with the exception of March 2020 and 2022.
Cluster 2 is deeper than the previous two. It reached maximum resistivity in October and November in 2017 and 2022. It often shows a plateau in the maxima. The start of the minimum resistivity plateau is reached in February and sometimes in December (2019, 2020, 2021). The end of this plateau occurs between March (2020), June and sometimes July (2016, 2019, 2020, 2021). Every year, all cycles are one month later than the shallower cluster 1.
Cluster 5, which is deeper than cluster 2, also shows annual cycles of resistivity variation. The maximum resistivity is reached between October (2013, 2017, 2018, 2019, 2020, 2021, 2023) and December (2015, 2016, 2017, 2022), generally one month after cluster 2. A plateau was reached over several months in 2016, 2017, 2018 and 2021. Minimum resistivity is reached between December (2019, 2021, 2022, 2023) and January (2016, 2017, 2018, 2019, 2021), i.e., slightly before cluster 2. The resumption of significant flow in the airlock 1 emergence occurs around 15 days after the plateau is reached. These 15 days are related to the monthly step of ERT’s time-lapse measurements. The end of the minimum resistivity plateau varies between June and July, approximately one month after cluster 2. For each year, it can be seen that flows from airlock 1 cease approximately one month before the median resistivity begins to rise.
Cluster 4, which has a very low amplitude cycle of the resistivity median, is more difficult to analyse. However, the median values of this cluster show a slight tendency to increase from 2013 to 2023. The null hypothesis, i.e., independence of resistivity versus time, is rejected (Fischer Snedecor test F = 7, p-value = 0.009).
3.2. 3D extension of cluster 5
Time-lapse ERT has revealed resistivity clusters with different temporal and spatially organised behaviours. In particular, cluster 5, the deepest, seems to behave synchronously with the water flow measured in airlock 1. In order to identify the spatial extension of cluster 5 in 3D, a 3D image was constructed using the results of two measurement surveys:
One in June 2016, a period of low resistivity at depth (Figure 5), located in the range of minimum values of the resistivity median and therefore corresponding to high water content.
A second in October 2016, a period of high resistivity. Although the maximum resistivity is reached in December 2016, the measurement acquired in October still corresponds to a high resistivity value, very close to that of December. We can therefore assume that this date reflects a material with a low water content.
From the June 2016 3D model (Figure 6) on the section located on a 185 m NGF elevation plane, cluster 5 with low resistivity is clearly visible at the south-eastern end of the N50 measurement profile. It extends northwards towards the detrital formations. In the direction of the south, it continues towards the cave’s airlock after a change of orientation roughly east–west at 184 m NGF to arrive at the right of the airlock 1 emergence at 182.5 m NGF, roughly at the same altitude as the emergence, which is at 182 m NGF. Another branch emerges to the north, to the north of the N50 profile. It joins the first structure at 182.5 m NGF, just before the emergence.
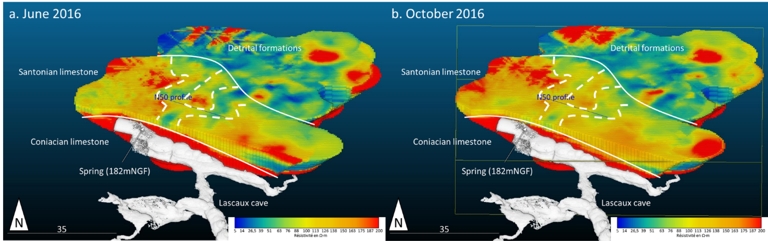
3D view of the north of the cave, with a section at 185 m NGF. (a) June 2016; (b) October 2016.
In October 2016, the structures identified above differed very little from their surroundings. The overall resistivity of the massif increased, in line with the driest period on the Lascaux site. The electrical resistivity of the identified structures has risen sharply, suggesting that the water content has dropped just as sharply, reducing the resistivity gap between it and the surrounding limestone. In addition, the northern end of these structures in the limestone formations also shows an increase in resistivity of the same magnitude as that measured at profile N50.
Only the formations located beyond the boundary separating limestone from detrital formations see their resistivity values remain low, with channelided forms. Some structures, which became more resistive in October 2016, appear to extend the so-called cluster 5 formations.
3.3. Effect of tree felling
The Lascaux Hill is marked by extensive forest cover (Figure 1). Forest management has been in place since 2013, and its impact on the unsaturated massif deserves further attention. Time-lapse surveys conducted over more than 11 years have been resumed and studied in detail in order to determine the role of trees, mainly oaks and pines, in the hydric behaviour of the massif (Larcanché, Sirieix, Domec, et al., 2023; Larcanché, Sirieix, Verdet, et al., 2024). Thinning has been carried out to allow the forest to develop as well as possible, with a view to preserving the site from the risk of storms. Two felling operations took place, in November 2016 and January 2021, mainly involving pine trees. A localised zone under the felled trees within a 5 m radius was defined around the ERT profile (Figure 4) and to a depth of 1.2 m. This zone was subsequently analysed, and its median resistivity is plotted in Figure 7.
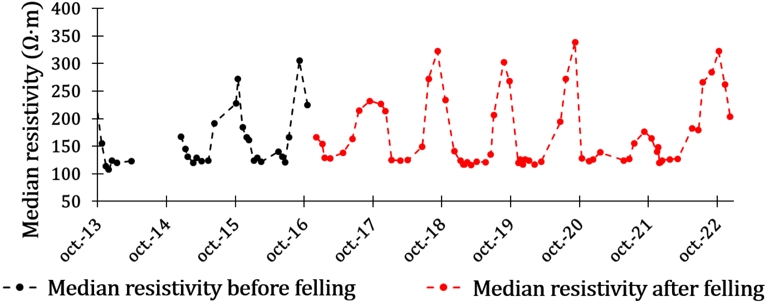
Evolution of the median resistivity under a zone with a radius of 5 m around the trees and a depth of 1.2 m, from Larcanché, Sirieix, Domec, et al. (2023).
The peak electrical resistivity median was significantly reduced in the summer of 2017, after the trees had been felled in November 2016. This phenomenon has been observed in all four profiles studied over the last 11 years at the Lascaux site (Larcanché, Sirieix, Domec, et al., 2023; Larcanché, Sirieix, Verdet, et al., 2024). No change has been observed in the winter values. On first analysis, the curves seem to return to their maximum in summer 2018.
3.4. Influence of karstic massif heterogeneities on heat propagation to the cave
The electrical resistivity data acquired at this site show that the massif is highly heterogeneous, in terms of both the dispersion of resistivity values and their spatial arrangement. These electrical heterogeneities can be related either to the geological nature of the formations (Santonian limestone, Coniacian limestone, detrital sandy or clayey formations) or to the water content of certain structures resulting from the weathering of detrital limestones. Furthermore, Salmon et al. (2023), Lharti, Lacanette, et al. (2025) showed that heat propagation through the Lascaux massif could not be simulated with high accuracy with the diffusivity of a single medium. It therefore appeared necessary to re-use the data that had been acquired in 2013 (Xu, Sirieix, Marache, et al., 2016) on the entire massif in the vicinity of the cave, in order to take into account the impact of heterogeneities on heat propagation across the massif (Lharti, 2023). The 2013 data have been subjected to a classification that took all profiles into account (Lharti, Sirieix, Riss, et al., 2023). This classification was applied to the 3D geostatistical model (Lharti, Sirieix, Marache, et al., 2025) having filtered out the anthropized part of the massif on the site. A representation of these heterogeneities is shown in Figure 8. This spatial distribution was used to estimate thermal diffusivity values for each cluster, using an inverse resolution methodology. This method is based on an objective function that depends on the phase shift and damping of waves measured and simulated thanks to 21 temperature probes placed in the cave walls at different depths (up to 21.5 m).
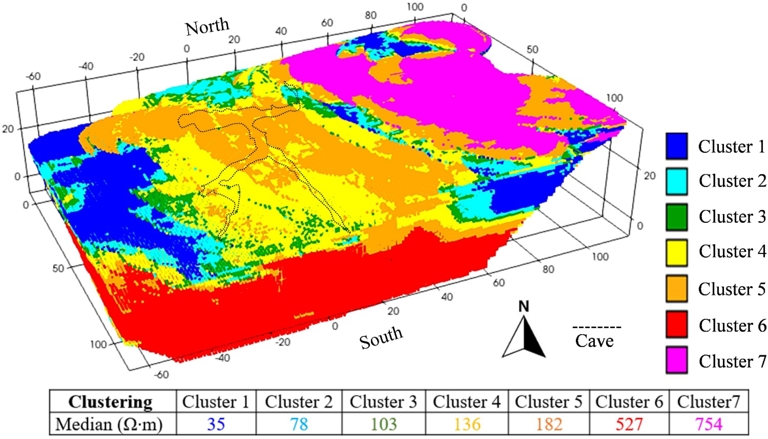
3D visualization of spatial heterogeneity over the entire site, classified into seven clusters with the median resistivity value for each cluster.
4. Discussion
The analysis of time-lapse ERT over a period exceeding ten years makes it possible to interpret differences between the various clusters, both in terms of extreme values and the time lag between clusters. When analysing the data, it is essential to consider rainfall variability in terms of both quantity and seasonality.
We assume a close link between variations in resistivity and water content, given the very low clay content measured in samples taken from the site.
First of all, as described above, cluster 4, which varies little over the course of a year, shows an upward trend in resistivity between 2013 and 2023. The study of the maximum values for each year, assimilated to the 3rd quartile of resistivities of each cluster, reveals a slight upward trend over the 11-year period for clusters 1 and 3. An exception to this trend is 2021, which was marked by a very wet summer. This indicates that the superficial part of the massif tends to dry out in the summer months. Given that precipitation levels remained constant throughout the 11-year study period, two potential explanations for this drying-up phenomenon can be postulated. The first interpretation can be attributed to tree growth. The growth of the trees and the increase of diameters over the course of the 11 years could explain the increase in transpiration. The second interpretation could be related to the observed increase in the hotter temperatures (3rd quartile), i.e., summer temperatures. Assuming a linear model for the pair of variables (temperature/time), the null hypothesis H0 (independence of the variables) must be rejected (Fischer Snedecor test F = 9, p-value = 0.017). Assuming this linearity, the increase in annual temperatures of the 3rd quartile can be estimated at 2.4 °C. An increase in summer temperatures likely has the effect of increasing both evaporation and transpiration.
Considering the 1st quartile of the median resistivity of each cluster as representative of their low resistivity values, we can see that it is almost constant over the course of several months. The most superficial clusters, designated 1 and 2, exhibit a resistivity value of 130 Ω⋅m. This value is notably low for limestone. This therefore reflects the weathering of limestone and its high porosity on a macroscopic scale which is linked to the space left between centimetric platelets. Cluster 3 near the surface shows a much higher minimum threshold of 213 Ω⋅m. The presence of trees above this cluster indicates the potential for permanent exchanges with the surface or filling of the porosity by rootlets. Cluster 5 exhibits a markedly lower median resistivity than the other clusters, at 61 Ω⋅m. We can assume that it represents a more advanced stage of weathering with a higher water content throughout the year. In the vicinity of the site, the implementation of excavation has facilitated the observation of sandy passages within the limestone, a phenomenon that is also evident in the cave in the Sanded Hall (Figure 2). Cluster 4 has a significantly lower median value of 105 Ω⋅m in comparison to the most superficial clusters, but does not reach that of cluster 5. This suggests that the weathering process may be less advanced than that observed in cluster 5.
The cyclical evolution of the clusters exhibits notable differences. Cluster 1, the most superficial, which extends to a maximum depth of 1.3 m, reaches a minimum resistivity threshold between late December and early January, i.e., two months after the resumption of rainfall. The process of drying out, which occurs with the highest resistivity value, takes place in September and October in years with less precipitation. This cluster reflects the behaviour of seepage water over the first metre of the massif. Again, its low resistivity and the wide range of annual variations indicate a high porosity and consequently a state of weathering. Visually, small trenches dug to the south of the site show that the soil contains a lot of organic matter in the first 0.1 m, followed by small, disjointed limestone platelets enveloped in silt. As the limestone matrix has a porosity of 5% (Verdet, 2019), it can only be concluded that this is the result of macroscopic-scale porosity.
The median resistivity variations in cluster 2, which lies below cluster 1 and down to a depth of 3.7 m, are approximately half the amplitude of cluster 1. Furthermore, the maxima and minima of this cluster always occur one month after the minima and maxima of cluster 1, regardless of the year. The greater depth of this cluster indicates that the one-month time lag is associated with the time taken for water to infiltrate the surface environment. This cluster appears to represent the continuity of the gravity infiltration front, and also reflects a material that dries out at a slower rate than cluster 1, exhibiting a lower maxima.
It is noteworthy that the temporal variations in cluster 3, which are also superficial (between 0 and 1 m, often between 0.6 and 0.8 m), deviate from the norm. The resistivity is higher than all the other clusters and the amplitudes are extremely high (300 Ω⋅m). The influence of maize roots has been simulated by Rao et al. (2019), showing that any such impact depends on the size of the roots and the soil. According to Archie’s law, a ratio of degrees of water saturation of 62% would be observed between summer and winter. Furthermore, it reaches a resistivity maximum at the same time as cluster 1 except in 2017 and 2022, when measurements were taken following the felling of trees on the site. Cluster 3 responds first, occurring between December and January, approximately less than one month before cluster 1. This occurs shortly after the resumption of precipitation, and the decrease is very abrupt. As this cluster is located under the trees, it would reflect the impact of the resumption of precipitation (between September and November) and the concomitant reduction in leaf activity, particularly oak transpiration. Regardless of rainfall, the end of the minimum plateau is reached at the end of April. This period is undoubtedly linked to the resumption of foliation observed in oaks from early April, accompanied by significant evaporation a month later when foliage is more developed and the duration of sunshine is greater. The amplitude of the seasonal cycles is much greater than in clusters 1 and 2, suggesting greater drying in summer, linked to tree transpiration. Clearly, the temporal behaviour of this cluster is closely linked to tree transpiration activity. In addition, trees are located within a 5 m radius of the profile. This cluster must be the site of the most active root tissue, in the form of rootlets, as observed in a trench to the south of the Lascaux site. Rieder and Kneisel (2023) show that the high variability of electrical resistivity is noticeable at a depth of 0.4 m under pines and beeches in sand and conclude that this variability is due to the influence of roots. This depth is consistent with the depth of cluster 3 (from 0 to 1 m and especially between 0.6 and 0.8 m) in limestone.
This time-lapse study allowed us to gain a more detailed of the behaviour of the massif under the felled trees, within a 5 m radius. It clearly shows a decrease in resistivity under these trees in the summer following their demise. Transpiration is weakened around the felled trees, and compensation from the surrounding trees has not yet taken place, beginning instead in the following summer. This suggests that the phenomenon of compensation of the other trees, whether linked to leaf or root enlargement of the remaining trees, is effective after 18 months. The end of this compensation period is more difficult to estimate, given the temperatures and electrical resistivity of the superficial clusters between 2013 and 2023. The area studied shows no increase in electrical resistivity, unlike the superficial clusters studied previously.
Cluster 4 shows no real annual variation. The most likely analysis of this cluster is that made by Riss et al. (2016). Indeed, detailed analysis of block resistivity values over the seasons shows a centripetal flow of water towards cluster 5. The median of this cluster is therefore not representative of this spatially variable behaviour but this value increased over the course of the 11 years.
Cluster 5 is unique, with a very low minimum resistivity median of 61 Ω⋅m and a maximum value of 110 Ω⋅m, i.e., applying Archie’s formula, a ratio of degree of saturation of 75%. The maximum resistivity is reached one month after cluster 2, while the minimum threshold is reached one month before cluster 2. This cluster is therefore fed exclusively by gravity infiltration from cluster 2. What is remarkable is the temporal link with the flow rate measured at the outlet of airlock 1. The minimum resistivity threshold is reached almost synchronously with the occurrence of a significant flow, whatever the year considered, and the decrease in flow occurs about 1 month before the resistivity increases again in cluster 5, suggesting that the absence of water supply to this cluster and the drainage by the airlock’s source generates this drying out measurable in ERT. In addition to this temporal link, the spatial location of this cluster at an altitude slightly higher than that of the spring and which can be extended, as shown on the 3D model (Figure 6), suggests that this is indeed a temporary reservoir that feeds the outlet of the airlock. The shape of this reservoir has the tortuosity of a karstic conduit, suggesting that it has been altered in the form of sand. This type of sandy formation can also be seen both in the Sanded Hall of the prehistoric cave and in excavation work. Furthermore, a spatial continuity towards the contact point between the detrital and calcareous formations, located further north, seems to emerge. The temporal variation in the shape of this reservoir could point in the direction of a water flow, which might begin from the contact point with the detrital formations. This would explain why cluster 5 is not only fed by the overlying cluster 2. Furthermore, from a conservation point of view, the extension of this temporary reservoir into the detrital formations would mean that not only the limestone formations would have to be protected, which is already the case, but also the detrital formations. However, the risk of water pollution arriving at the outlet of airlock 1 is reduced by the fact that water infiltrating the sandy-clay detrital formations will be filtered as it passes through the detrital formations and then the weathered limestone formations. Furthermore, the volume of this reservoir can be estimated at 880 m3 (Verdet, 2019) based on the geometric data of the 3D model, i.e., a water volume of 264 m3 with a porosity of 30%.
This study of the site and the previous data have made it possible to examine the impact of heterogeneities on heat propagation in the massif. Initial estimates of the thermal diffusivity of the different clusters that make up the Lascaux massif in the vicinity of the cave suggest values consistent with knowledge of the geological formations (Lharti, Sirieix, Salmon, et al., 2024). Coniacian limestone is found to present a thermal diffusivity of 2.2 × 10⁻⁶ m2⋅s−1; around 1 × 10⁻⁶ m2⋅s−1 for sandy-clay formations and around 6 × 10⁻⁷ m2⋅s−1 for weathered Santonian limestone. Knowing the thermal diffusivity of each cluster and the temperature at many points, heat propagation could be simulated across the massif and into the cave.
Initial simulations show that the decisive role played by the interface between the Santonian and Coniacian limestones, which, although sub-horizontal, generates different thicknesses of Santonian limestone, depending on both the topography of the hill and the influence of detrital formations. In addition, the considerable disparity between the thermal diffusivities of these formations affects heat propagation significantly. In May, the superficial rock mass is influenced by the cold temperature of winter (Figure 9) due to the phase shift. It is therefore clear that heat propagation is faster in the north-eastern part of the cave than in the southern, superficial part in May. Generally speaking, taking geophysical and geological heterogeneities into account results in a thermal front that is neither horizontal nor parallel to the topography. Temperatures at the cave wall will therefore differ according to their spatial position. For example, the right wall of the Great Hall of the Bulls is affected by the thermal front before the left wall. This effect can also be observed between the southernmost gallery (Main Gallery), under a thicker layer of Santonian limestone, which cools at a faster rate than the easternmost gallery (Painted Gallery), which is also close to detrital formations (ibid.).
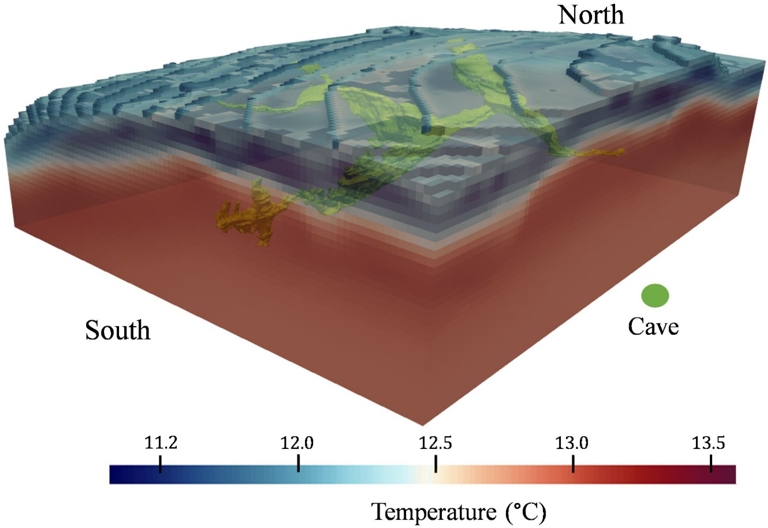
3D model of temperature propagation through the Lascaux massif on 15 May 2014 after eight years.
5. Conclusion
The conservation of decorated caves requires knowledge of the surrounding environment. This extends from the vegetation to the adjacent rock, and includes the circulation of water in the massif itself, as well as external climatic conditions such as changes in air temperature and rainfall. The phenomena observed and recorded have long-term impacts and necessitate an understanding of multiple hydro-climatic cycles.
The Lascaux site has been studied and equipped by microclimatologists for over 60 years, and has been subjected to geophysical and forestry research for over 10 and 7 years, respectively. Using all of the available data gathered through these studies not only makes this analysis possible in the first place; it also highlights the links between the various phenomena observed.
This article has shown that ERT can be used to discriminate between different clusters with similar temporal variations, using statistical clustering methods such as HCA. It has demonstrated that these clusters are related to the more or less rapid way in which water circulates in each of them. A particular cluster is distinguished by its temporal variations. The spatial extent of this cluster could be determined with 3D surveys carried out at two characteristic dates determined by the knowledge of the temporal behaviour of this cluster: the periods of high and low water content of this cluster. The end of the identified volume is located near the source of airlock 1. The temporal consistency of the resistivity variations with the flows recorded in the emergence makes it the temporary reservoir of the source of the airlock 1.
While water infiltrating the massif plays a direct role in reaching the decorated walls, whether on the rock art or on the supporting rock, it also plays a role in the thermo-aeraulic balance of the cave. At Lascaux, the water temperature is almost always colder than the rock temperature, but the presence of water also modifies the thermal diffusivity of the rock mass.
The 3D modelling of ERT data from the massif surrounding the cave clearly illustrated the close link between electrical resistivity heterogeneities and the nature of geological formations (Xu, Sirieix, Marache, et al., 2016; Verdet et al., 2020). It was therefore essential to study the effect of these heterogeneities on heat propagation through the massif surrounding the cave. This geophysical and thermal coupling proved invaluable. It demonstrated the respective influence of the different geological formations and showed the close links in this context between thermal diffusivity and electrical resistivity for the majority of the materials encountered at the site. However, the effect of variations in the water content of the various reservoirs has not yet been modelled, and further investigation in this area would be beneficial from a conservation perspective.
Furthermore, the ongoing research continues to highlight the impact of the forest and tree felling on water circulation within the massif, directly influencing water circulations in the cave. However, the potential for significant and prolonged disruption to this process may be more pronounced in the event of a widespread forest die-off, as might be caused by climatic events such as fires or storms.
The hydro-thermal-air balance at the cave wall is contingent upon the totality of external events and the massif’s capacity to absorb them. This balance can either favour condensation or precipitation phenomena or modify the existing flora and fauna in the cave. It thus appears evident that studies aimed at the conservation of caves must consider all external events, as well as the entirety of the critical zone. While this has been demonstrated at the Lascaux site, further studies of caves in different contexts (open to the public, ventilated, deeper, etc.) would be beneficial, taking into account the existing body of knowledge.
Declaration of interests
The authors do not work for, advise, own shares in, or receive funds from any organization that could benefit from this article, and have declared no affiliations other than their research organizations.
Acknowledgements
The authors would like to express their gratitude to the French Ministry of Culture for its financial support. In particular, they wish to acknowledge the invaluable assistance of Muriel Mauriac, curator of the Lascaux cave, who provided unwavering support as well as access to the site.