

1 Introduction
The rapid growth of the population in the West Bank area (6000 km2, and 2.5 million inhabitants) prompts an in-depth investigation of the hydrogeological system to avoid the establishment of unsustainable conditions in this semi-arid region that suffers from limited water resources. Groundwater is recharged by rainfall at both shallow and deeper depths; natural springs also used to play an important role in providing water for drinking, agriculture and domestic use. However, due to the overexploitation of the groundwater, the water flow rate is decreasing with a major impact on the quality of the population's lives (Alatout, 2000; Sbeih, 1990).
Prior to obtaining complex official permissions for field prospection, non-invasive geophysical techniques were employed on the West Bank to improve the knowledge of the subsurface hydrogeological system near a series of springs and dug wells; the present study was requested by the municipality of Bani Naim (Fig. 1) in the Hebron District (31°32′00″N to 35°05′42″E).
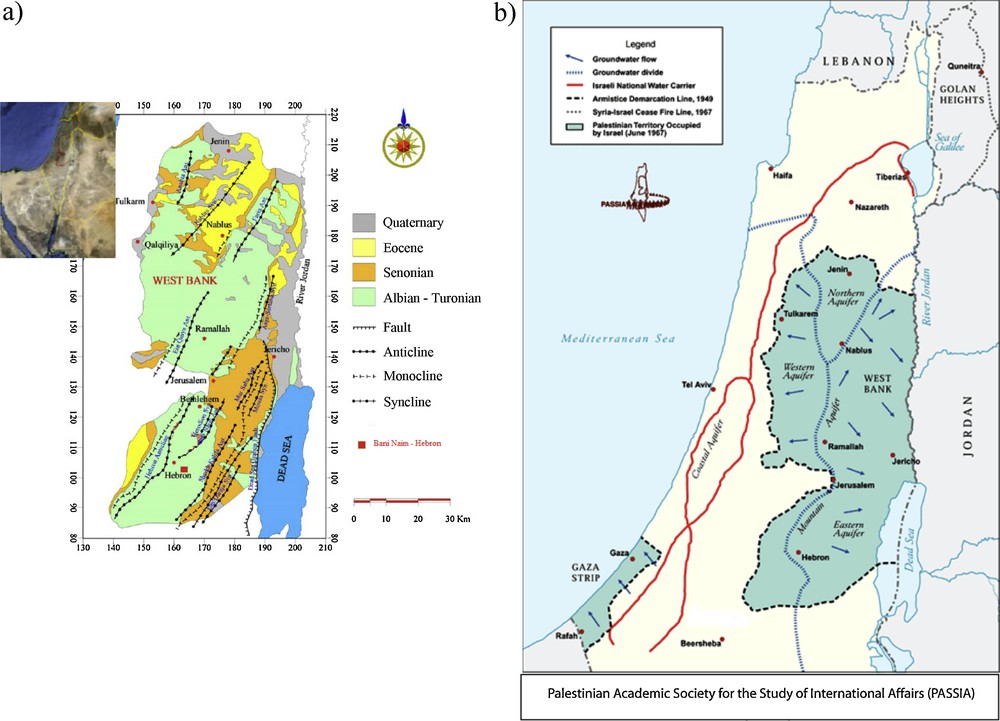
a) The investigation study zone; Bani-Naim-Hebron, West Bank, Palestine. General geological and structural map of the West Bank (modified after Abed Rabbo et al. (1999)) (Qannam, 2003). b) Water resource map of the West Bank (after PASSIA http://www.passia.org/palestine_facts/MAPS/WaterSources.html).
a) Zone d’étude; Bani Naim-Hébron, Cisjordanie, Palestine. Carte géologique et structurale de la Cisjordanie (modifié d’après Abed Rabbo et al. (1999)) (Qannam, 2003). b) Carte de ressource en eau en Cisjordanie (d’après PASSIA http://www.passia.org/palestine_facts/MAPS/WaterSources.html).
Limited studies have already been made in the region, while a hydrogeology study was carried out on the Al-Aroub drainage basin in north-eastern Hebron (Qannam, 2003), and the groundwater beneath the Ram Allah District (Mimi and Assi, 2009) is being exploited. An accurate understanding of the hydrogeological system is required and must take into account the complexity of the in situ conditions. Therefore, electrical and electromagnetic techniques were chosen to improve the hydrogeological knowledge by determining subsurface resistivity (of the upper 20 m), where rain water might circulate through the chalk, chalky limestone, limestone and rock fractures. The aim of this study is to characterize the subsurface infiltration zones and the geometry of the infiltration features, as well as to determine the interfaces between the different layers. A further aim is to understand the link between water storage and infiltration mechanisms within the chalky limestone, limestone and heterogeneous chalky geological formations usually considered as aquitards.
2 General site characteristics
2.1 Geological context
On the West Bank, the outcrops are composed of carbonate sediments and Tertiary, Cretaceous and Jurassic rocks. Older rocks are not visible at the surface although their existence is known from boreholes. The oldest exposed rocks belong to the Bajocian-Bathonian/Jurassic at Wadi Almaleh in the North-East of the West Bank, overlain by younger strata of the Albian, Cenomanian, Turonian, Senonian (Cretaceous), Paleocene and Eocene (Tertiary), exposed on both flanks of the anticlinal axis in the West Bank. Whilst the Cenomanian and Turonian limestones are generally very hard and resemble marble, the Senonian and Eocene limestones are generally soft and chalky. In the Jordan valley and on the shores of the Dead Sea, as well as in the wadis and the interior valleys, younger formations of Pleistocene/Holocene age are found (Fig. 1a). The Tertiary, Cretaceous and Jurassic rocks on the West Bank are mainly limestone, dolomite, chalk and marl with flint bands (Abed and Alwishahe, 1999; Qannam, 2003). The morphology of the West Bank is a result of folding, faulting and subsequent denudation. The dominant geomorphological features of the West Bank are found in the Hebron region, which reaches 1020 m in elevation. These features turn northwards into the Jerusalem Mountains, Nablus Mountains and Jenin Hills (300–400 m). The Jordan River valley and its Dead Sea terminal are significant geomorphological features (200 m above sea level to 410 m below sea level).
As an example of a region situated in the southern part of the West Bank, the studied Bani Naim area is located in the Hebron formation, in the upper younger strata of the Cenomanian Hebron. At a regional scale this formation is composed of karstified grey dolomite, dolomitic limestone and the basement is hard dolomite and dolomitic limestone with some silicification. The porosity is mainly secondary and the rocks are karstified (Qannam, 2003). Based on observations of geological sections in the valleys, the upper surface geology of the Bani Naim area is composed of hard limestone layers with some fractures above chalky limestone and chalk; the facies of the latter formations are discontinuous and irregular. Other formations of marl, clay and sand, may be found locally.
2.2 Hydrological context
The West Bank is a mountainous area divided into several different regions where the water resources decrease from north to south and from west to east making the region increasingly semi-arid (Fig. 1b). In this mountainous region, 68% of the rainfall is lost through evapotranspiration, and surface runoff brings huge water quantities across the valleys towards the Dead or the Mediterranean Sea.
Groundwater recharged by rainfall is the main water resource. Temperature and precipitation vary with altitude. Rainfall varies temporally and spatially, it can be as low as 150 mm/y in the eastern part of the central and southern regions and as high as 1110 mm/y in the northern and central mountainous parts. Overall, the average annual rainfall was recently estimated at 409 mm/y in the centre and 275 mm/y in the southern region. Although most of this water is lost, an estimated 550 to 700 million m3 flow percolates into aquifers (Sbeih, 1996).
2.3 Site studied
At the Birein site, two wells (Wb1 and Wb2) were dug by the inhabitants for domestic use. Manual excavation tools were used down from 6 to 8 m. The inner wall of the dug wells is covered by stone facing permitting water to fill the well but preventing detailed geological observations. Surface evidence and outcrops indicate, however, that the shallow geological formations consist of clay, sand, and various types of limestone sediments above chalky rocks. Until now, the chalky layers had been considered as aquitards with low permeability able to store and slowly transmit groundwater vertically from one aquifer to another, thus acting as confining units of aquifers. At the regional scale, thin layers of poor-quality soils are found at the surface of Bani-Naim, negatively impacting the development of the area.
3 Methodology
Electrical Resistivity Tomography (ERT) (multi-electrode array) and Transient Electromagnetic (TDEM) methods are used to determine the electrical resistivity of the geological layers, by achieving 1D inversion, 2D inverted sections and 3D views. The latter techniques are preferred due to their effectiveness in shallow exploration: locating shallow cavities, fractures, estimating layer thicknesses, detecting interfaces between layers and explaining groundwater flows (Al-Tarazi et al., 2006; Guérin, 2005; Guérin et al., 2009; Tabbagh, 2006); tests were made in semi-arid regions to avoid producing resistivity artifact that can appear when the standard time-lapse inversion is used (Clement et al., 2009).
More than 30 ERT profiles and 15 TDEM soundings were carried out. Parallel and perpendicular profiles were measured by employing several electrode array configurations and inter-electrode spacing, while a set of coincident electromagnetic soundings were conducted.
ERT profiles revealed more local differences in the shallow structures than the TDEM soundings due to the different resolution (and smaller density) of the TDEM data, while a better resolution of the low- than of the high-resistivity layers can be expected from the TDEM technique. However ERT profiles are excellent for characterizing shallow layers and delineating the geological feature geometry by demonstrating the spatial resistivity distribution. Data collected with the ERT and TDEM techniques are reliable and correlated, and the interpretation of resistivity models indicates well-defined geo-electrical layers with significant resistivity contrasts.
3.1 Electrical resistivity tomography
ERT is a multi-electrode technique with a set of electrodes regularly placed along a profile, (2D investigation), or along a series of parallel profiles (3D investigation). Apparent resistivity is determined by calculating the resistivity of a homogeneous medium which, with the same electrode spacing, would produce the same voltage differences as the measured one (Parasnis, 1986). The ERT technique measures the electrical resistivity variations revealing subsurface conditions and characteristics of the structure components (soil and rock).
Multiple field data measurements are made to describe both vertical and lateral resistivity differences by employing various array configurations: Schlumberger, Wenner alpha, Pole-dipole, Dipole-dipole. 2D pseudo-section inversions are then made delivering a model of electrical resistivity spatial variations. A ‘Syscal junior’ resistivity meter (Iris Instrument) associated with two multi-node arrays comprising thirty-two electrodes was used. Least-squares inversion was applied (Loke and Barker, 1996) to obtain apparent inverted resistivity pseudo-sections, and to measure lateral and vertical resistivity variations. The following programmes were used to process field data: Prosys, X2ipi (Robain and Bobachev, 2002) and Res2DInv (Loke, 2006). These programmes were used for the field data acquisition, the filtering, and the inversion of 2D pseudo-sections resistivity models, respectively.
3.2 Electromagnetic method (TDEM)
TDEM methods, also known as time-domain electromagnetic, measure the electrical conductivity of soils and rocks by inducing transient currents in the ground with a transmitter coil and measuring the decay of the induced current over time through different subsurface layers. The resulting secondary field depends on the geological layer resistivity, and the decay rate of the measured voltage is used to estimate the resistivity values at different depths (Nabighian and Macnae, 1991; Ranieri, 2000). In this study, field data were acquired by applying several coincident loop configuration TDEM soundings, where a single loop (25 m × 25 m) is employed as a transmitter (Tx) and a receiver (Rx) with the injection of two currents of different intensities to obtain strength signals. However, the background electromagnetic noise may have a significant influence on the investigation depth. The TEM Fast 48HPC device made by AEMR (http:\\www.aemr.net) was used to make the measurements with only a single turn loop (in coincident configuration). By data processing using TEM Res (http:\\www.aemr.net), a 1D model is constructed showing the resistivity and thickness of each layer. By successive sounding inversions, a 2D cross-section of the electrical resistivity can be established.
4 Experimental results
The experiment concerned two sites close to each other: Bani Naim-Jahir and Bani Naim-Birein (Fig. 2) situated on the eastern semi-arid side of the Hebron Mountains. A combination of electrical and electromagnetic geophysical methods offers the best explanation of the existing phenomena.
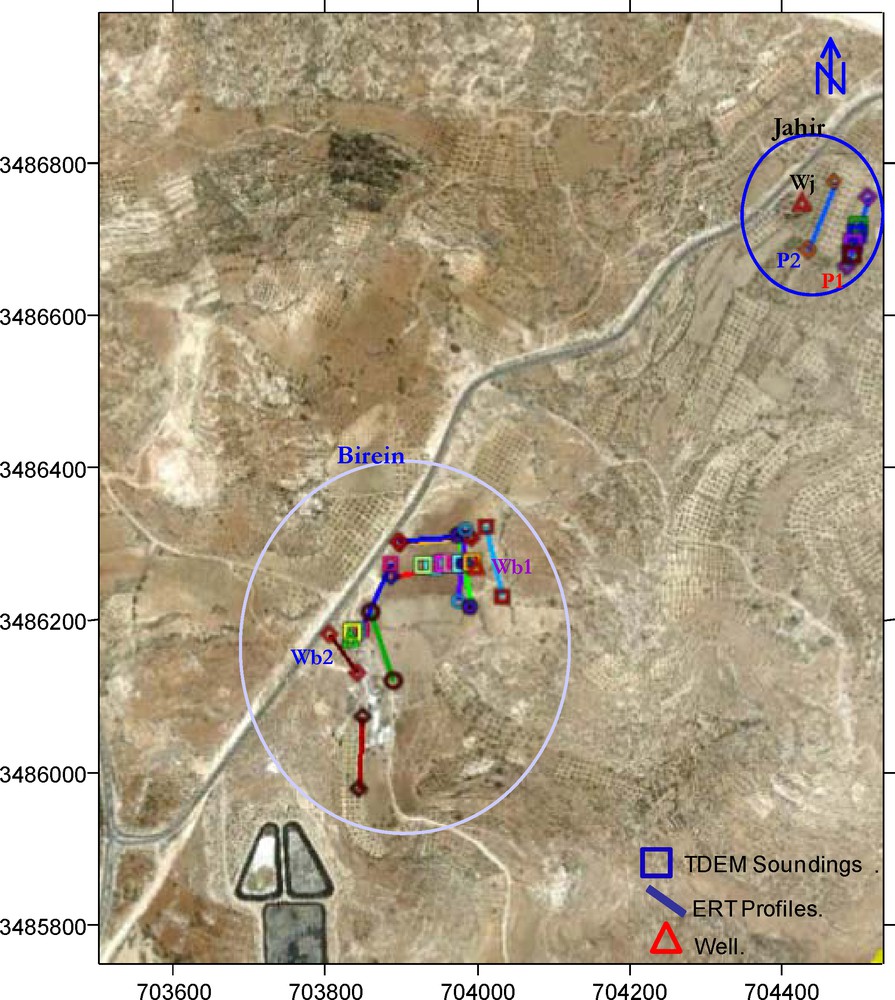
The eastern foothill of West Bank; Jahir and Birein sites.
Côté est de la Cisjordanie ; sites de Jahir et Birein.
4.1 Bani Naim – Jahir
The geological cross-section of the Jahir site shows a large band of limestone, fractured in some places. These permeable formations overlay chalky geological layers that begin to be saturated at depth. ERT line surveys with three-meter inter-electrode spacing, separated by thirty meters, and coincident TDEM soundings were carried out in a NNE–SSW direction to characterize the shallow geological structure at the top of the hill, and to describe the feeding pathway of the water coming to well (Wj) located west of the Jahir site (Fig. 2 -Jahir).
4.1.1 Electrical resistivity tomography
Two parallel profiles 30 m apart with an elevation difference of 3 m and an exploration depth of 18 m were established. The inverted model of P1 (Fig. 3a) shows a highly resistive superficial formation along the survey line with a set of heterogeneous discontinues at different depths; its resistivity varies from 550 to more than 750 Ωm.
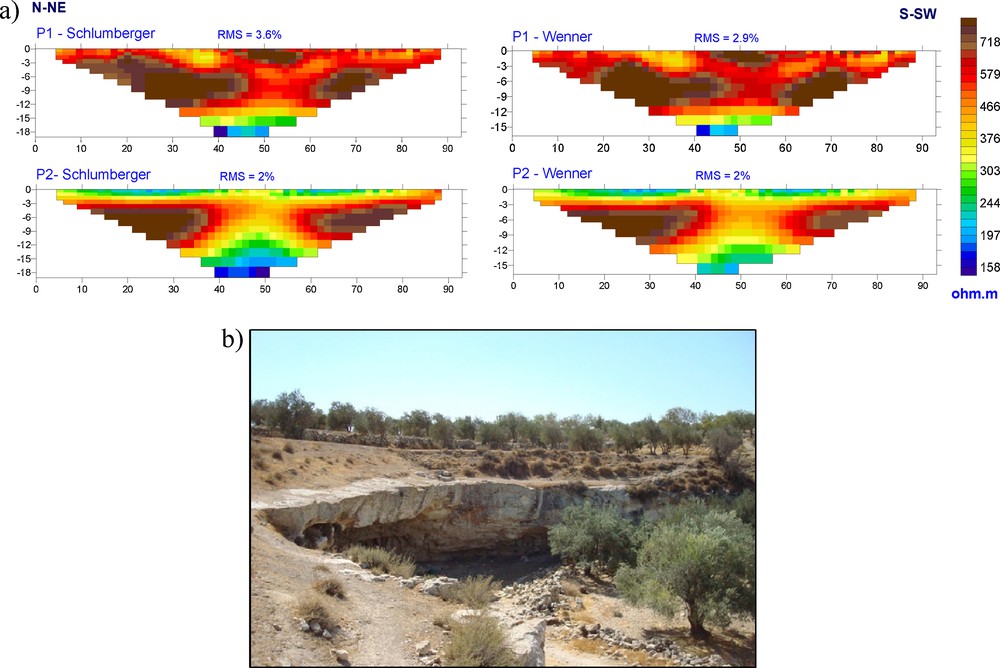
a) Inversion of Schlumberger and Wenner array configurations; b) landscape showing the limestone and chalky geological layers at Jahir location.
a) Inversion simultanée (dispositifs Schlumberger et Wenner ; b) paysage montrant les couches géologiques (calcaire et craie) à Jahir.
This shallow geological formation is divided in the middle of the survey lines by a less resistive formation (400 Ωm) that extends perpendicularly to the line in the NNE–SSW direction. The less resistive part is estimated to be 15 m wide and 9 m thick. At the bottom of the inverted model, a conductive zone in the resistivity range of 150 to 220 Ωm is present. Profile ‘P2’ was conducted thirty meters away from ‘P1’ towards the western valley (Fig. 3a); it shows significant changes in the superficial layer. There are three layers. The first one (250 Ωm) contains multiple discontinuities and is 2.5 m thick; the high resistivity values are deeper than in P1 with two highly resistive features (800 Ωm) in direct correspondence with the line P1 results. They are separated by a 300 Ωm zone (interpreted as chalky limestone). Beneath, a conductive zone, at the bottom, shows a resistivity value of less than 150 Ωm (chalk). The field investigations were carried out during the dry period of September 2008. A field survey revealed a hard limestone layer at the surface of the hill (Fig. 3b); the resistivity decrease toward the valley can be explained by the increase in the thickness of a surface weathered/clay layer.
Highly resistive features (> 800 Ωm) are present in the middle of the two ERT inverted models corresponding to Schlumberger and Wenner configurations. They represent a hard, maximum 9 m thick limestone. In addition, this limestone extends vertically and laterally towards the western side, but it is fractured in the middle and filled by distinctly low-resistivity material. The lower conductive zone, beneath the hard limestone, may be related to the presence of water within the geological formation producing water in the nearby well.
The electrical resistivity decreases towards the foothills from the surface to the bottom for all the inverted models, except in the hard limestone blocks. The resistivity differences make it possible to determine boundaries and interfaces between different geological features, and when the lithological changes have been identified, the local aquifer inside the chalky structures can be identified. We can conclude that the water crosses the unsaturated chalky strip (400 Ωm) that overlays the saturated chalky layer (150 Ωm) which is the aquifer.
4.1.2 Transient electromagnetic
TDEM soundings were positionned over the Jahir ‘P1’ ERT profile (Fig. 3a), the middle of which exhibits the anomaly in the thick limestone layer. The resistivity vs. time graph (Fig. 4) shows a conductive layer between two resistive ones. The different soundings at different locations produce a similar structure revealing a general homogeneity of the zone.
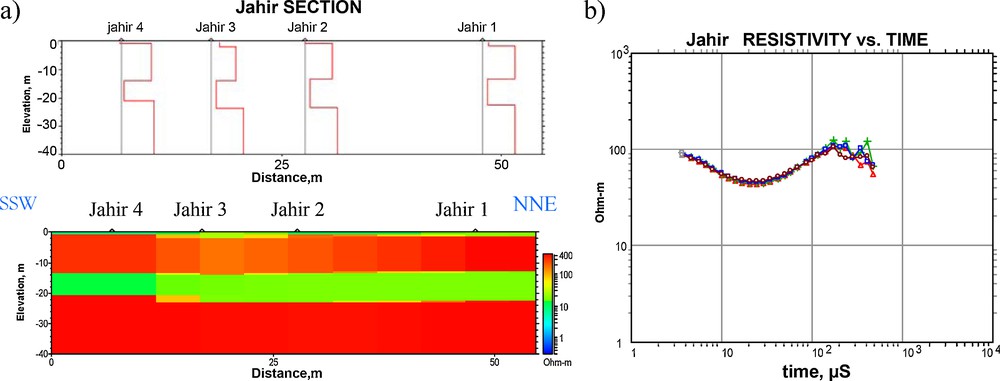
Resistivity vs. time graph, log sounding and TDEM sections at Jahir site.
Graphique de la résistivité en fonction du temps, log de sondage et coupes TDEM sur le site de Jahir.
The lower image on Fig. 4 represents the overall interpretation of TDEM soundings as a tomography section, where the resistivity and thickness of each layer are shown. The moderate resistivity layer found in ERT profiles also appears in the TDEM section. The interpretation resulted in the definition of four geo-electric units. The first unit corresponds to a thin upper layer of clay mixed with fractured limestone deposits whose resistivity values vary from 20 to 150 Ωm. The second unit represents a thick limestone layer with a variety of resistivity values, 200 to 400 Ωm, that reflect the layer heterogeneity. The third layer represents the moderate resistivity layer that contains water and permits water to circulate, while the fourth unit represents the high-resistivity basement.
4.2 Birein site
Birein, a cultivated area gently sloping towards the south-east, was explored by 20 ERT lines and 12 TDEM soundings covering almost all the directions around the two main dug wells (Wb1 and Wb2), see Fig. 5a. Two other ERT lines, PNS and P2WE, were established in the south-western direction at a higher elevation between the crest and the cultivated area. The geological cross-section observed in the east is composed of irregular strips of heterogeneous limestone, chalky limestone, marly sand, and fractured limestone.
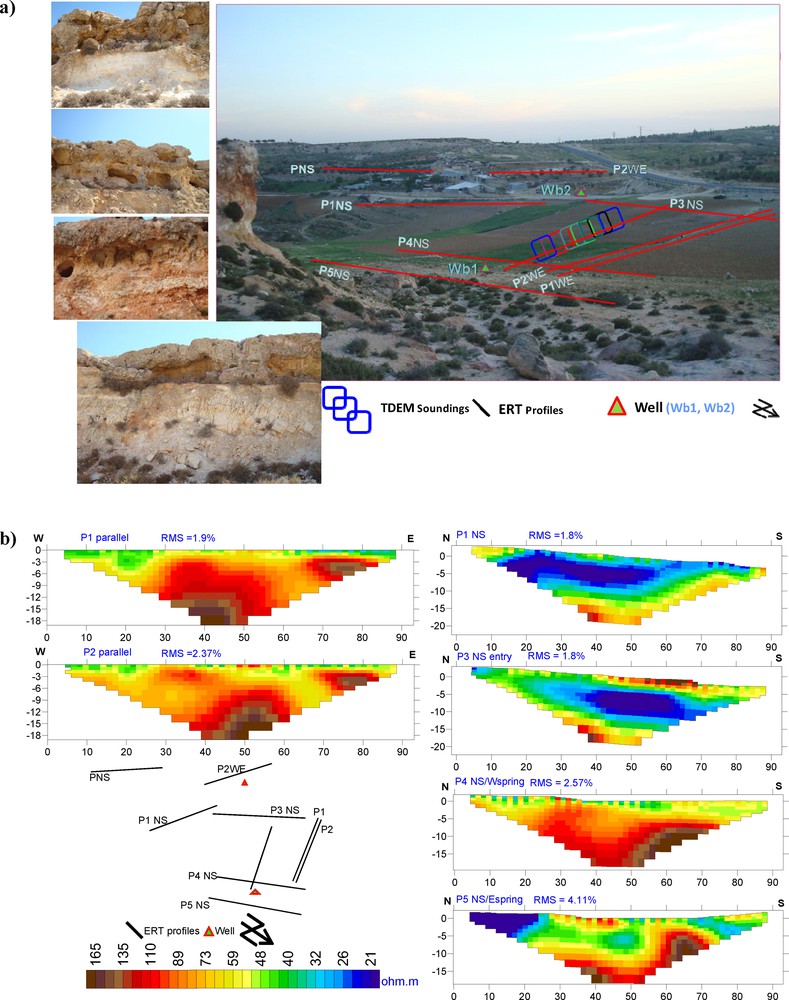
a) Birein zone including geological section; b) ERT inverse models of 6 representative profiles.
a) Zone de Birein incluant la coupe géologique ; b) modèles ERT inversés de 6 profils représentatifs.
The six ERT inverted models are shown in Fig. 5b. Two parallel profiles, 5 m apart, P1 and P2 oriented west-east were positioned near the first dug well (Wb1). On these profiles, the thickness of the conductive layer (Fig. 5) decreases from the west to the east. Below, the cross-section shows more resistive (moderate resistivity around 100 Ω.m) heterogeneous layers starting from a depth of 3 m, and highly resistive bodies (> 200 Ω.m) at the bottom, especially in the east. Significant resistivity contrasts exist between these bodies and the heterogeneous moderate resistivity background. The existence of this complex structure suggests that the zone permits groundwater flow through the moderately-resistive medium from the Jahir site in the north-east, which indeed feeds the monitored dug well (Wb1). The existence of a similar structure but with significant differences in shape between the two parallel profiles supports the hypothesis of a strong subsurface heterogeneity with 3D features of the same hard limestone.
P1NS and P3NS cover the zone along the western side (connecting the north-south and NW-SE directions), where the relief increases in the northwestern direction. Resistivity values indicate that a thick low-resistivity (20–30 Ωm) body at a depth of between 5 and 9 m is covered by a thin upper layer (100–160 Ωm) with a maximum thickness in the middle of the P3NS profile. It overlies a more resistive layer (60–90 Ωm) and its depth and thickness decrease in the southern direction (P1NS). The resistivity variation, which increases from the middle low resistive zone towards the north, indicates the disappearance of this conductive body, replaced by another geological formation (see P3NS). In other words, this feature, interpreted as a clayey layer, starts directly at the surface as shown in P1NS, and is replaced by another geological formation in the south. This low-resistive layer extends along 170 m of the profile.
The following two sections: P4 and P5 were done beside the Wb1 well (north-east direction) with an elevation difference of about 2 m and cover the eastern part of the investigated area, the well (Wb1) being situated at the mid-point between these profiles. When the two profiles are compared, a highly resistive layer is clearly visible at the base of the profiles with higher resistivities in the lower right-hand part: 165 Ωm (southern direction). A lateral extension of the features at the bottom of P4NS, starting at a 10 m depth is demonstrated at the bottom of P5NS, where it starts at a depth of 15 m due to the elevation difference between the positions of the profiles. The low-resistivity layer (30–40 Ωm) located 5 m deep is covered by some discontinuous crushed rock sediments (Fig. 5a). P5NS thus presents a highly conductive feature 20 m wide and 5 m thick on the northern side of the profile. The 6 m deep dug well in the middle of P4NS indicates that water circulates in the layer whose resistivity varies between 80 and 100 Ωm, and that the water comes from the northwest in the heterogeneous layers. P4 shows the existence of a geological layer with a resistivity in the 80 to 110 Ωm range.
A trend of increasing resistivity is identified in the north-west direction correlated with increased weathering beyond which the thick clayey layer acts as a natural barrier, preventing water from circulating towards the lower eastern areas, and permitting it to be present in the Wb2 well.
Fig. 6a and b show the interpreted ERT resistivity section carried out close to an 8 m deep well (Wb2) orientated in the west-east direction as well as the geological cross-sections situated above. The position of this profile was chosen to explain how the Wb2 well is fed and to characterize the upper layer in the west-east oriented geological features of 80 to 500 Ωm. The section shown (Fig. 6b) presents a porous limestone formation and a heterogeneous chalky limestone with different resistivities. The chalky part is porous and sometimes the sandy chalk is soft; it has a resistivity of 80-180 Ωm which has already been identified in several profiles. This layer is present in the bottom layer; it is 5-m wide and contrasts clearly with the surrounding formation. The resistivity values of this massive limestone increase with the progressive tightening of the facies and may reach more than 500 Ωm. This occurs in two resistant areas located on the left and the right in the 5-m depth profile and is also found on the surface on the left profile.
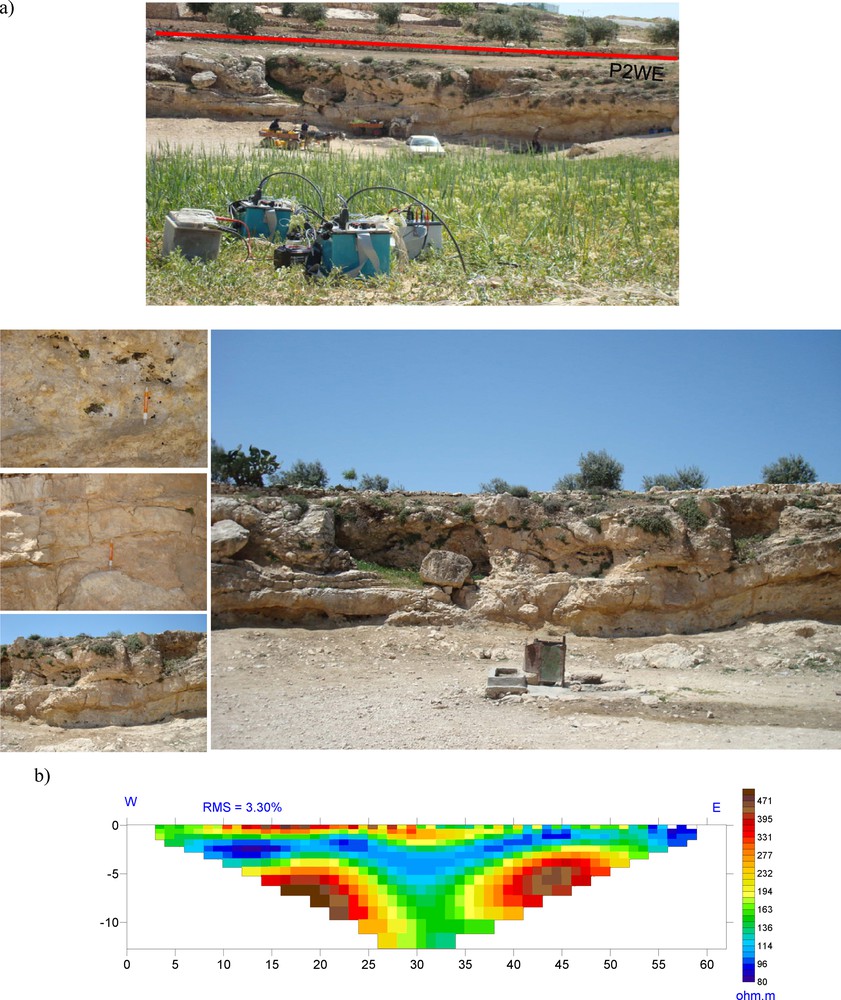
a) Geological cross sections; b) P2WE ERT Inverse model.
a) Coupes géologiques ; b) Modèle ERT inversé de P2WE.
4.2.1 3D representation
The 3D view of the ERT profiles (Fig. 7) shows an overview of the subsurface of the Birein site, revealing the lateral and vertical resistivity distributions in the investigated area. With these techniques, the facies producing water in the wells can be related to the different heterogeneous features, highly impermeable geological formations and fractures (Fig. 5a). Another reliable indication of the homogeneity and anisotropy of the medium is obtained at the two wells Wb1 and Wb2, by showing the parallel and perpendicular profiles (Fig. 5). The heterogeneity of the shallow layers is dominant on the eastern side of the area, while more homogeneous low-resistivity layers are present on the western side. The water storage zones correspond to moderate-resistivity media and their limits are probably defined by the lateral and vertical boundaries of the electrical features.
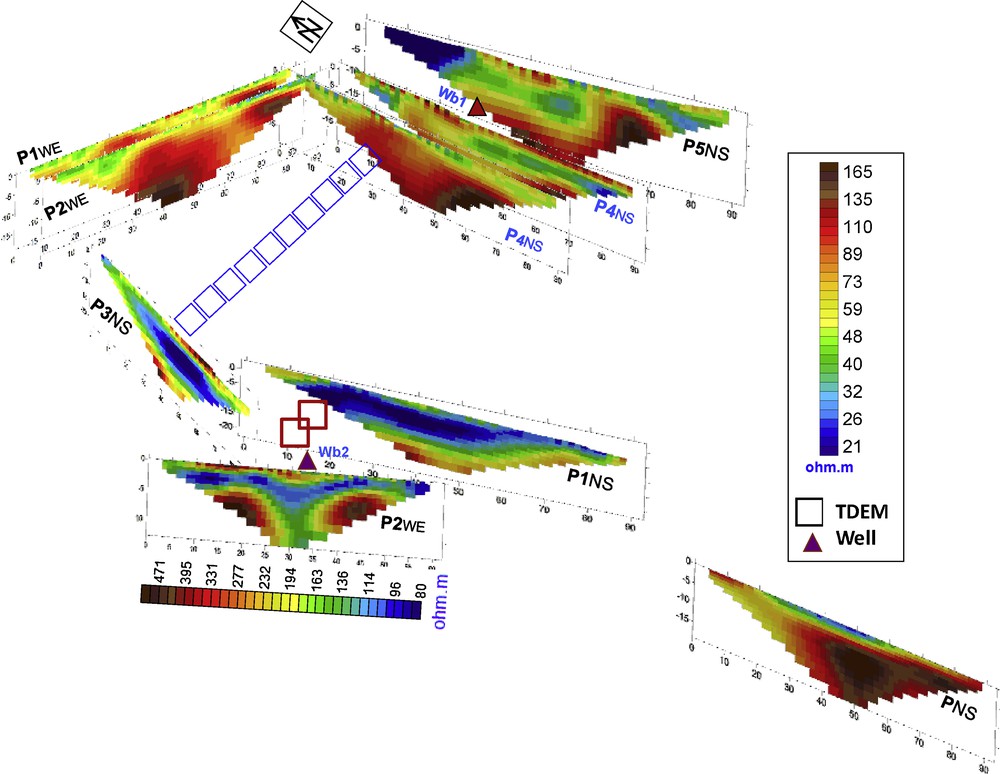
3D representation of Birein site.
Représentation 3D du site Birein.
4.2.2 Seasonal time lapse profiles
At the Birein site, one ERT profile (P4NS) could be repeated at two different seasons, end of summer 2008 and spring 2009. Field measurements collected in summer 2008 show a highly resistive layer with several discontinuities just below the surface, overlaying a second conductive layer followed by another high-resistivity layer at the bottom of the section. In the inverted sections (Fig. 8), this three-layer model has a resistivity ranging from 30 to 200 Ωm. However, the 6-m thick conductive layer (40–60 Ωm) is very clearly marked in the summer and can be interpreted by the presence of mineralized water, while the upper unsaturated layer is dry. In the spring, the resistivity of the second layer increased from 80 to 100 Ωm due to the presence of less mineralized water and the superficial layer became conductive. In the spring, the infiltration of rain water results both in an upper-layer resistivity decrease due to the presence of water in the layer, and a resistivity increase in the second layer. Resistivity values are always higher at the bottom of the section with a more homogeneous high resistivity during the dry summer season. These changes show that water circulates in the first two layers and its salt content changes seasonally. Recall that a productive dug well (8 m deep i.e., the bottom of the second layer) is located in the middle of the profile. The recharge probably occurs by infiltration through the heterogeneous porous chalky limestone, where the water level is higher during the spring than in the summer.
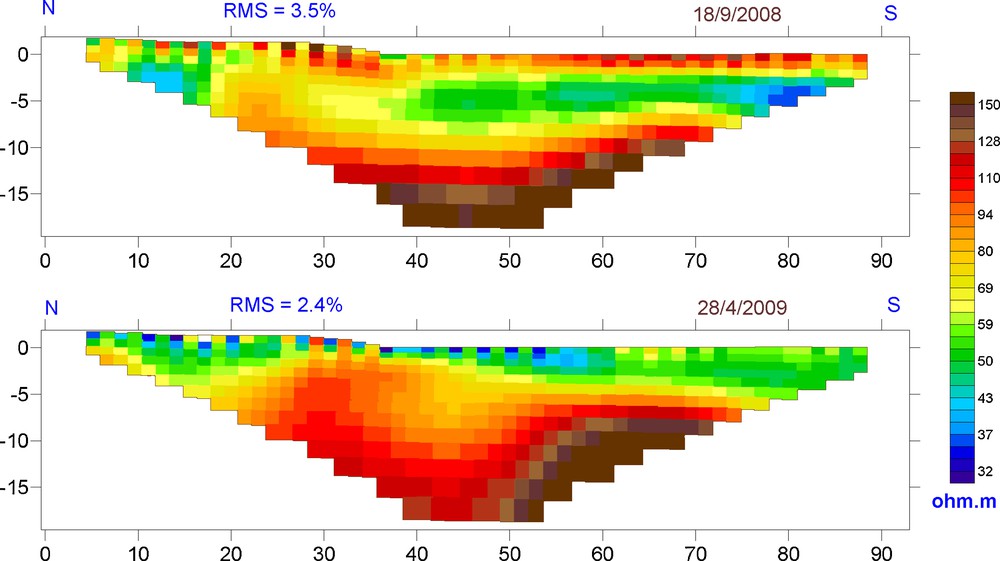
Seasonal time lapse comparison of P4NS profile at Birein site.
Comparaison saisonnière (time lapse) de profil P4NS sur le site à Birein.
5 Discussion
To improve the knowledge of the water resources at the Birein sites, electrical and electromagnetic investigation surveys were made. Due to the geological formation deposition processes and the relief, the resistivity values differ from one location to another, reaching high values at the top of mountains and decreasing in the valleys. Thus, the results from the Birein sites indicate that a trend of resistivity increase is identified in the north-west direction correlated with increasing weathering near the Wb1 well, while the thick clayey layer in the south-west acts as a natural barrier preventing water from circulating towards the lower eastern areas, and permitting it to be present in the Wb2 well.
The data collected with the ERT and TDEM techniques are reliable and correlated, and the interpretation of the resistivity models indicates well-defined geo-electrical layers with significant resistivity differences.
Geo-electrical inverted models show essentially local lithology changes that characterize the local aquifer (lens). The multiple-direction profiles clearly define the characteristics of the different shallow layers producing a 3D view of the Birein site (Fig. 7). In addition, the anisotropy shown by the electrical profiles made in the north-south and east-west directions confirms the possible pathway orientation of water flow in the moderately-resistive chalky layers or through limestone fractures. The profiles of Bani Naim-Jahir (Fig. 3a) show that the water flows first through a fracture zone in the hard impermeable limestone composing the first surface layer and is then stored in the saturated chalky limestone where circulation is possible. This formation is more resistive than the underlying clay which constitutes a barrier stopping water flow but it is more conductive than hard limestone.
RMS error values for the inversion of the ERT are less than 5% for a minimum iteration to achieve an inverted model for the different array configurations. Survey lines were oriented in different direction and sometimes in perpendicular intersection depending on the in situ conditions.
This type of surveying clearly defines the characteristics of the shallow layers in different directions, yielding a 3D view of the investigated areas. In addition, the anisotropy can provide more information regarding the layers.
Due to the nature of the geological formations as a function of the relief, resistivity values differ from one location to another: the values are high at the top of mountains and decrease in the valleys. It is clear that the resistivity values of features located in the eastern foothills (21–180 Ωm and sometimes reaching 450 Ωm) are very significant for this investigation. Because of the semi-arid climate at the two main sites (at Bani Naim), resistivity values of the upper layer differ i.e. higher values are found on the eastern side (> 250 Ωm) of the mountains, confirming its semi-arid characteristics caused by the lack of rainfall. Poor-quality soil types are found in the semi-arid region, which has a great impact on the economic development.
The results, describing various pathways for water to feed the aquifers, are an encouragement to extend the study to other similar areas. A structural map of the geological layers is important when plans are made to exploit a water resource. Such plans allow the regional community councils to realize their economical projects concerning water resources, e.g. improving irrigation systems. Furthermore, sustainable development projects are necessary in this semi-arid region to satisfy the drinking water requirements of the population during droughts.
6 Conclusion
Geo-electrical investigations were used to characterize the shallow geological formations, the location and fate of the groundwater on both sites of the Bani-Naim area (Hebron, West Bank, Palestine), where the geological materials are similar: clay, chalky limestone and hard limestone. The interfaces between geological formations were determined and significant local heterogeneities were identified, indicating the different pathways for water circulation. Water is stored and may seep through the moderately-resistive layers, where the resistivity varies from 40 Ωm, for either superficial (quasi) saturated layers or deeper layers with more mineralized water, to 100 Ωm where the water is less mineralized.
The complementary use of ERT and TDEM for the first time on the semi-arid sites of Bani-Naim provides a comprehensive representation of the resistivity variations in the shallow subsurface; this contributes to characterize the subsurface geological structure and to improve the knowledge of the hydrogeological system which feeds a series of shallow dug wells and small springs. In this study, the results clearly indicate various flow paths for water circulation by identifying permeable pathways through the formations, mapping geological interfaces and thicknesses to provide an explanation of the water circulation in the subsurface. In the case of Bani Naim, the water flows from the west and north towards the east due to the relief effect, while the south shows high resistivity areas due to dry conditions.
A 3D view of the ERT profiles presents an overview regarding the composition of the geological layers (the upper 20 m) especially around the existing dug wells or springs where these techniques indicate the location of heterogeneous features, highly impermeable geological formations and fractures (Jahir and Birein sites). A reliable indication concerning the homogeneity and anisotropy of the medium is found but they are different at the two sites; the heterogeneity of the shallow layers is strong on the eastern side of the Hebron Mountains. One especially significant conclusion emerges concerning water flows within these layers feeding the springs and wells:
- • fractures in the limestone layers (Jahir);
- • heterogeneity of chalky formations and the existence of a clayey impermeable layer (Birein) play a very significant part.
Acknowledgements
For their significant contributions to this study, we wish to thank the members of the applied geophysics group of UMR Sisyphe (Université Pierre-et-Marie-Curie, France) and the Municipality of Bani Naim, Hebron, Palestine. We would like to express our appreciation to all the people who participated in the improvement of this article, in particular Professor Esben Auken (Denmark) and two additional anonymous reviewers of an earlier draft.