


 CC-BY 4.0
1. Introduction
The Ediacaran (∼635–539 Ma) to Silurian (∼444–419 Ma) periods are biologically significant because this approximately 200 Myr time interval witnessed unparalleled animal diversification (R. Wood et al., 2020). The evolution of the Ediacaran biota between 575–539 Ma (Narbonne, 2005) is temporally linked to a period of climate change characterized by the end of the Marinoan Snowball Earth glaciation, which saw a substantial rise in atmospheric oxygen concentrations during the Neoproterozoic Oxygenation Event—NOE (Canfield, 2005; Sahoo, Planavsky, Kendall, et al., 2012), a dramatic rise in seawater levels (Sahoo, Planavsky, Kendall, et al., 2012; Reinhard, Planavsky, Gill, et al., 2017), and increased continental weathering (Frei et al., 2009; Bjerrum and Canfield, 2011). The Ediacaran biota, comprised largely of immobile soft-bodied fossils, declined or disappeared completely ∼539 Ma, and were replaced by diverse morphologically complex multicellular algae and animals during the Ediacaran–Cambrian transition, culminating with the subsequent Cambrian Explosion of ancestral lineages of modern animals at ∼541 to ∼521 Ma (Narbonne, 2005; Butterfield, 2011). Enhanced oxygenic photosynthesis by marine phytoplankton promoted the diversification of zooplankton, fish and other larger animals during the Great Ordovician Biodiversification Event (GOBE) (Edwards et al., 2017). However, it remains unclear what caused the GOBE phytoplankton proliferation.
Existing evidence suggests the ensuing Silurian Period experienced several events associated with more expansive global oxygenation of seawater during the so-called Paleozoic Oxygenation Event—POE (Wallace et al., 2017; Krause et al., 2018), and correlated with rising seawater levels, a wide distribution of low continental landmass, a warm and stable climate, the diversification of fish and large-bodied animals, an abundance of large-size shelly fossils, and evidence for the appearance of the first terrestrial and vascular plants (Dahl et al., 2010; Lenton et al., 2016; Krause et al., 2018). This evolutionary diversification has been widely related to increased oxygenation of the ocean–atmosphere system, especially during the Cambrian Explosion and beyond (Johnston, Poulton, Goldberg, et al., 2012; F. Bowyer et al., 2017; R. Wood et al., 2020). For instance, many Ediacaran rocks containing large and diverse biota were predominantly deposited beneath shallow oxygen-rich waters (F. Bowyer et al., 2017; F. T. Bowyer et al., 2020). Nonetheless, it is debated whether it was oxygen that triggered the rise of these animals or the other way round (Cole et al., 2020).
Pervasive anoxia, characterized by ferruginous conditions and euxinic waters, persisted in some productive Ediacaran deep-sea settings (Canfield, Poulton, et al., 2008; Sahoo, Planavsky, Jiang, et al., 2016), and well into the Cambrian and beyond (Wallace et al., 2017; Krause et al., 2018; Li et al., 2018; Sperling et al., 2021). These deoxygenated waters likely inhibited and delayed the global radiation and biodiversification of aerobic life forms into the available seawater realms. Although the accessibility of bio-limiting nutrients, such as nitrogen (N), has been suggested as significant in regulating biological productivity, the metabolic activity across the Neoproterozoic–Paleozoic interval and their exact influence on the diversification of early marine metazoans remain disputed (Kipp and Stüeken, 2017; Reinhard, Planavsky, Gill, et al., 2017; Cole et al., 2020). Moreover, the scarcity of near-continuous marine sedimentary sequences formed in a single basin across this time interval makes the coherent testing of these hypotheses unachievable.
Nitrogen isotopes have been successfully used for reconstructing the paleoenvironment during the Ediacaran–Cambrian transition and into the Paleozoic (Melchin et al., 2013; Luo et al., 2016; Reinhard, Planavsky, Gill, et al., 2017; Pehr et al., 2018; X. Wang et al., 2018; C. Chang, Hu, et al., 2019; C. Chang, Z. Wang, et al., 2022; Kipp, Algeo, et al., 2020; Y. Liu et al., 2020; Yang et al., 2021). According to Algeo, Meyers, et al. (2014), climatic rather than redox fluctuations would have driven the long-term nitrogen dynamics in the Phanerozoic. However, the redox state of the Paleozoic oceans was likely not stable compared to those of the Mesozoic and Cenozoic eras, which would have disrupted the nitrogen cycle (Stüeken, Kipp, et al., 2016). Therefore, the influence of climate- and redox-driven variations on nitrogen cycling in the Paleozoic is yet to be determined. For example, the Ordovician–Silurian transition is thought to be globally marked by protracted nitrogen limitation resulting from quantitative denitrification (reduction of nitrate to dinitrogen) in successive icehouse and greenhouse intervals (Y. Liu et al., 2020; Yang et al., 2021; Melchin et al., 2013). Notably, the deep oceans in the Ordovician–Silurian transition may have been severely depleted in fixed nitrogen compounds, while the surface ocean remained oxygenated (Michel et al., 2013). Complex relationships among climate, eustasy, and redox changes have therefore been inferred to explain the nitrogen patterns during the first of the “Five Big” Phanerozoic extinction events (end-Ordovician).
Here we show dynamic interplays between eustacy, nitrogen bioavailability, and the evolution of complex life across the Late Neoproterozoic–Paleozoic transition when the first ancestral forms of modern animals first appeared. We report on a rare but near-continuous Ediacaran to Silurian marine sedimentary package in the Podolia Basin in southwestern Ukraine (Figure 1). Biological and lithological change across the sedimentary sequence correlate well with sea-level fluctuations and the sequence is biostratigraphically distinguished by the exceptional preservation of representative Ediacaran to Silurian animal fossils (Figures 2 and 3). The lower series contains a unique Ediacaran fossil assemblage composed of Podolimirus, Dickinsonia, Kimberella, Aspidella-type holdfasts “Cyclomedusa plana”, Shaanxilithes, Intrites punctatus, Nemiana simplex (Ivantsov et al., 2015), Hiemalora stellarsis, Astropolichnus sf. Hispanicus, Charniodiscus, procerus, Finkoella ukrainica, Harlaniella podolica, and Conomedusites lobatus, (Figure 3a–c, Figure S1). The Ediacaran–Cambrian transition is represented by Vendotaenia antiqua (Tyrasotaenia podolica) (Figure 3d) and Treptichnus pedum (Figure 3e), while abundant Ordovician–Silurian macrofossils include crinoidea, tetracoralla, corals, bryozoan, brachiopods, gastropods, trilobites, Eurypterus, orthoceras, and trace fossils (Nikiforova et al., 1972) (Figure 3f–j). Previous studies in the Podolia Basin have largely focused on sedimentology and biostratigraphy, with limited geochemical constraints on nutrient cycling and redox conditions across the Ediacaran–Silurian interval. Here, we present a new, high-resolution multiproxy dataset—combining bulk δ15N, carbon isotopes, TOC, and whole-rock geochemistry—that enables a more detailed reconstruction of nitrogen cycling dynamics and their linkage to ocean redox evolution and biodiversification events. This integrated geochemical approach has not previously been applied in this basin across this timespan, offering new insights into the nutrient constraints that may have influenced early animal ecosystems.
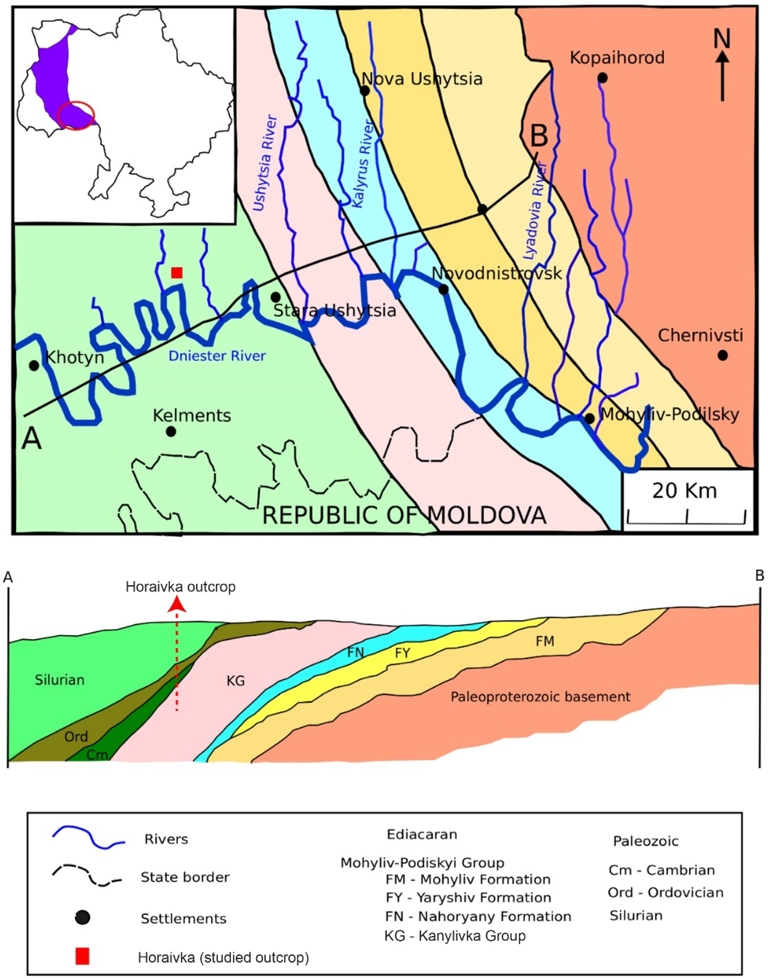
Location and geological map of the Podolia Basin. (A) Geological map showing the position of the studied outcrops in the Podolia Basin. Inset—location of the Podolia Basin in the southwestern part of the East European Craton and the western flank of the Archean Ukrainian Shield. (B) Geological cross-section showing the lithostratigraphic divisions across the studied area (modified after Soldatenko et al., 2019).
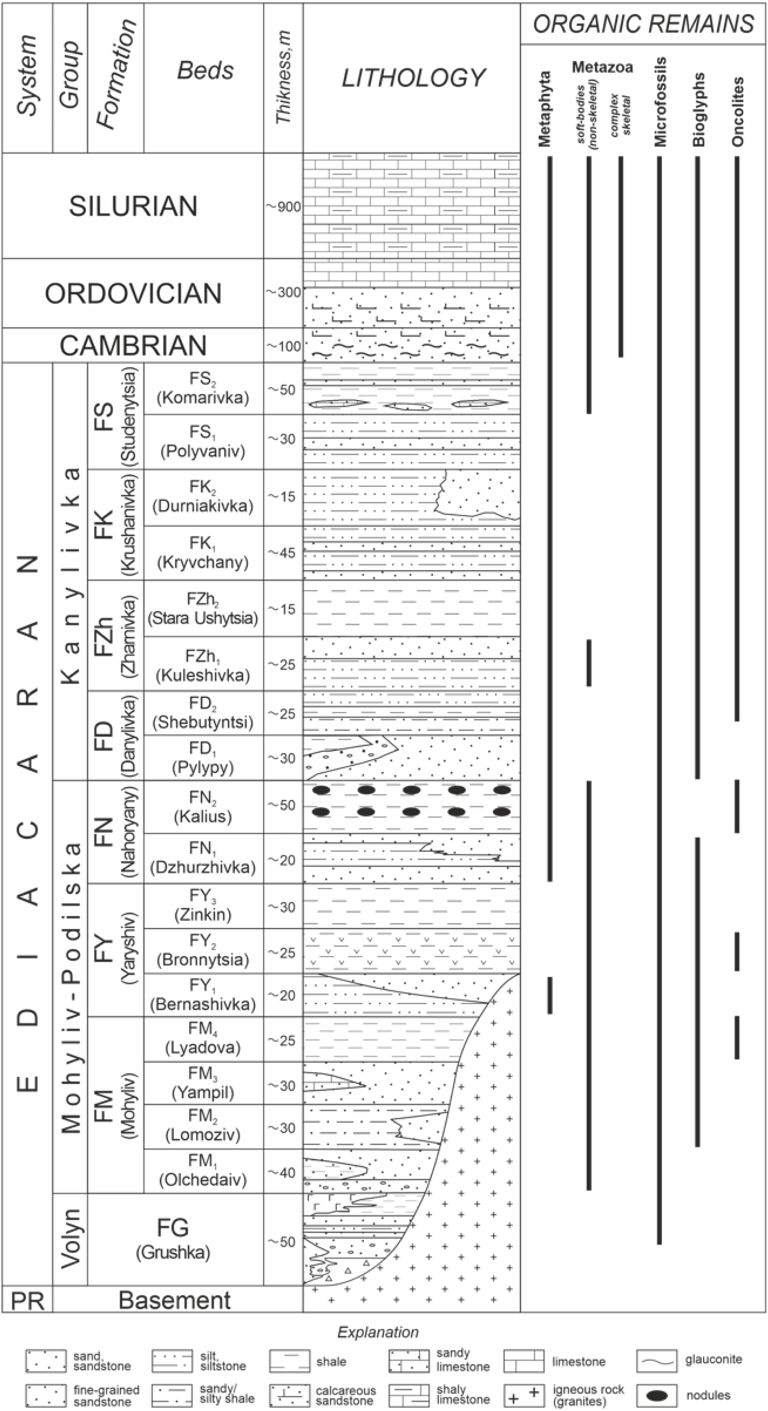
Lithostratigraphy of the Podolia Basin (modified after Ivantsov et al., 2015). PR—Precambrian; F—Formation.
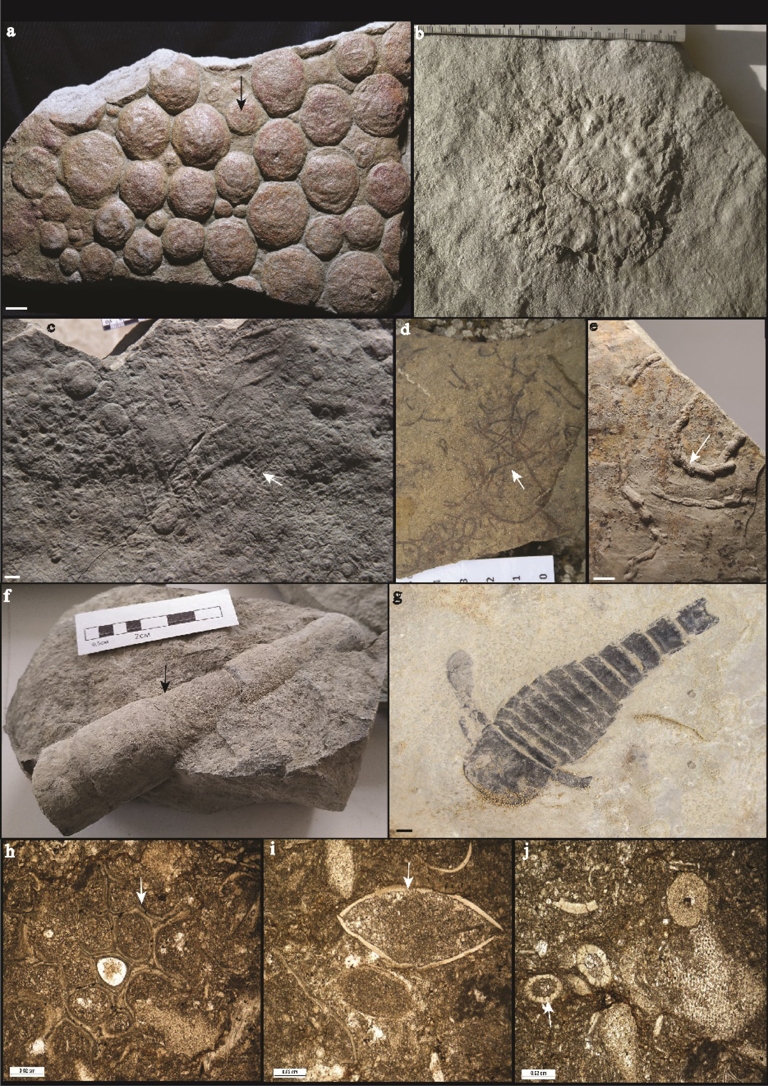
Microphotographs of biota distributed across the Ediacaran to Silurian succession: (a) Colony of Nemiana simplex embedded in the Ediacaran sandstone. (b) Eoporpita medusa. (c) Arborea arborea. (d) Vendotaenia at the Ediacaran–Cambrian Transition. (e) Cambrian burrowing animals, Treptichnus pedum. (f) Ordovician Orthoceras. (g) Silurian Eurypterus. (h) Silurian coral embedded within mudstone matrix. (i) Complete shells of Silurian brachiopods. (j) Silurian echinoderms. Scale bars are 1 cm.
2. Geological background
The Podolia Basin, a part of the extensive Volyn-Podolia-Moldavia Basin (VPMB), developed along the passive northeastern margin of the East European Craton (EEC; also called Baltica) and the western flank of the Archean Ukrainian Shield (Figure 1) (Shulga et al., 2007; Środoń et al., 2013; Poprawa et al., 2018). Paleogeographic reconstructions and sedimentological studies show that the Ediacaran and Paleozoic sedimentary successions consist of unmetamorphosed mixed volcano-siliciclastic and carbonate continental shelf facies deposited during sea-level fluctuations that at times flooded the continent and led to an epi-continental sea (Poprawa et al., 2018). Sedimentation on the Archean-Proterozoic crystalline basement rocks along the proximal margin of the Ukrainian Shield started during tectonic extension of the ECC in the Ediacaran and continued to the Paleozoic (ibid.). Variations in lithofacies, fossil diversity, and surface boundaries have been used to establish the lithostratigraphy of the Ediacaran to Silurian strata in the Podolia Basin (Figure 2) (Velikanov et al., 1983; Shulga et al., 2007).
The development of the VPMB began with rifting and rapid subsidence that led to the emplacement of volcanoclastic sediments, the Volynska Group (VG), which is predominantly composed of mainly basaltic lavas and pyroclasts during the Ediacaran (Poprawa et al., 2018). Further extension and subsidence resulted in the deposition of terrigenous materials comprising a dominantly coarse-grained conglomeratic sandstone in the lower part and alternating shale-siltstone in the upper section, reflecting an upward fining and deepening sequence as sedimentation decreased during the Ediacaran (ibid.). However, smaller scale cycles of upward coarsening and shallowing are also observed within the shale-siltstone-dominated upper part due to fluctuating sea level during deposition. The terrigenous Ediacaran sediments are further divided into the Mohyliv–Podilskyi and Kanilivska groups (Figures 1 and 2) (Velikanov et al., 1983; Ivantsov et al., 2015; Poprawa et al., 2018). The Mohyliv–Podilskyi Group consists of a thin conglomeratic sandstone bed that grades into alternating fine-grained sandstones interbedded with clayey sandstones, silty shales, thin bentonite beds, and phosphatic nodules towards the top. The overlying Kanilivska Group comprises fossiliferous shaly siltstones interbedded with thin beds of fine-grained sandstones, mudstones, and lenticular shaly limestone in the uppermost section. The minimum age of the Ediacaran strata in the Mohyliv–Podilskyi Group is constrained by U–Pb zircon dating of the interlayered tuff and thin bentonite beds to late Ediacaran, ∼553 Ma (Grazhdankin et al., 2011) and 556.78 ± 0.1 Ma (Soldatenko et al., 2019).
Tectonic subsidence significantly diminished during the Cambrian and Ordovician when the basin was interpreted to be relatively stable and passive with a low sedimentation rate (Poprawa et al., 2018). The greenish glauconitic calcareous Cambrian sandstones unconformably overlie the Ediacaran strata with distinct levels of interlayered greenish mudstones rich in apatite (phosphatic horizons). These sediments contain acritarchs and macroalgae related to Tyrasotenia podolica and Vendotenia antiqua, bioglyphs, and skeletal fauna like Sabelliditids (Figure 3d,e) (Velikanov et al., 1983). The lower and middle Ordovician strata have been eroded in the basin (Shulga et al., 2007), and the locally preserved ∼1.5 m thick upper Ordovician sediments consist of thin clayey calcareous fine-grained sandstones and shales that gradually shift to marly limestones at the top (Radkovets, 2015; Poprawa et al., 2018). These sediments contain macrofossils such as brachiopods, gastropods, trilobites, and Orthoceras (Figure 3f,g).
Again, sedimentation was truncated at the end of Ordovician due to an intense uplift and erosion of the southwestern margin of EEC during a global regression and glaciation (Radkovets, 2015). The Silurian flexural bending of the craton margin resulted in a rapid increase of subsiding conditions and subsequently deposition of clayey limestones and marlstones directly on the eroded Ordovician–early Silurian (Llandovery Series) sediments (Radkovets, 2015; Poprawa et al., 2018). Sedimentation of carbonate-rich sediments of various Silurian ages (Wenlock, Ludlow and Pridoli series) became more pronounced in the shallow water shelf (lagoon and reef; <100 m depth) to open shelf environments during fluctuating transgression–regression cycles (Radkovets, 2015; Poprawa et al., 2018). These sediments preserve abundant and diverse macroscopic fossils such as crinoidea, tetracoralla, corals, bryozoan, and trace fossils (Figure 3h–j).
Samples were collected from an outcrop we designated as “Horaivka,” named after the nearby village located in the southern Ukrainian Shield (Figure 1). The section encompasses a range of lithologies spanning from the Ediacaran (Kalinivsca Group, Studenytsia formation) to the Silurian. The transition between the Ediacaran and Cambrian intervals in the studied section is marked by an apparent greenish silty fine-grained sandstone at the base of the Cambrian unit. The Ordovician and Lower Silurian sediments are highly condensed and/or eroded in the studied section.
3. Materials and methods
3.1. Sampling and sample preparation
A total of 58 samples were collected from formations of different ages: 14 from the Silurian, 5 from the Ordovician, 6 from the Cambrian, and 33 from the Ediacaran. The samples were powdered using an agate mortar for subsequent geochemical analyses and mineralogical characterisation by X-ray diffraction (XRD).
3.2. Petrography and mineralogy
Polished thin sections were prepared for representative samples and examined under a polarized Nikon Eclipse E-600 optical microscope at the University of Poitiers. The thin sections were carbon-coated and studied using a JEOL scanning electron microscope (SEM) equipped with energy dispersive X-ray (EDX) for detailed textural mineral relationships and point-chemical composition analysis in backscattered electron (BSE) mode. X-ray diffraction (XRD) analysis of bulk rock and clay fractions were performed with a Bruker D8 ADVANCE diffractometer using CuKα radiation operating at 40 mA and 40 kV. For bulk mineral composition, samples were gently powdered in an agate mortar and analyzed between 2 and 65° 2𝜃 angular range and step size of 0.025/s. The <2 μm, <1 μm, and <0.5 μm clay-size fractions were separated from the bulk materials after carbonate dissolution in acetic acid and removal of organic matter with hydrogen peroxide, by centrifugation. The extracted suspensions were saturated with Ca for uniform cation exchange and repeatedly rinsed with deionized water a minimum of three times and centrifuged to remove free ions (Moore and Reynolds Jr., 1997). The clay fractions were pipetted on glass slides and dried at room temperature. The oriented slides were analyzed in air-dried (AD) and after ethylene glycol (EG) treatment at a step size of 0.01/s from 2 to 35° 2𝜃 angular range. The clay minerals were distinguished using their basal 00l characteristic peaks (ibid.). Semi-quantification of the mineral components was determined using area ratios of the principal mineral peaks in decomposed bulk powder and EG treated XRD patterns (Hiller, 2003). The XRD patterns were decomposed using the FYTIK software and the mixed-layer clay minerals modelled with the NEWMOD software (Reynolds Jr., 1985).
3.3. Whole rock geochemistry
The bulk major and trace element concentrations of 58 selected samples (Tables S1–S3) were measured with inductively coupled plasma atomic emission spectrometry (ICP-AES) and inductively coupled plasma mass spectrometry (ICP-MS), respectively, according to Carignan et al. (2001). About 100 mg powdered samples were decomposed by alkali fusion and fused with 900 mg of ultra-pure lithium metaborate (LiBO2) at 980 °C to form a glass. The glass was then digested in a mixture of 1M nitric acid, 0.5% hydrogen peroxide, and 10% glycerol for elemental analyses at the Service d’Analyse des Roches et des Minéraux (SARM; CRPG-CNRS), Nancy, France. The uncertainty for most major elements was better than 5%, 10% for Ca, >25% for P, lower than 5% for trace element concentrations >10 ppm, 15% for concentrations between 1 and 10 ppm, and 25% for elemental concentrations near the detection limits, when compared with international standards and analysis of replicate samples (ibid.).
The weathering intensity was determined using the chemical index of alteration (CIA = [Al2O3/(Al2O3 + CaO∗ + Na2O + K2O)] × 100 in molar ratios), where CaO∗ is the amount in the silicate fraction, to monitor the nature and weathering intensity of the detrital fluxes into the basin (Nesbitt and Young, 1984). Varying proportions of CaO-bearing phases in sedimentary rocks composed of carbonate and phosphate minerals falsify CIA values that are reliant on the fine-grained siliciclastic component of sediments for applicability. CaO is first corrected for that residing in apatite using P2O5 data (CaO′ = CaO − 10/3 × P2O5). CaO′ in silicates of our samples is assumed with CaO∗ = CaO′ when the mole fraction of CaO′ is ⩽Na2O and CaO∗ = Na2O when the mole fraction of CaO′ is ⩾Na2O (McLennan et al., 1993; Jian et al., 2013; Johnston, Poulton, Tosca, et al., 2013). Typically, highly weathered rocks in hot and humid climatic conditions have high CIA values (>80), moderately weathered rocks in wet and humid climate have values between 60 and 80, whereas lower CIA values (<60) indicate unweathered to weak chemical weathering in cold and dry climate (Nesbitt and Young, 1984; Fedo et al., 1995).
To assess whether certain elements were enriched or depleted due to authigenic processes, we calculated enrichment factors (EFs) relative to the average composition of the upper continental crust (UCC), following the approach of Tribovillard, Algeo, Lyons, et al. (2006). The EF for an element X in siliciclastic sediments was determined using the formula:
However, interpreting EF values in carbonate-dominated sediments is more complex due to their typically low aluminium content, which can lead to inflated EF values when compared to siliciclastic rocks. To address this issue, we also applied the concept of elemental excess (Krewer et al., 2024), calculated as:
3.4. Carbon and nitrogen isotopes
Total organic carbon (TOC), total nitrogen (TN), and stable isotopes of organic carbon (δ13Corg) and bulk rock nitrogen (δ15Nbulk) were analyzed for 47 representative samples spanning the Ediacaran to Silurian (Table S4). About 300 mg of sample powders were treated with 6 N HCl for ∼1 h at 70 °C to remove carbonate minerals. The insoluble residues were centrifuged and repeatedly rinsed with deionized water until the supernatants achieved a neutral pH and dried in a clean hood overnight. Small aliquots of the de-carbonated powdered samples were weighed and sealed in tin capsules for isotopic analyses with a blank placed between each measurement. The isotope data were measured by flash combustion using a Thermo Scientific DELTA V Advantage isotope ratio mass spectrometer (IRMS), operated under a continuous helium flow mode, and coupled with a Thermo Scientific Flash 2000 elemental analyzer at Laboratoire Géosciences Océan, University of Brest, France. Certified standards USGS40 (δ13Corg = −26.2‰, Corg = 40.82 wt% and δ15Nbulk = −4.5‰, N = 9.52 wt%) and caffeine IAEA-600 (δ13Corg = −27.77‰, and δ15Nbulk = 1‰) were used for the calibration. The obtained data were reported in the delta (δ) notation in part per mil (‰) deviation relative to the Vienna Pee Dee Belemnite (VPDB) for carbon (δ13Corg) and atmospheric N2 for nitrogen (δ15Nbulk). The TOC and TN concentrations were calculated from peak areas of CO2 and N2, respectively. We only report δ15Nbulk values of samples with TN concentrations well above the detection limits.
4. Results
4.1. Lithology and mineralogy
Light microscopy and XRD mineralogical data show that the Ediacaran to Silurian sediments are composed mainly of quartz and calcite with trace amounts of dolomite, ankerite, clay minerals, K-feldspar, albite, with accessory apatite restricted to the Cambrian samples (Figure 4). The bulk mineralogy of the siliciclastic Ediacaran and Cambrian samples is dominated by 87–95% quartz, while the carbonate minerals, composed of up to 90% calcite, dominate the upper calcareous Ordovician shales and Silurian limestones. The clay mineral and feldspar abundances are higher in the Ediacaran than the Cambrian siliciclastic samples, decreasing from ∼10% to 0.5%. The greenish glauconitic sandstones, common in some intervals of the Cambrian, contain moderately sorted, sub-angular to angular quartz, while the glauconitic siltstones and shales consist mainly of fine-grained quartz in a clay-dominated matrix (Figure 5a,b). Glauconite is identified by their greenish to yellowish color, filling pores associated with apatite in the lowermost “verdine facies”, while that in the middle and upper levels are pale green to yellowish-brown cement in association with carbonate minerals or replacing granular grains. EDS analysis reveals that the grain-replacing and pore-filling greenish glauconite minerals in the Cambrian sediments have heterogeneous octahedral compositions of glauconite–berthiérine/chamosite endmembers of chlorite (Figure 5c,d). The Ordovician sandstones are composed of fine to medium, sub-angular quartz grains dispersed in calcite-dominated matrix.
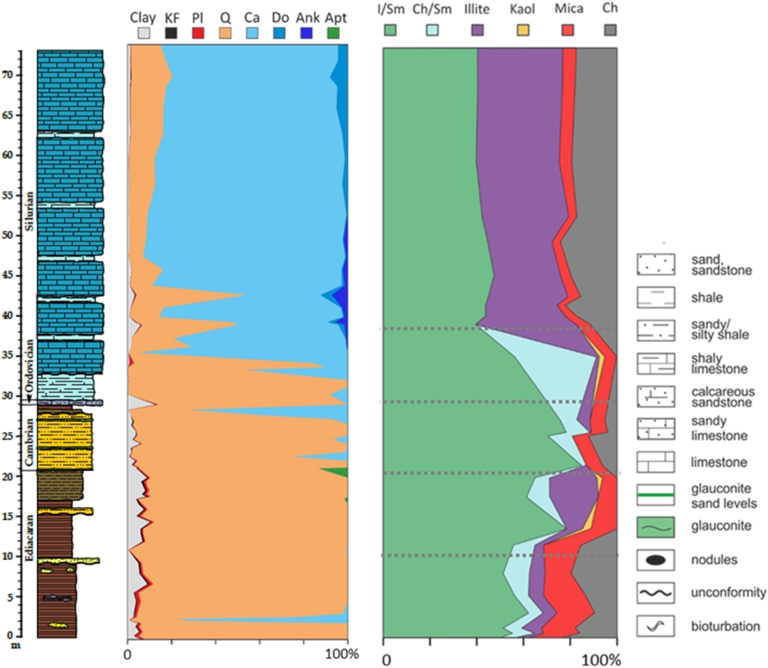
Mineral composition and relative abundances of the bulk and <2 μm clay-size fractions through the studied stratigraphic section. KF: K-feldspar; Pl: plagioclase; Q: quartz; Ca: calcite; Do: dolomite; Ank: ankerite; Apt: apatite; I/Sm: illite–smectite; Ch/Sm: chlorite/smectite; Kaol: kaolinite; Ch: chlorite. Legend of the lithology is presented in Figure 6.
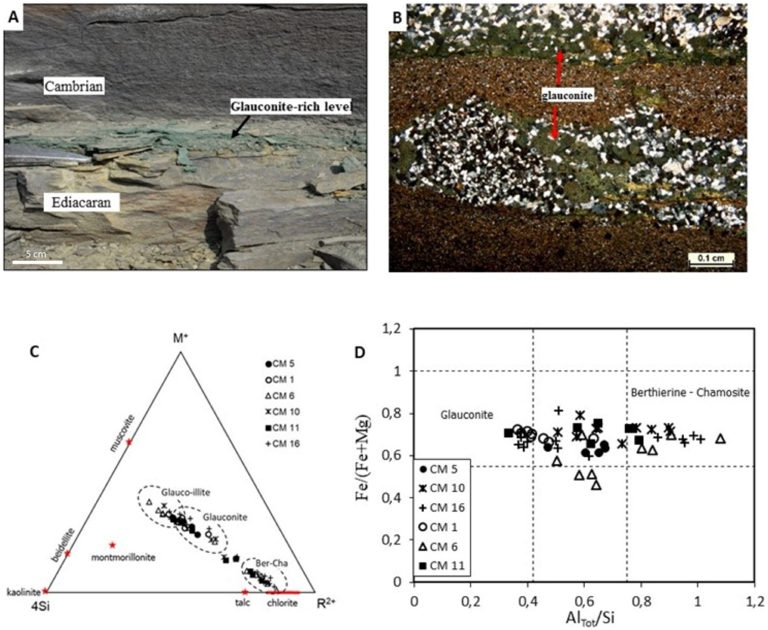
(A) Photograph of the Ediacaran–Cambrian boundary. (B) Photomicrographs of pore and matrix filling amorphous glauconite minerals in Cambrian silty fine-grained sandstone. (C) Chemographic projection of the chemical composition of the glauconite minerals in the Cambrian sediments on the M+–4Si–R2+ ternary diagram after Meunier and Velde (2004). (D) Plot of Fe/(Fe+Mg) versus AlTot/Si of the glauconite minerals in the Cambrian verdine facies.
XRD analysis of the separated <2 μm fractions provides the detailed mineralogy of the clay minerals (Figure S2). The clay mineral assemblage includes chlorite, illite, and illite–smectite (I/S) mixed layer minerals (MLMs) throughout the section, while kaolinite and chlorite–smectite (Ch/S) MLMs are absent in the Silurian deposits. Chamosite is identified in all samples by basal 00l characteristic peaks at ∼14.2, 7.1, 4.71, and 3.54 Å in AD and unaffected in EG state. Illite is defined in all the samples by the ∼10, 5.0, and 3.3 Å peaks in AD samples, but remained relatively unchanged in the EG state. Kaolinite, present only in a few upper Ediacaran and Ordovician samples, is defined by the ∼7.13 and 3.57 Å peaks. Decomposition of the broad and asymmetry peaks between 4 and 14° 2𝜃 in EG patterns revealed Ch/S and I/S MLMs. I/S MLMs are present in all samples with a relatively decreasing abundance up-section; Ch/S MLMs have varying abundance and are absent in the Silurian samples. The bulk and clay mineral assemblages across the studied section show that mineral distribution and abundance are lithology dependent (Figure 2).
The most pronounced distinction through the section is the authigenic glauconite and apatite minerals in the interlayered Cambrian verdine sediments. Authigenic green clay consists of a wide range of chemical and mineralogical compositions, including glauconite, berthierine, glauconite–smectite, and berthierine–smectite (Odin and Matter, 1981; Meunier and El Albani, 2007; Velde, 2014). The precipitation of authigenic glauconite has the potential to trace the redox conditions and chemistry of the depositional environments because these minerals typically form at shallow depths during diagenesis (Odin and Matter, 1981; Velde, 2014; Banerjee et al., 2016; Bansal et al., 2018). Authigenic glauconite typically formed under pore water suboxic (mildly reducing and low organic matter) conditions below the seafloor in shallow water continental shelves, where both Fe2+ and Fe3+ are simultaneously available. By contrast, berthierine, owing to the predominance of Fe2+, precipitates in suboxic to anoxic pore waters (with high organic matter) near river deltas in shallower waters relative to glauconite (Meunier and El Albani, 2007; Bansal et al., 2018; Algabri et al., 2020). The occurrence of glauconite and berthierine/chamosite minerals primarily in interstitial pore spaces of the studied Cambrian samples demonstrate their authigenic origin. The dissolution of detrital mineral grains (Figure 5c,d), availability of cations (K, Fe, Mg, and Al) during diagenesis, and change in conditions of formations (Meunier and El Albani, 2007; Velde, 2014; Tang et al., 2017) likely controls their heterogeneous chemical compositions. Interestingly, the presence of glauconite and berthierine in the interbedded verdine facies of the Podolia Basin during the Cambrian is consistent with the global occurrence of glauconite at the Ediacaran–Cambrian boundary from ∼550 Myr onward (Baldermann et al., 2022).
4.2. Whole rock elemental geochemistry
The concentrations of major elements mainly reflect lithofacies variation, with detrital tracers like SiO2, Al2O3, and TiO2 being comparatively more abundant in the siliciclastic sandstone and shale samples compared to the carbonates (Table S1). Al2O3 has a strong positive correlation with SiO2 in the Silurian carbonate-rich rocks but a negative correlation in the siliciclastic-rich Ediacaran to Cambrian samples (Figure S3). The moderate to strong positive covariations of TiO2, K2O, Fe2O3, and MgO with Al2O3 (Figure S3b–e) in the siliciclastic and carbonate samples are also consistent with the prevalence of aluminosilicate minerals, including clays and feldspars, coupled with significant detrital flux to the basin. The higher Fe concentrations in the Cambrian rocks coincide with the enrichment of the authigenic Fe-rich glauconite/berthiérine. Consistent with XRD mineralogical analysis, CaO content is significantly higher in the carbonate-rich Silurian and Ordovician rocks than the siliciclastic Ediacaran–Cambrian samples (Figure S3f). MnO and P2O5 contents are generally low through the section, except in a few interbedded Cambrian phosphate horizons with considerably higher concentrations of P2O5 (Table S1). The lack of an obvious relationship between CaO, MnO, and P2O5 with Al2O3 (Figure S3f–h), indicates an authigenic and/or a primary chemical weathering origin.
The concentrations of the incompatible high field strength elements (HFSE—Zr, Hf, Ta, Nb, and Th) and compatible transition trace elements (e.g., Sc and Cr) are significantly higher in the siliciclastic-dominated than the carbonate-rich rocks (Table S2). Excluding a few outliers, the strong positive covariations of Th, Sc, and Cr with Al (Figure S4a–c) show that they are dominantly hosted by the detrital aluminosilicate minerals. The lack of a relationship between Zr and Al2O3, except in Silurian carbonates, hints that Zr is hosted in detrital zircon grains (Figure S4d). The concentrations of redox-sensitive trace elements (RSTE—e.g., Mo, U, V, Ni, Cu, and Zn) are generally low across the studied section (Table S2). The RSTEs and total REE (REET) exhibit moderate positive correlations with Al except Mo (Figure S5), suggesting a strong detrital influence on their distributions in the sediments. Mo is constant in all the samples, except in the Silurian and Cambrian. The PAAS-normalized REE + Y (REYN) patterns in most samples are relatively flat (Figure S6), suggesting negligible fractionation and further support dominant terrigenous inputs (McLennan et al., 1993). A few samples, along the studied section, have dome-shaped patterns with depletion of LREE and HREE relative to middle REE (MREE: Sm-Dy), indicating preferential enrichment of MREE by authigenic phosphate minerals (Shields and Stille, 2001). The enrichment of the MREE in the glauconitic Cambrian sediments could have resulted from recrystallisation during diagenetic alteration or uptake from sub-oxic to anoxic pore water during the formation of the glauconite assemblage (Meunier and El Albani, 2007).
Negative Ce anomalies are generally lacking in the REE spider profiles, with a weak but persistent signal observed in the Silurian deposit. Nearly all the samples show suprachondritic Y/Ho ratios ranging from 25.0 to 28.7 with a mean of 26.8 ± 1.1 in the Ediacaran and Cambrian, before increasing to values ranging between from 26.4 and towards stronger seawater ratios of 35.2 that have a mean of 30.2 ± 2.4 in the Ordovician and Silurian rocks.
4.3. Carbon and nitrogen isotopes
The TOC and TN contents show similar stratigraphic trends with values ranging from 0.02 to 0.86 wt% and averaging 0.25 ± 0.21 wt% for TOC and 0.01 to 0.1 wt% with a mean of 0.04 ± 0.02 wt% for TN (Figure 6; Table S4). In the Ediacaran, δ13Corg varies from −31.9‰ to −26.5‰ with a mean of −28.7 ± 1.2‰ and corresponding δ15Nbulk values between +1.8 and +5.4‰, averaging +4.3 ± 1.0‰. The Cambrian δ13Corg values show a narrower range of −28.9‰ to −27.6‰, with an average of −28.2 ± 0.5‰ similar to the Ediacaran. Likewise, the corresponding Cambrian δ15Nbulk values range from +3.7 to +5.2‰ with an average of +4.5 ± 0.7‰, remaining close to the Ediacaran δ15Nbulk values. The Ordovician unit is characterized by δ13Corg values similar to the Ediacaran and Cambrian periods, varying between −30.2‰ and −27.9‰ and a mean of −28.9 ± 0.8‰. The δ15Nbulk values at this time span +0.8 to +5.1‰, with average values of +3.1 ± 1.8‰, being much lighter than the average Ediacaran and Cambrian δ15Nbulk values. The Silurian samples display δ13Corg values between −28.8‰ and −25.9‰ with an average of −27.8 ± 0.9‰. They contain the lowest δ15Nbulk values of the section, ranging from +0.6 to +4.0‰ and averaging +2.8 ± 1.0‰). In light of these observations, δ13Corg values do not significantly vary across the studied section, while the global δ15Nbulk curve display several trends.
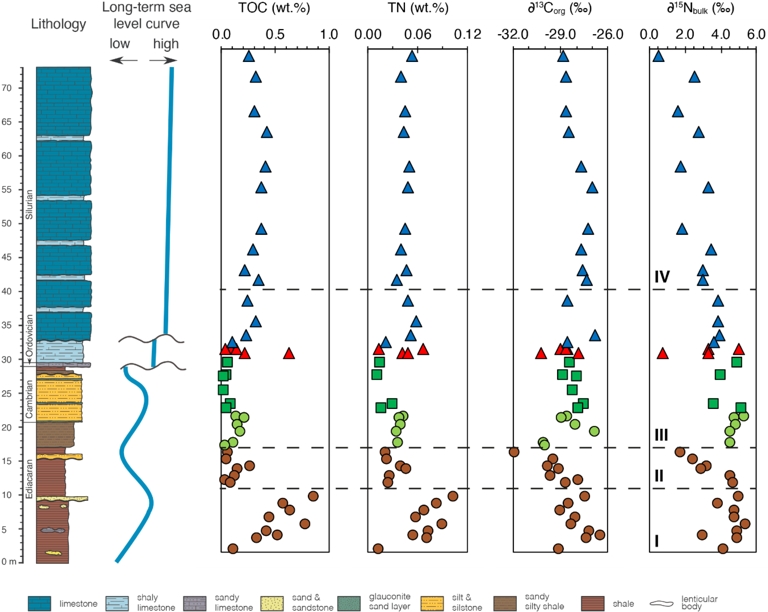
Lithostratigraphic column associated with stratigraphic variations of total organic carbon (TOC), total nitrogen (TN), and carbon and nitrogen isotope composition across the Ediacaran to Silurian strata in the studied section, southwestern Ukraine. High-order (i.e., short-term) sea level changes are not shown, but well-documented in the Silurian Podolia Basin (Radkovets, 2015; Poprawa et al., 2018). Interval I: lower Ediacaran rocks, interval II: upper Ediacaran rocks, interval III: Ediacaran–Cambrian transition to lowermost Silurian rocks, interval IV: upper Silurian. Sediments of early Silurian in age were likely eroded in the Podolia Basin (see geological background). Brown circles, light green circles, green squares, red triangles, and blue triangles correspond to Ediacaran, Ediacaran–Cambrian transition, Cambrian, Ordovician, and Silurian samples. Masquer
Lithostratigraphic column associated with stratigraphic variations of total organic carbon (TOC), total nitrogen (TN), and carbon and nitrogen isotope composition across the Ediacaran to Silurian strata in the studied section, southwestern Ukraine. High-order (i.e., short-term) sea level changes are not ... Lire la suite
We divide the studied section into four intervals I–IV based on the stratigraphic δ15Nbulk variations (Figure 6). Interval I corresponds to lower Ediacaran strata, characterized by high and narrowly distributed δ15N(bulk) values and increasing total nitrogen (TN, wt%). Interval II includes upper Ediacaran samples, where δ15N(bulk) values decrease and TN (wt%) shifts to lower levels. The boundary between these two intervals corresponds to this shift in TN values. Interval III spans the Ediacaran–Cambrian transition to the lower Silurian and is marked by a return to high and narrowly ranged δ15N(bulk) values, similar to those in Interval I. Interval IV represents the upper Silurian and is characterized by a decreasing trend in δ15Nbulk values (Figure 6).
5. Discussion
5.1. Paleoenvironmental reconstructions
5.1.1. Sediment provenance and paleoweathering processes
The spatial distribution and assemblage of clay minerals in sedimentary rocks are routinely used as proxies for paleoclimatic, paleoenvironmental, and thermal historical events in Precambrian and Phanerozoic sedimentary rocks (e.g., Bristow et al., 2009). Clay minerals in fine-grained shale and mudstone siliciclastic sediments are major sinks for ions and can provide a physical and chemical record of the weathering conditions that regulate the composition of the biosphere (Isson and Planavsky, 2018; Rafiei and Kennedy, 2019). Importantly, the preservation of low temperature chlorite/smectite and illite/smectite mixed layer minerals, as well as glauconite/berthierine clay minerals, together with the conspicuous absence of metamorphic minerals (Figures 4 and 5; Figure S2), imply that the Podolia Basin sediments are well preserved and have only undergone weak diagenetic modification (Meunier and Velde, 2004; Bristow et al., 2009). Moreover, differences in clay mineralogy between the siliciclastic Ediacaran–Cambrian and the Ordovician–Silurian carbonate rocks are consistent with changes in lithofacies and prevailing environmental conditions. Further, the moderate to strong co-variation of most of the whole-rock major and trace elements composition with Al2O3 (Figures S3–S5) and flat REE patterns (except for a few samples; Figure S6) indicate the delivery of these elements to the basin was mainly controlled by detrital fluxes. Therefore, we interpret that the mineralogy and bulk geochemistry as being consistent with the dominance of lithological change.
The composition of parent rocks and the extent of chemical weathering (i.e., their CIA) in the siliciclastic rocks record significant influence on nutrient supply from the continents to the oceans, and thus influence on seawater primary productivity (Nesbitt and Young, 1984; Cox et al., 2016; Stüeken, Kipp, et al., 2016; Large et al., 2018). The high-field-strength elements have been widely used in tracing sediment provenance because they are; (i) more enriched in felsic rocks relative to mafic rocks, (ii) largely independent of redox conditions and biological evolution, (iii) relatively immobile, and (iv) resistant to alteration during sedimentary processes (Taylor and McLennan, 1985; Bhatia and Crook, 1986; Condie, 1993; Large et al., 2018). We use the compositional ratios of the incompatible thorium (Th), which tends to be enriched in felsic rocks, with compatible scandium (Sc) that is enriched in mafic rocks, to discriminate the provenance of the sediments (Condie, 1993). Most of the samples plot between the granite and granodiorite endmembers on the La–Th–Sc and the Th/Sc versus La/Sc compositional discriminant diagrams (Figure S7a,b), thus suggesting the delivery of detrital materials from a predominantly felsic rock source (Bhatia and Crook, 1986; Large et al., 2018). Moreover, the samples mostly fall away from the A-CN axis and between the weathering lines of granodiorite and granite on the A-CN-K diagram with a mean of CIA values of 67.4 ± 5.7 in the studied section (Figure S7c; Table S1) (Nesbitt and Young, 1984; Fedo et al., 1995).
Regardless of stratigraphic position, our CIA values suggest that parent rocks were moderately weathered (CIA values between 60 and 80) in the sediment source area, reflecting a temperate climate (Algeo, Hong, et al., 2025). In contrast, variations in lithofacies are more likely to reflect conditions associated with progressive sea-level rise and elevated atmospheric CO2 content during the deposition of the carbonate-dominated Ordovician and Silurian sediments (Maher and Chamberlain, 2014; S. Zhang et al., 2021). This is consistent with the approximated paleolatitude equatorial position of Ukraine during the Ordovician to Silurian (Laverov et al., 2013), as well as the generally higher CO2 levels estimated for that time. Interestingly, the Ordovician and Silurian CIA values of the Podolia Basin do not significantly vary compared to the Ediacaran and Cambrian. This suggests that chemical weathering on land and/or delivery of soluble elements to the depositional sites was relatively stable in this weathering area.
5.1.2. The paleoredox conditions
The abundance of RSTEs in sediments has been widely used to infer the paleoredox conditions of ancient seawaters due to their predictable response to different redox conditions (Algeo and Maynard, 2004; Tribovillard, Algeo, Lyons, et al., 2006; Algeo and Tribovillard, 2009; Reinhard, Planavsky, Robbins, et al., 2013). For instance, the redox sensitive Mo, U, Th, Cr and V are typically soluble with little to no authigenic enrichment in oxic sediments, but they become immobilized and co-enriched in sediments under ferruginous and euxinic anoxic conditions (Algeo and Maynard, 2004; Tribovillard, Algeo, Lyons, et al., 2006; Partin et al., 2013). The low concentrations of Mo, U, and V across the sampled section, and their positive correlations with Al (Figure S5), suggest various scenarios for basinal bioavailability of these elements. This might be attributed to low weathering rates of the provenance of lithology, incorporation in detrital materials, the prevalence of predominantly oxygenated depositional conditions (Tribovillard, Algeo, Lyons, et al., 2006), or a change in sedimentation rates (J. Liu and Algeo, 2020). In addition, the Y/Ho ratio commonly distinguishes marine from terrestrial inputs, with sedimentary Y/Ho ratios >40 representative of a seawater signal and open marine settings, 33–40 near-shore settings, and a 25–27 terrestrial input (Bau et al., 1997). Our Y/Ho ratios, averaging around 26 in both the Ediacaran and Cambrian, and increasing to 30.2 in the Ordovician and 30.21 in the Silurian sediments, suggest a dominant input of detrital material consistent with deposition in a continental shelf environment. This observation further reinforces the strong correlation between most of the whole-rock elements and Al across the sequence, regardless of lithological changes. Thus, the sea-level changes in the Ediacaran and Cambrian were likely not important to move the shoreline towards open marine environment, which, in turn, allowed the expression of near-uniform clastic Y/Ho ratios during that time. In contrast, the increasing Y/Ho ratios from the Ordovician and Silurian point to a gradual increase in sea level (i.e., decrease of fresh water input), (Bau et al., 1997; Halverson et al., 2011).
Redox-sensitive trace metals such as U, Mo, and Cr are commonly employed as proxies to infer ancient redox conditions in sedimentary environments. Their geochemical behavior is strongly influenced by the redox state: they tend to remain dissolved under oxic conditions but are more likely to be immobilized and incorporated into sediments under anoxic or suboxic settings. This characteristic makes them valuable indicators of past oxygen levels in depositional environments (e.g., Brumsack, 2006; Algeo and Maynard, 2004; Tribovillard, Algeo, Lyons, et al., 2006; Tribovillard, Algeo, Baudin, et al., 2012; J. Zhang et al., 2016).
The enrichment factors of Mo, U, and Cr in the Podolia Basin show that samples from the Ediacaran to the Cambrian are generally not enriched in RSTEs, except for few samples from the Ediacaran–Cambrian transition. In contrast, samples from the Ordovician and the upper part of the Silurian show enrichment in Cr and U, while only the upper Silurian is enriched in Mo (Figure S8). This suggests that redox conditions across the section evolved significantly over time. During the Ediacaran to Cambrian interval, the environment was predominantly oxic. Conditions then shifted to anoxic during the Ordovician, before returning to oxic in the lower Silurian (Algeo and Maynard, 2004; Tribovillard, Algeo, Lyons, et al., 2006; Tribovillard, Algeo, Baudin, et al., 2012; J. Zhang et al., 2016). The upper Silurian, however, appears to have been euxinic, as indicated by the marked enrichment Mo (Algeo and Maynard, 2004; Tribovillard, Algeo, Lyons, et al., 2006; Tribovillard, Algeo, Baudin, et al., 2012; J. Zhang et al., 2016).
5.1.3. Preservation of primary C and N isotopic signals
The molar C/N ratios in our Ukrainian samples average 6.9 ± 3.0 (Table S4), which is extremely close to the molar C/N ratio of ∼7 for the planktonic biomass in modern oceans (Redfield, 1958). This suggests an absence of extensive remineralization of organic matter in the water column and sediments.
We then assessed the preservation of primary δ13Corg and δ15Nbulk compositions in the sediments because diagenesis and metamorphism can modify the primary signature (Stüeken, 2013; Ader, Thomazo, et al., 2016; Stüeken, Kipp, et al., 2016). Nitrogen in sedimentary rocks may occur as organic-bound and inorganic clay-bound ammonium (
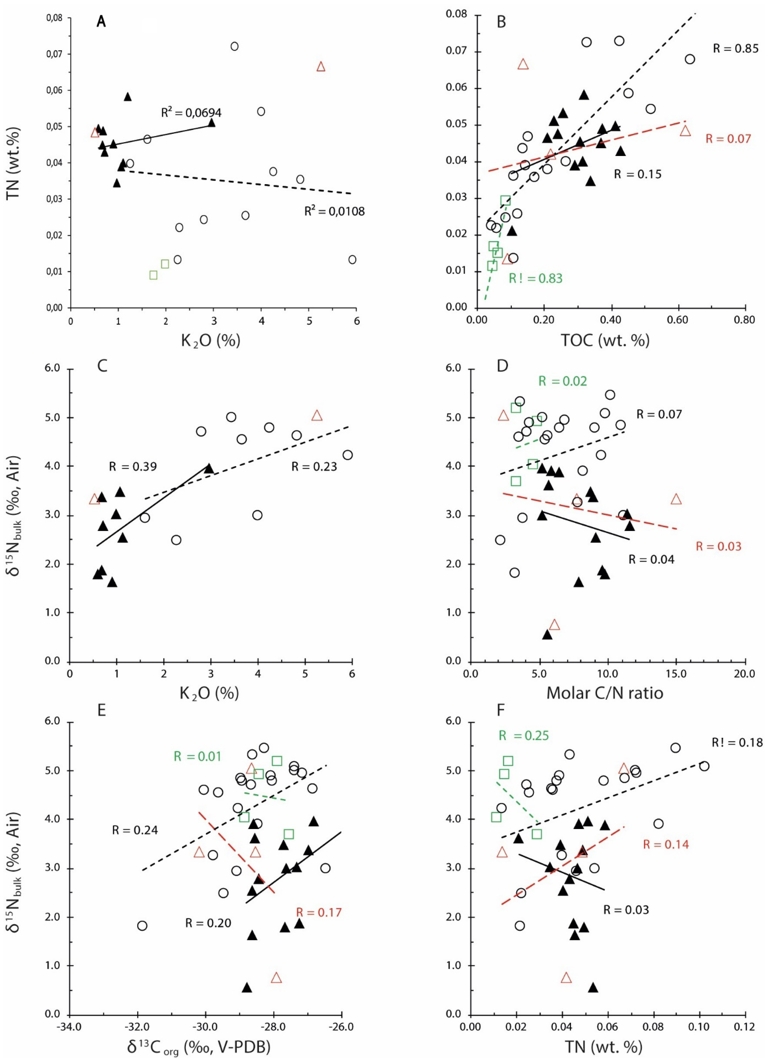
Preservation of primary isotopic signals. Cross plots showing the relationships between (A) TN and K2O, (B) TN and TOC, (C) δ15Nbulk and K2O, (D) δ15N and C/N, (E) δ15Nbulk and δ13C, (F) δ15Nbulk and TN in the studied section to check for possible alteration of primary isotopic compositions. Unfilled circles, green squares, red triangles, and black triangles correspond to Ediacaran, Cambrian, Ordovician, and Silurian samples, respectively.
The preferential release of 14N and 12C during diagenetic and metamorphic thermal degradation of organic matter results in associated higher δ15Nbulk and δ13Corg values (Cremonese, G. Shields-Zhou, et al., 2013; Ader, Sansjofre, et al., 2014). In addition, thermal degradation leads to the depletion of N relative to C, which is reflected by an increase of and C/N molar ratios (Stüeken, Zaloumis, et al., 2017). This process typically produces strong covariations between δ15Nbulk and C/N, δ15Nbulk and δ13Corg, and δ15Nbulk and TN. These covariations are not observed across the studied Ukrainian section (Figure 7d–f), which argues against diagenetic alteration of the primary δ13Corg and δ15Nbulk signal.
5.1.4. Evaluation of δ15Nbulk patterns
The δ15Nbulk has been extensively used to elucidate connections between N cycling, nutrient bioavailability, bio-evolution, and ocean redox conditions in modern and ancient sedimentary basins because N fractionates predictably during redox reactions (Canfield, Glazer, et al., 2010; Ader, Thomazo, et al., 2016; Stüeken, Kipp, et al., 2016; Aubineau et al., 2021). The exclusively positive δ15Nbulk values, mostly >+3‰ but <+5‰ for modern oxic sediments (Tesdal et al., 2013), are broadly interpreted to imply aerobic N cycling in a relatively stable nitrate reservoir (Bauersachs et al., 2009; Ader, Sansjofre, et al., 2014). The positive δ15Nbulk reflects partial denitrification (i.e., reduction of
The presence of profound eustatic changes in the Podolia sequence upward, shown by variations in lithology and increasing Y/Ho ratios, may have had an impact on the nitrogen dynamic from the Ediacaran to Silurian, which needs to be carefully considered. Intervals I and III, marked by mean positive δ15Nbulk values of 4.6‰ (n = 18) and close to the ∼+5‰ average value of modern oceans (Tesdal et al., 2013), are associated with sea-level rises. The transgressions during these intervals were likely not significant enough to cause major disruptions in biogeochemical nitrogen cycling. One possible explanation for the narrowing of N isotope composition is that water column partial denitrification and/or anammox at the redox transition zone produced a major loss of 14N delivered to the surface ocean. This also means that nitrogen fixation supported nitrification and denitrification, interpreted to mean that the water column must have been sufficiently oxidizing to promote quantitative conversion of
High bacterial abundance versus eukaryotic algae, together with low TOC contents and low hydrogen indices, revealed localized oligotrophic conditions in the Podolia Basin during the middle to late Ediacaran (Pehr et al., 2018). Nitrogen was not the bio-limiting nutrient, as suggested by the positive δ15Nbulk values between +3.5 and +6.2‰, except one sample of −2.8‰ (ibid.). The range of nitrogen isotope compositions we report in the lowermost Ediacaran interval I strata (middle to late Ediacaran in age, Soldatenko et al., 2019) is consistent with the δ15Nbulk range for other locations from epicontinental seas across the Podolia Basin (Pehr et al., 2018). This strongly corroborates the idea that the microbial ecosystem, dominated by prokaryotic N2-fixing microorganisms, could have formed a large seawater nitrate pool. The proposed oligotrophic conditions in the Podolia Basin could have been the result of low nutrient fluxes between terrestrial and deep seawater (Pehr et al., 2018). With persistent oligotrophic conditions, the marine environments, localized in the Podolia Basin, could have, however, favored the transient decrease in δ15Nbulk values to +1.8‰ in the upper Ediacaran interval II. In nutrient-limited environments, productivity becomes low, limiting the deposition of organic matter, which is consistent with the lower TOC and TN contents during interval II compared to the underlying sediments (Figure 6). Therefore, nitrogen fixation rather than microbial denitrification in the water column would have had, transiently, a greater influence on δ15Nbulk composition.
Marine N2-fixation is an energy-intensive enzymatic process, which requires 16 ATP molecules per N2 molecule. Diazotrophic cyanobacteria, however, compete poorly with eukaryotic algae except under oligotrophic conditions that were dominant during the Ediacaran intervals I and II. Therefore, the rapid return of a nitrate reservoir strong enough to leave a positive isotopic fingerprint at the Ediacaran–Cambrian transition (lower part of the interval III) could have first resulted from rapid replenishment of the nitrate reservoir by N2-fixing cyanobacteria initiated in the upper Ediacaran interval II. This nitrate buildup would have been followed by changes of ecological conditions at the interval II–III transition, where denitrifying organisms outcompeted diazotrophic cyanobacteria. Intriguingly, the persistence of this relatively stable
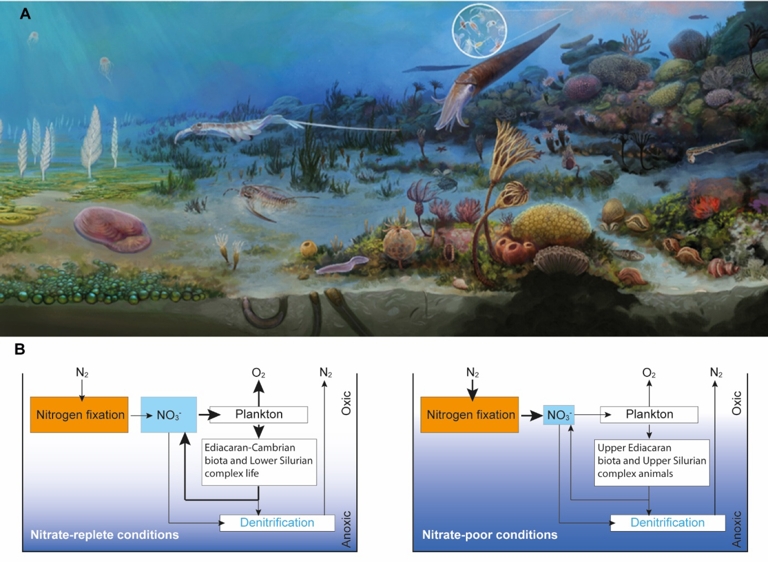
(A) Artist’s representation illustrating the near-continuous Ediacaran to Silurian shallow seawater margin in southwestern Ukraine (from left to the right), reconstructed from the fossil assemblage preserved across the section (see Figure 1). White circle shows the emergence of abundant plankton biomass during the Silurian (copyright A. El Albani). (B) Dominant features of the Ediacaran–Silurian nitrogen cycle. The size of the arrows is proportional to the changes that accompanied the magnitude of the nitrogen and oxygen biogeochemical cycles and their influence on life forms in the seawater column. The nitrate-replete conditions operated in lower Ediacaran rocks, and Ediacaran–Cambrian transition to the lowermost Silurian rocks (intervals I and III), while the nitrate-poor conditions operated in the upper Ediacaran and upper Silurian rocks (intervals II and IV). The rapid return of nitrate-rich conditions was likely promoted by a high rate of nitrogen fixation in the late Ediacaran. The nitrate drawdown during the Silurian likely resulted from repetitive sea level rises and falls. Masquer
(A) Artist’s representation illustrating the near-continuous Ediacaran to Silurian shallow seawater margin in southwestern Ukraine (from left to the right), reconstructed from the fossil assemblage preserved across the section (see Figure 1). White circle shows the emergence of abundant plankton biomass ... Lire la suite
Although the presence of eustatic variations between intervals I and III, the δ13Corg values vary moderately around a mean of about −28.5% and are within the range reported in the Podolia Basin (Figure 6; Pehr et al., 2018). Given that these rocks have not experienced thermal alteration, this suggests that the carbon fixation pathways that produced δ13C fractionation in organic compounds did not experience radical compositional change through this time period. Moreover, high Corg fractionation linked to small-cell size, high surface/volume ratio, and slow growth rates under oligotrophic conditions, may have significantly lowered the δ13Corg values (Tolosa et al., 2008). Therefore, we propose that the δ13Corg values between intervals I and III have largely originated from a similar microbial C source, which would suggest that the chemocline—the locus of multiple microbial processes—was deeper than the depositional settings.
The persistent aerobic N cycling in the Ordovician and lowermost Silurian rocks (upper part of the interval III, see geological background for explanation of sedimentary gaps) could be intimately linked to the GOBE and POE (Figures 3f–j, 6). These observations may suggest that the availability of a large seawater
The depth of the chemocline controls the amount of nitrate available for recharging the surface ocean (Ader, Sansjofre, et al., 2014). The shallower the chemocline is, the smaller the size of the nitrate pool. In the Podolia Basin, the Silurian interval IV was deposited on shallow water shelves within an eustatic cyclicity (Radkovets, 2015; Poprawa et al., 2018), which would have allowed the introduction of anoxic to euxinic deep waters into the shallow platform. Consistent with the latter proposition, accumulation of organic-rich sediments in the open shelf (>100 m) of Baltica and other paleocontinents was recorded, resulting from the expansion of anoxic/euxinic environments in the Silurian (Verniers et al., 2008; Melchin et al., 2013; Radkovets, 2015). The spread of anoxia in the Silurian was attributed to several interwoven factors (e.g., sea-level rise, global warming, and reduced rates of overturning circulation, among others; (Melchin et al., 2013)). As explained above, it is reasonable to assume that the shallow chemocline in the water column of the Podolia Basin (<100 m) associated with repetitive transgression–regression cycles, would have favored near-quantitative denitrification and the expression of N2 fixation in the studied depositional environments (Figure 8), lowering the δ15Nbulk toward 0‰. Deciphering whether this nitrate depletion was globally extended requires further investigations. Alternatively, the low δ15Nbulk signature could have resulted from a completely oxic ocean with all denitrification restricted to sediments (Ader, Sansjofre, et al., 2014; Ader, Thomazo, et al., 2016). However, this is inconsistent with the presence of anoxic waters in the open shelf of Baltica during the Silurian (Verniers et al., 2008; Melchin et al., 2013; Radkovets, 2015). Thus, our inferences highlight that the early Paleozoic life may have suffered from transient and localized nitrate scarcity in the Podolia Basin. Ocean redox conditions remained regionally heterogeneous during the Silurian, like the Neoproterozoic–Cambrian transition.
6. Conclusion
Our study presents the first comprehensive nitrogen isotope dataset across the Ediacaran–Silurian interval in the Podolia Basin, integrated with carbon and oxygen isotopes, TOC, and whole-rock geochemistry. This novel multiproxy approach reveals a direct cause-effect relationship between seawater nitrate bioavailability and biological evolution. We propose that the increase in nutrient supply to seawater at the end of the Cryogenian Neoproterozoic Snowball Earth glaciations (Frei et al., 2009; Bjerrum and Canfield, 2011; Butterfield, 2011) accelerated remarkable Ediacaran–Cambrian diazotrophic nitrogen fixation, which, in turn, promoted the expansion of bioavailable N, including nitrate. Although geological hiatuses in the Podolia sedimentary sequence were observed in the early Paleozoic, the
Declaration of interests
The authors do not work for, advise, own shares in, or receive funds from any organisation that could benefit from this article, and have declared no affiliations other than their research organisations.
Acknowledgements
La Region Nouvelle-Aquitaine, French Embassy in Kiev, Universities of Schevchenko and National Mining University of Ukraine, French Ministry for Foreign Affairs and Centre National de la Recherche Scientifique (CNRS) are acknowledged for collaboration and support. Permit was provided by the University of Schevchenko. For assistance, we acknowledge C. Lebailly.