

1 Introduction
There is widespread interest in the Neoproterozoic period of the Earth's history (1000 to 542 Ma) because of seemingly unprecedented environmental fluctuations. Many believe these environmental perturbations to be responsible for the changing conditions in the biosphere that facilitated the radiation of metazoan life (animals) towards the end of the Neoproterozoic (Fike et al., 2006; Kennedy et al., 2006; Knoll and Caroll, 1999; Peltier et al., 2007) (Fig. 1). The carbon isotopic record of ancient ocean water preserved in marine carbonates serves as an important means to recognize changes in the exogenic cycle coincident with these evolutionary events (Knoll et al., 1986; Magaritz, 1991; Peltier et al., 2007; Schidlowski and Aharon, 1992). The Neoproterozoic δ13C record shows several unprecedented fluctuations (Halverson et al., 2005; Le Guerroué et al., 2006c; Shields and Veizer, 2002) (Fig. 1) with implications especially interesting in the Ediacaran interval (635–542 Ma), during which atmospheric oxygen concentrations were likely to have been particularly dynamic (Bartley and Kah, 2004; Rothman et al., 2003) (Fig. 1), ultimately stabilizing closer to modern levels (Canfield and Teske, 1996; Kah et al., 2004). A step to higher oxygen concentration is widely believed to be a necessary condition for multicellularity and metazoan evolution (Anbar and Knoll, 2002; Kennedy et al., 2006; Knoll and Walter, 1992) and to be important in determining the timing of the first animals in the fossil record.
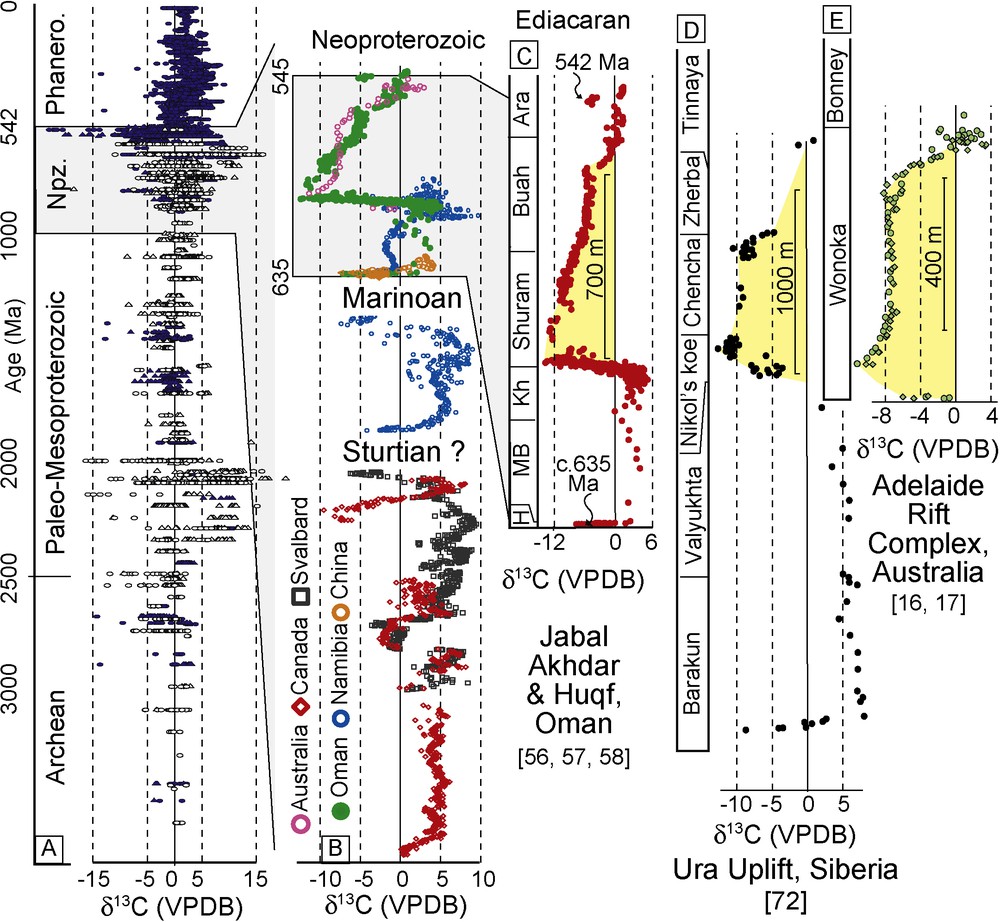
δ13C compilation (A: after (Shields and Veizer, 2002)) throughout Earth history and Neoproterozoic composed from different continental fragments (B: modified from (Halverson et al., 2005)). Note major δ13C signal fluctuations during the Neoproterozoic. Detailed Ediacaran δ13C record from section in Oman (C (Le Guerroué et al., 2006c)), Siberia (D (Pokrovskii et al., 2006)) and Australia (E (Calver, 2000)). Note pattern reproducibility throughout the thick sedimentary packages but the absence of radiometric or biostratigraphic ages to support definite correlation. Key is H: Hadash; MB: Masirah Bay; Kh: Khufai; Npz: Neoproterozoic; Phanero: Phanerozoic. Oman radiometric age constraints after Bowring et al., 2007. Masquer
δ13C compilation (A: after (Shields and Veizer, 2002)) throughout Earth history and Neoproterozoic composed from different continental fragments (B: modified from (Halverson et al., 2005)). Note major δ13C signal fluctuations during the Neoproterozoic. Detailed Ediacaran δ13C record from ... Lire la suite
Évolution du signal δ13C (A : d’après (Shields and Veizer, 2002)) au cours de l’histoire terrestre (et spécifiquement le Néoprotérozoïque), compilée à partir de l’enregistrement sur différents fragments continentaux (B : modifié de (Halverson et al., 2005)). Les fluctuations majeures du signal δ13C sont observées au Néoprotérozoïque. Détails de l’enregistrement δ13C Édiacarien en Oman (C : (Le Guerroué et al., 2006c)), Sibérie (D : (Pokrovskii et al., 2006)) et Australie (E : (Calver, 2000)). Le signal apparaît reproductible à travers d’épaisses séries sédimentaires, mais aucune contrainte radiométrique ou biostratigraphique ne valide ces corrélations. Légende : H : Hadash ; MB : Masirah Bay ; Kh : Khufai ; Npz : Néoprotérozoïque ; Phanero : Phanérozoïque. Âges radiométriques d’après Bowring et al., 2007. Masquer
Évolution du signal δ13C (A : d’après (Shields and Veizer, 2002)) au cours de l’histoire terrestre (et spécifiquement le Néoprotérozoïque), compilée à partir de l’enregistrement sur différents fragments continentaux (B : modifié de (Halverson et al., 2005)). Les fluctuations majeures ... Lire la suite
The most negative δ13C excursion in the Neoproterozoic (e.g. the “Shuram/Wonoka Excursion” (Le Guerroué et al., 2006c); Fig. 1) fundamentally challenges the standard understanding of isotopic mass balance as established in the modern ocean (Broecker and Peng, 1982). The long time scale required by the stratigraphic complexity of the excursion, largely longer than the residence time of carbon in the ocean is ≈105 y, implies that these strongly negative isotopic values (below −10‰) record a sustainable steady state condition in the global ocean. This contrasts sharply with the rare, short-lived, excursions of only ∼ 4‰ accepted in the Phanerozoic (Hayes et al., 1999; Veizer et al., 1999; Zachos et al., 2001) (Fig. 1). These Phanerozoic excursions have been used as evidence only for transient (short term) global ecosystem disruptions while large negative values recorded in Phanerozoic carbonates, have been interpreted as diagenetic alteration (see good example in Swart and Eberli, 2005, and being the product of processes not constrained by the global isotopic mass balance. Such processes are typically diachronous events in restricted basins associated to particular facies of non-surface marine origin or pervasive platform scale diagenetic alteration (Table 1).
Valeurs minimales du 87Sr/86Sr à la limite Précambrienne Cambrienne (P-) et de la Cap Carbonate marinoenne, disponible dans la littérature pour chaque bassin. Données originales issues du Tableau S1, Matériel suplpémentaire. La moyenne de ces valeurs permet de définir la variation moyenne du 87Sr/86Sr durant l’Ediacarien. Voir discussion.
| Oman | China | India | Siberia | Australia | Canada | Namibia | Mongolia | Brazil | Average | |
| P- values | 0.70901 | 0.70968 | 0.70950 | 0.70820 | 0.70880 | No data | 0.70852 | 0.70872 | 0.70890 | 0.70891 |
| Cap Carbonate values | 0.70842 | 0.70775 | No data | 0.70730 | No data | 0.70732 | 0.70767 | 0.70719 | 0.70744 | 0.70758 |
| Edicaran total variation | 0.00058 | 0.00193 | – | 0.00091 | – | – | 0.00085 | 0.00152 | 0.00146 | 0.00121 |
| Variation rate per Myr | 6.25E-06 | 2.08E-05 | – | 9.75E-06 | – | – | 9.17E-06 | 1.64E-05 | 1.57E-05 | 1.3E-05 |
Ultimately, most Neoproterozoic comprehensive correlations (for example, Halverson et al., 2005; Walter et al., 2000) are constructed using exclusively δ13C variation pattern. In absence of calibrated biostratigraphy (Precambrian) and due to the paucity of radiometric age determinations, these excursions are assumed to be primary in nature and hence globally synchronous. It is important to realize that no independent time chronometer validates the general pattern in Fig. 1 and correlations solely made on δ13C variations could be circular (Frauenstein et al., 2009). Considering this paucity of absolute calibration in the Neoproterozoic we propose to use the 87Sr/86Sr ratio as an independent chronometer to better time constrain these Ediacaran δ13C excursions and to test their global coherence and consequently their veracity.
2 δ13C excursions
The Ediacaran period δ13C record is widely believed to be the witness of three profound negative excursions corresponding to the Marinoan cap carbonates, the Shuram/Wonoka anomaly and the Precambrian/Cambrian boundary (Corsetti and Hagadorn, 2000; Halverson et al., 2005; Jiang et al., 2003a; Knoll et al., 2004; Le Guerroué et al., 2006c). The most profound and enigmatic Shuram/Wonoka anomaly attaining a −12‰ nadir is repeated in numerous places along correlative strata throughout the basin suggesting a primary origin of the values (Burns and Matter, 1993; Cozzi et al., 2004b; Fike et al., 2006; Le Guerroué et al., 2006a; Le Guerroué et al., 2006c). Furthermore detailed studies in the upper Shuram Formation of Oman proved the stratigraphic coherence of −10‰ δ13C values at the scale of a few parasequences (Le Guerroué et al., 2006b), or failed to support a diagenetic overprint (Fike et al., 2006; Le Guerroué et al., 2006a; Le Guerroué and Cozzi, in press; Le Guerroué and Kennedy, 2007). The Shuram/Wonoka as a primary oceanographic excursion hypothesis is furthermore supported by the presence of large negative excursions located on different continental fragments during the Ediacaran period (Fig. 1, Table S1, Supplementary data). The hypothesis requires a coherent synchroneity of all these potential equivalent anomalies. To support this, there are, to date, no robust age constraints on any of these excursions, with the exception of the end of the Doushantuo anomaly (China) at ca. 551 Ma (Condon et al., 2005) and subsidence ages on the Shuram Formation of Oman bracketing the excursion between ca. 600 and 550 Ma (Le Guerroué et al., 2006c). Alternatively the Marinoan cap carbonate excursion and the Precambrian/Cambrian boundary are better time constraint by (bio) stratigraphic and/or lithofacies arguments and a few radiometric ages at 635 and 542 Ma respectively (Amthor et al., 2003; Condon et al., 2005; Halverson et al., 2005; Hoffmann et al., 2004; Knoll et al., 2004).
Strongly negative Neoproterozoic δ13C excursions (Fig. 1) are currently subject to debate regarding their origin as a primary oceanographic signal (Frauenstein et al., 2009; Le Guerroué and Cozzi, in press). They could imply the oxidation of an extraordinary large dissolved organic carbon reservoir (Fike et al., 2006; Peltier et al., 2007; Rothman et al., 2003) over few millions of years (a few hundred times the duration of the carbon cycle) that is required by the complex stratigraphy of those formations. An organic carbon reservoir oxidation hypothesis for this data has a significant implication for the carbon cycle but however remains a non-steady state reallocation of carbon. It is essential to critically test the global reproducibility and synchroneity of the Shuram/Wonoka to first support a primary excursion hypothesis before attempting robust explanations.
3 Strontium isotopes
The strontium isotope ratio for carbonate rocks reflects the relative contribution of strontium to the ocean from continental weathering and from hydrothermal activity along mid-oceanic ridges (Veizer, 1989). The 87Sr/86Sr ratio of seawater is very uniform on a global scale, which is an expression of the long oceanic residence time of Sr (3–5 Ma), combined with a relatively short (< 1000 years) oceanic mixing rate (Peterman et al., 1970; Veizer and Compston, 1974). 87Sr/86Sr is a strong, independent chemostratigraphic tool for making correlations and indirect age assignments especially useful in the Neoproterozoic given the absence of biostratigraphy and paucity of radiometric ages in the fragmentary stratigraphic records (Frauenstein et al., 2009; Halverson et al., 2007; Knoll, 2000; Knoll and Walter, 1992). The general pattern that has emerged for the Neoproterozoic 87Sr/86Sr curve is one of very low ratios (< 0.7060) early in the era, gradually increasing values in the middle of the Neoproterozoic, and a large monotonic increase to values greater than 0.7085 during the Ediacaran period (Halverson et al., 2007; Prokoph et al., 2008) and references therein. 87Sr/86Sr data is subject to diagenetic processes but it is not the intention of this manuscript to review the diagenetic overprint of each datasets used here. Readers are referred to original publications were diagenetic issues have been properly addressed. For the purpose of this study, minimum 87Sr/86Sr values in each set of data are given most credit and it is assumed that they most closely resemble coeval seawater (Frauenstein et al., 2009). The used dataset generally presents Mn/Sr ratio well below 10. 87Sr/86Sr values are not expected to vary from basin to basin as open ocean basins largely buffer continental inputs. Variations in dataset are therefore most likely representative of diagenetic interpretation. This issue will be addressed by defining an average Ediacaran trend and apply a correction to each individual basin (see method section).
4 Summary of datasets
4.1 Oman
Oman presents a rather complete stratigraphy (no significant time break is recognized; Fig. 1C) from the deposition of the Hadash Formation cap carbonate Marinoan in age (constrained by detrital zircon population to be < 645 Ma; (Allen, 2007; Bowring et al., 2007; Le Guerroué et al., 2005)) up to the Precambrian/Cambrian boundary recently defined in Oman's subsurface (U/Pb on ash bed (Amthor et al., 2003)). Further detrital zircons populations combined with basinal thermal subsidence analyses constrain the base of the Shuram Formation (∼ 600 Ma) and middle Buah Formation baring the end ((∼ 550) of the negative δ13C Shuram excursion (Le Guerroué et al., 2006c). The isotopic record (δ13C and 87Sr/86Sr; Table S1, Supplementary data) is very complete throughout the Ediacaran period and repeated in numerous sections (Fig. 2 (Burns et al., 1994; Burns and Matter, 1993; Cozzi et al., 2004b; Cozzi et al., 2004a; Fike et al., 2006; Le Guerroué et al., 2006b; Le Guerroué et al., 2006a; Le Guerroué et al., 2006c) and references therein). Oman is to date probably the best chemostratigraphically illustrated and completed Ediacaran succession and represents a robust frame to be tested against other worldwide sections.
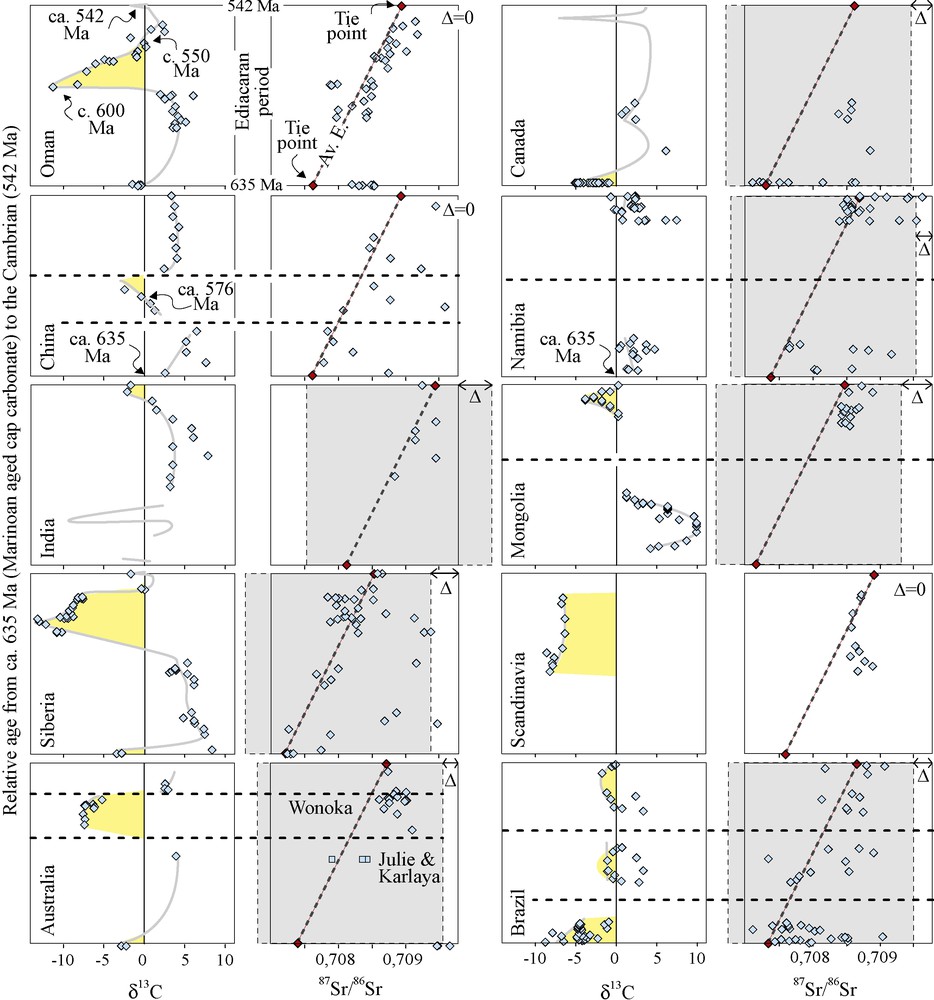
Chemostratigraphic data (δ13C and 87Sr/86Sr; Table 1) for each continental fragment compiled from literature and plotted against calibrated time axis assuming ca. 635 Ma for the cap carbonate and ca. 542 Ma for the Precambrian/Cambrian boundary. Only δ13C values associated with 87Sr/86Sr measurements in similar stratigraphic interval are represented on diagrams. Solid grey line represents the complete available δ13C record pattern (includes data points not coupled with 87Sr/86Sr values). Dashed black line represents well-recognized significant stratigraphic breaks. Radiometric ages are given when available and discussed in the text. Average Ediacaran tie points calculated from all sections (Table 1) are given as well as the average Ediacaran trend that serves as a variation template (dashed grey line: Av. E.). Δ represents the basinal individual 87Sr/86Sr variation from the average Ediacaran trend. See method section. Note the general rise of 87Sr/86Sr values throughout the Ediacaran. Masquer
Chemostratigraphic data (δ13C and 87Sr/86Sr; Table 1) for each continental fragment compiled from literature and plotted against calibrated time axis assuming ca. 635 Ma for the cap carbonate and ca. 542 Ma for the Precambrian/Cambrian boundary. Only δ13C values associated with ... Lire la suite
Données chimiostratigraphiques (δ13C et 87Sr/86Sr ; Tableau 1) pour chaque fragment continental. Ces valeurs, issues de la littérature, sont rapportées au temps, considérant un âge de ca. 635 Ma pour la « cap carbonate » et ca. 542 Ma pour la limite Précambrien/Cambrien. Seules les valeurs δ13C associées aux valeurs 87Sr/86Sr dans un même intervalle stratigraphique sont représentées sur ces diagrammes. Les lignes grises représentent l’ensemble de l’enregistrement δ13C disponible (incluant les points non couplés à des valeurs 87Sr/86Sr). Les lignes noires pointillées représentent les hiatus stratigraphiques clairement identifiés. Les âges radiométriques fournis sont discutés dans le texte. Les points d’ancrage édiacariens moyens sont calculés à partir de toutes les sections (Tableau 1) et la variation moyenne édiacarienne sert de référence pour l’inter-comparaison (ligne grise pointillée: Av. E.). Δ représente, pour chaque bassin, la variation 87Sr/86Sr de la moyenne édiacarienne (Av. E.). Voir la partie méthode. Remarquez la croissance générale des valeurs du 87Sr/86Sr à travers la période édiacarienne. Masquer
Données chimiostratigraphiques (δ13C et 87Sr/86Sr ; Tableau 1) pour chaque fragment continental. Ces valeurs, issues de la littérature, sont rapportées au temps, considérant un âge de ca. 635 Ma pour la « cap carbonate » et ca. 542 Ma pour la limite Précambrien/Cambrien. Seules les ... Lire la suite
4.2 China
The Doushantuo Formation of China presents basin wide a quite heterogeneous isotope record bounded by two significant sequence boundaries dissecting the isotope record (see Condon et al., 2005; Ohno et al., 2008; Yang et al., 1999; Zhu et al., 2007 and reference therein). However, the Feidatian–Dongdahe section (Chengjiang, eastern Yunnan province; (Zhu et al., 2007)) records a δ13C pattern very similar to the Shuram of Oman. China's negative δ13C excursion is constrained to happen during the 551–576 ± 14 Ma period (Chen et al., 2004; Condon et al., 2005) and after 599 ± 4 Ma (Barfod et al., 2002). The overlaying Dengying Formation presents the Precambrian/Cambrian boundary associated with a complex Ediacaran fauna (Zhu et al., 2007). Further 87Sr/86Sr values obtained by Ling et al., 2007 on the Doushantuo and Dengying Formations which are centered around 0.71 are not included in this study as they are much higher than other Ediacaran aged ones (Ling et al., 2007), reflecting potential diagenetic issues, or restriction from the global ocean (Table S1, Supplementary data).
4.3 India
The Krol Formation of the lesser Himalaya of northern India presents a highly variable δ13C record (Table S1, Supplementary data (Kaufman et al., 2006)) along its carbonate ramp (Jiang et al., 2002). Only a sparse 87Sr/86Sr record is available and limited to the Late Ediacaran and Cambrian period (Table S1, Supplementary data; Krol C to Tal Formation (Tewari and Sial, 2007)). The Krol Formation also contains multiple sequence boundaries potentially biasing the chemostratigraphic record (Jiang et al., 2003b; Jiang et al., 2002).
4.4 Siberia
Siberian sections present a rather matching isotopic pattern with Oman's sections in terms of amplitude and stratigraphic thickness of the negative δ13C anomaly and also a large 87Sr/86Sr dataset (Table S1, Supplementary data). The δ13C excursion is reproduced in different places in the basin and does not present significant unconformities (Fig. 1D (Pokrovskii et al., 2006; Vinogradov et al., 2006a)). The succession is unfortunately not robustly time constrained apart from the presence of a possible Marinoan-aged glacial unit and Cambrian-aged fossils towards the top of the sections (Pokrovskii et al., 2006). Further isotope data is available for the Cambrian and matches worldwide correlations (Vinogradov et al., 2006b; Vinogradov et al., 2006a).
4.5 Australia
The δ13C pattern of the Wonoka Formation from the Adelaide Rift Complex of southern Australia matches that of the Shuram Formation of Oman. It is reproduced in different places, spanning a long stratigraphic record (Fig. 1E (Calver, 2000; Calver and Lindsay, 1998; Foden et al., 2001)) with several major stratigraphic unconformities (the Wonoka canyons (Christie-Blick et al., 1990)) that constrain the most negative δ13C values (Calver, 2000; Le Guerroué and Kennedy, 2007). 87Sr/86Sr values from the Julie and Karlaya formations of the Amadeus and officer basins respectively are also included in this data set (Table S1, Supplementary data (Calver and Lindsay, 1998)). Regional studies suggest that the Julie and Karlaya formations correlate to the base of the Wonoka (Calver and Lindsay, 1998). The Australian Ediacaran succession that represents the GSSP is unfortunately not firmly time constrained with the exception of the presence of Ediacaran and Cambrian aged fossils towards the top of the sections.
4.6 Canada
The Windermere Group of western Canada presents a thick Ediacaran succession with very limited δ13C measurements available. The strontium isotopes record is restricted to the base of the succession (Table S1, Supplementary data (James et al., 2001; Narbonne et al., 1994)). Stratigraphically, the succession does not appear to contain significant unconformities and strongly resembles the one recorded in Oman (the two “grand cycles” (Allen and Leather, 2006; Le Guerroué et al., 2006c)). If stratigraphic correlations are correct then the negative δ13C excursion is not time equivalent to the Shuram anomaly but to the Precambrian/Cambrian shift (Amthor et al., 2003; Corsetti and Hagadorn, 2000). Ultimately, given the paucity of available data, the Shuram excursion could be not yet be documented in western Canada.
4.7 Namibia
The stratigraphic record of Namibia contains a major sedimentary break covering most of the Ediacaran period (Halverson et al., 2005). The lower part of the exposed stratigraphy belongs to the post-Marinoan aged glacials deposits of the Ghaub Formation (Hoffman et al., 1998; Hoffmann et al., 2004) while the upper part belongs to the very end of the Ediacaran period (Fig. 2 (Saylor et al., 1998)). Isotopically (Table S1, Supplementary data (Kaufman et al., 1993; Kennedy et al., 1998)), Namibia is probably missing the Shuram anomaly within the unconformity (Halverson et al., 2005).
4.8 Mongolia
The Tsagaan Oloom Formation records, on top of glacial deposits, sediments up to the Cambrian (Brasier et al., 1996b; Shields et al., 1997; Shields et al., 2002). Glacial strata are capped by carbonates presenting a δ13C signature typical of “cap carbonate” although the carbonate facies is unusual (Table S1, Supplementary data (Shields et al., 2002)). The succession is not constrained in age and an assignment of the upper Tsagaan glacial diamictite to the Marinoan (c. 635 Ma) could be proposed. This would imply a deposition of the overlying succession within the Ediacaran period. However no Shuram equivalent isotope anomaly is found in Mongolia, instead the δ13C record shows highly positive values attaining +10‰ in sequence 3 and 4 (Table S1, Supplementary data). These high values are generally encountered in-between both glacial events (labelled Sturtian-Marinoan (Halverson et al., 2005)) implying than the glacials could be older than 635 Ma. If this hypothesis is correct, a very significant stratigraphic record (the Marinoan glacials and the entire Shuram anomaly) would be missing at top sequence 4 and or 5. Very low strontium isotope ratio supports the assignment of the sequence 3 and 4 to the Sturtian-Marinoan interval (that is generally low (Halverson et al., 2007; Melezhik et al., 2001)). Ediacaran like values are encountered in sequence 5 and 6 with values in unit 5 being more of Lower Ediacaran affinity whereas those one in unit 6 could be of Upper Ediacaran (Table S1, Supplementary data). The end of the section presents a δ13C negative excursion inferred to represent the Precambrian/Cambrian boundary (Amthor et al., 2003; Brasier et al., 1996a). We favour the hypothesis that sequence 3 and 4 are pre-Marinoan in age (based on the δ13C record). Unit 5 would then represent the base of the Ediacaran period whereas unit 6 would be of Upper Ediacaran age, leading to the Precambrian/Cambrian boundary (Brasier et al., 1996a). This hypothesis is supported by absolute values of the δ13C and 87Sr/86Sr record that also shows significant jump at the sequence boundaries (Fig. 2).
4.9 Scandinavia
The North Central Scandinavian Caledonides presents in its early chemostratigraphic record a negative δ13C anomaly (the so-called Leivset marble presenting −8‰ δ13C values; Table S1, Supplementary data) on top of a sharp tectonic contact bringing the stratigraphy on top of Silurian aged dark grey marble (Melezhik et al., 2008). If the upper succession is not firmly constrained in time, an Ediacaran age is proposed and largely supported by the 87Sr/86Sr record (Table S1, Supplementary data; that shows a sharp jump with the underlying Silurian unit (Melezhik et al., 2008)). The anomaly is well reproduced within different sections although it appears incomplete (limited outcrops and fault contact) in regards to the Shuram anomaly (Melezhik et al., 2008).
4.10 Brazil
The succession in Brazil is comprised in the Araras and Alto Paraguai groups (De Alvarenga et al., 2008; De Alvarenga et al., 2004; Nogueira et al., 2007) and is dissected in four different sequences separated by potentially significant time breaks. Brazil's sections present negative δ13C values around −2 to −3‰ all the way up to the Cambrian, contrasting sharply with the pattern observed in Oman or elsewhere (Table S1, Supplementary data). 87Sr/86Sr ratios support however an Ediacaran age assignment (Table S1, Supplementary data). Yet considering the stratigraphic complexities and possible time missing in the stratigraphic breaks, it is difficult to reconcile a Shuram type anomaly in Brazil.
5 Methods
Available 87Sr/86Sr values from the literature are used to time calibrate unconstrained pieces of stratigraphy and eventually use the reconstructed time frames to independently test the δ13C record. The methodology developed here comprises four steps:
- • The Marinoan cap carbonate (ca. 635 Ma (Bowring et al., 2007; Condon et al., 2005; Hoffmann et al., 2004)) and the Precambrian/Cambrian boundary (ca. 542 Ma (Amthor et al., 2003; Knoll et al., 2004)) are defined as two tie points that associated to a 87Sr/86Sr ratio calculated from averaging minimum values present in all sections (Table 1). These tie points (635 Ma; 0.70758) and (542 Ma; 0.70891) are chosen as they are time equivalent and easily recognizable in all sections. Our values are in a close range to Halverson et al. (Halverson et al., 2007). The slight difference being non relevant here as these tie points are used for comparison among datasets used here. Theoretical 87Sr/86Sr variation between the two tie points is around 0.00121 (Table 1) and is assumed constant through time. This assumption is largely supported by individual dataset that presents a rather linear variation and previous comprehensive studies that fail to identify first order knee points in the Ediacaran period (Table S1, Supplementary data (Halverson et al., 2007; Prokoph et al., 2008) and references therein);
- • The steady variation between the two tie points represents the theoretical global ocean variation throughout the Ediacaran and serves as a template to compare and calibrate individual datasets. Variation in 87Sr/86Sr among individual datasets exists and reflects basinal individual specificities related to diagenetic alteration. Individual datasets are therefore corrected for variation from the average global Ediacaran trend by shifting their entire dataset to lower or higher 87Sr/86Sr values. This is Δ on Fig. 2. This correction is applied here in order to allow datasets comparison, it is not assumed to represent specific geological phenomenon;
- • Fig. 2 is constructed using chemostratigraphic data from the literature (Table S1, Supplementary data) given available biostratigraphic record, recognized sedimentary hiatuses and absolute radiometric constraints. Stratigraphic pieces belonging to the cap carbonate sequence are bounded to the 635 Ma lower limits and strata containing the Precambrian/Cambrian boundary sequence are bounded to the 542 Ma upper limits. Time unconstrained pieces of stratigraphy, such as strata bounded by major regional unconformities are time calibrated (moved along the time axis) by nearest match of their 87Sr/86Sr values (corrected for local basin setting (Δ)) with the average Ediacaran trend. Since diagenesis increases 87Sr/86Sr ratio, data points are not individually time adjusted. Minimum 87Sr/86Sr values of stratigraphic fragments are calibrated as coherent block. This procedure is supported by the large residence time of Sr in the ocean (3–5 Ma);
- • Finally the δ13C vales are stacked (Fig. 3B) using the time calibration reconstructed from 87Sr/86Sr values in Fig. 2. It is important to note that the time calibration is constructed entirely without reference to δ13C curve. Only samples with both 87Sr/86Sr and δ13C measurements at a strictly similar stratigraphic interval are used (Fig. 2).
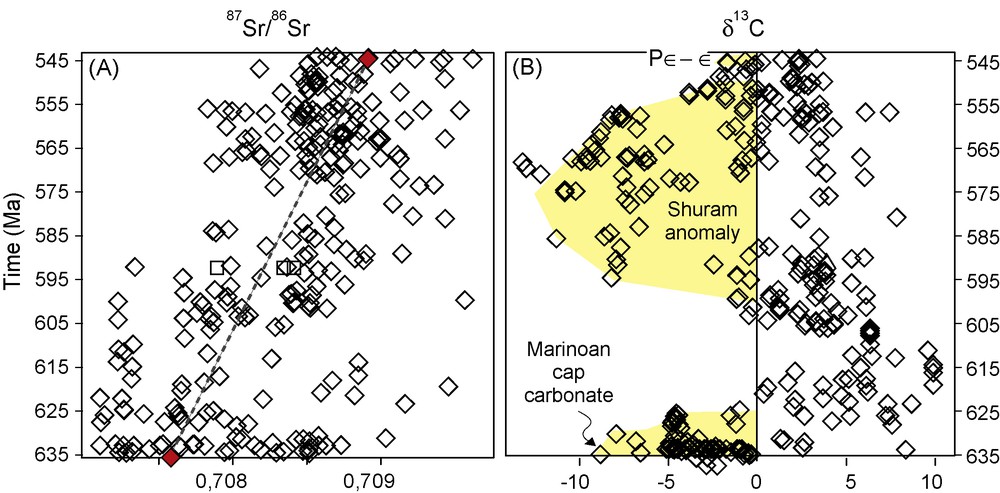
Ediacaran 87Sr/86Sr (A) and δ13C (B) composite constructed using time frame defined in Fig. 2. Note the 3 distinctive negative δ13C packages corresponding to the Marinoan cap carbonates, the Precambrian/Cambrian boundary (P-) and the Shuram anomaly (yellow areas). 87Sr/86Sr tie points (red point) defined in Table 1 are represented as well as the average Ediacaran trend (dashed grey line). Note that the bulk of negative δ13C values associated with the Shuram anomaly start around 600 Ma and end around 550 Ma. See discussion in text. Masquer
Ediacaran 87Sr/86Sr (A) and δ13C (B) composite constructed using time frame defined in Fig. 2. Note the 3 distinctive negative δ13C packages corresponding to the Marinoan cap carbonates, the Precambrian/Cambrian boundary (P-) and the Shuram anomaly (yellow areas). 87Sr/86Sr ... Lire la suite
Composites 87Sr/86Sr (A) et δ13C (B) édiacariens, construits en utilisant l’échelle de temps définie en Fig. 2. Les 3 paquets δ13C négatifs très distincts correspondent à la cap carbonate marinoenne, à la limite Précambrien/Cambrien (P-) et à l’anomalie de Shuram (zone jaune). Les points d’ancrage 87Sr/86Sr (points rouges) définis dans le Tableau 1 sont aussi représentés, ainsi que la moyenne édiacarienne (ligne grise pointillée). L’essentiel des valeurs δ13C négatives sont associées à l’anomalie de Shuram commençant autour de 600 Ma et finissant vers 550 Ma. Voir discussion dans le texte. Masquer
Composites 87Sr/86Sr (A) et δ13C (B) édiacariens, construits en utilisant l’échelle de temps définie en Fig. 2. Les 3 paquets δ13C négatifs très distincts correspondent à la cap carbonate marinoenne, à la limite Précambrien/Cambrien (P-) et à l’anomalie ... Lire la suite
6 Results
With current published isotope data, absolute age constraints, acceptance of minimum diagenetic modification to values, and the use of the 87Sr/86Sr steady rising trend to independently calibrate poorly time constrained fragments, the Ediacaran period provides a compelling example of stratigraphic consistency of carbon isotope values between sections. In the light of this approach, the reconstruction shows that 3 individual negative δ13C packages appear in the Ediacaran composite record (Fig. 3). These negative δ13C anomalies are well reproduced and have duration and amplitude specificities. They correspond to:
- (1) the well established Marinoan cap carbonate anomaly immediately preceding the glacial deposits (Halverson et al., 2005; Hoffman et al., 1998; Shields, 2005);
- (2) a long lived and profound Shuram/Wonoka excursion (Condon et al., 2005; Halverson et al., 2005; Le Guerroué et al., 2006c; Melezhik et al., 2008);
- (3) the Precambrian/Cambrian boundary shift (Amthor et al., 2003; Corsetti and Hagadorn, 2000; Saylor et al., 1998).
This composite record fails to recognize, at the global scale, other potential negative δ13C excursions such as the one present in the lower stratigraphy of the Krol Formation of India. Such excursions are therefore interpreted as non-synchronous and are probably related to diagenetic issues or basinal disconnection from the global ocean.
The bulk of the negative values associated with the Shuram/Wonoka excursion start around 600 Ma and end somewhere around 550 Ma (Fig. 3). These brackets are supported by published ages constraining the nadir of the excursion in Oman and China (Barfod et al., 2002; Le Guerroué et al., 2006c) as well as a cq. 551 Ma constraining the end of the anomaly in China (Condon et al., 2005). Other authors (Bowring et al., 2007; Condon et al., 2005; Fike et al., 2006; Halverson et al., 2007) favour a much younger age for the nadir of the Shuram excursion although no direct radiometric age supports these assignments. The anomaly appears to last 40–50 Ma; this very long duration is well supported by sections like those in Oman and Siberia, whereas sections like those of Australia and China suggest a shorter duration around 20–30 Ma (Fig. 3). It is also to note the partial time overlap of positive or weakly negative δ13C values during the Shuram anomaly probably due to inherent flaws in the time reconstruction and the lack of data point in some of the datasets. This is particularly the case in the Brazilian and Canadian sections. However Canada seriously lack data in this very specific interval and the nearly continuous δ13C record in Brazil with values around 0‰ not easily reconcilable with the general trend.
7 Discussion
It is important to realize that there is no common mechanism driving the 87Sr/86Sr and δ13C record and that standard screenings failed to identify major diagenetic overprinting. Diagenesis generally raises Mn contents and 87Sr/86Sr ratios and lowers Sr contents and δ13C as well as δ18O values of carbonate (Brand and Veizer, 1980; Veizer, 1983), also carbonates with Mn/Sr < 10 more often retain primary carbon isotope compositions (Derry et al., 1992; Kaufman et al., 1993; Kaufman and Knoll, 1995), while carbonate with Mn/Sr > 10 and δ18O > −10‰ may exhibit altered C-isotope compositions. Isotopic data used here were screened in original publication and the reader is referred to originally published material for further discussion on diagenetic screening of individual data sets that all pass these standard assessments.
Given the large (3–5 Ma) residence time of Sr in the ocean this study focuses on minimum 87Sr/86Sr values (closest to past coeval oceanic composition) of coherent stratigraphic fragments allowing to overcome diagenetic overprint of specific horizons. The basinal correction (Δ on Fig. 2; see method section) from the averaged Ediacaran trend (Table 1) allows compensating for variation in datasets and best time calibrate all sections. These variations are likely to represent after deposition diagenesis, shifting values throughout individual basin. Another hypothesis would be a diachronic nature of the cap carbonate tie point. This appears less likely as the cap carbonate is synchronous on two continental fragments (Condon et al., 2005; Hoffmann et al., 2004) and probably a third (Bowring et al., 2007).
The Ediacaran 87Sr/86Sr composite record obtained is in good agreement with past studies (Halverson et al., 2007; Jacobsen and Kaufman, 1999; Thomas et al., 2004; Walter et al., 2000) although datasets from individual basin show some variation (Fig. 3A). The composite section on Fig. 3B shows a rise from about 0.707 to 0.7085 throughout the Ediacaran period without individual basinal correction (Δ on Fig. 2). Ediacaran average variation is in the order of 0.00121 from the cap carbonate to the Precambrian/Cambrian boundary tie points (Table 1) with a rise of about 1.30 × 10−05/Ma that is comparable to the 87Sr/86Sr variation throughout the Cretaceous period based on Prokoph et al., 2008 compilation (their Fig. 4, shows a variation in the order of 1.0 × 10−05/Ma in the Cretaceous). Classically the Ediacaran large-scale steady variation is interpreted to be the record of the final stage of the Rodinia breakup and the early amalgamation of Gondwana during the Ediacaran (Halverson et al., 2007). The slow variation in the Ediacaran 87Sr/86Sr record could be the witness of this tectonically (erosion rate related) more quiescent period.
It should be noted from Fig. 3B, that the absence of such a distinctive δ13C long-lived feature in Canada (all positive values (Narbonne et al., 1994)) and Brazil (all negative values (De Alvarenga et al., 2008; De Alvarenga et al., 2004; Nogueira et al., 2007)), and the partial time overlap of positive values in South China (Condon et al., 2005), but see Zhu et al., 2007 and India (that is extremely variable (Kaufman et al., 2006)), argues against a global feature.
Studying these basins in greater detail and chemostratigraphic resolution will help clarify inconsistencies. For example, the Johnny Formation of Death Valley (Corsetti and Kaufman, 2003) and Windermere Group of Canada (Narbonne et al., 1994) excursions are based on < 30 values from up to 2000 m of section. Identification of possible significant time break biasing the chemostratigraphic record as well as potential basin restriction from the global ocean needs to be clarified in all successions. For example the Doushantuo Formation has recently been interpreted to be locally deposited in an alkaline lake (Bristow et al., 2009) and probably stratified water column (Ader et al., 2009. Recent improvement in the Ediacaran biostratigraphy (Grey and Calver, 2007; Shen et al., 2008; Willman and Moczydlowska, 2008) and paleogeography (Li et al., 2008; Pisarevsky et al., 2008) will help resolving uncertainties and refine the chronostratigraphic record.
Ultimately, a demonstrated synchroneity of the Shuram anomaly equivalent excursions on all continental fragments is a fundamental step towards understanding its origin as a primary oceanographic phenomenon. A non-coeval interpretation will clearly point out to diagenetic alteration of the carbonate material and furthermore questions Neoproterozoic global correlation mainly reconstructed from the δ13C record (Halverson et al., 2005; Knoll et al., 2004).
8 Conclusions
The study of different Ediacaran aged 87Sr/86Sr record of several continental masses leads to the following conclusions:
- • A δ13C excursion of the magnitude and duration of the Shuram/Wonoka anomaly, if representative of a primary oceanographic signal, should be coeval in different sections on different continental margins. Indeed it has to be repeated everywhere connected to the global ocean to rule out diachronous diagenetic imprints. Correlations solely based on the sparse available radiometric ages are currently not able to address robustly the synchroneity issue.
- • This study proposes a critical test of this hypothesis by using strontium isotopes as an independent chronometer to better time constrain individual pieces of Ediacaran stratigraphy that otherwise only relies on a few, often weak, radiometric age constraints. This new composite section validates the Shuram/Wonoka excursion reproducibility and synchroneity at the global scale and proposes a negative δ13C shift reaching a nadir > −10‰ around 600 Ma and followed by a steady recovery towards positive values ending around 550 Ma. This negative excursion is recorded in many different basins on several continental fragments (Oman, Australia, Siberia, China, Scandinavia) supporting its origin as a primary oceanographic signal.
- • The Shuram/Wonoka excursion is a secular phenomenon spanning a few tens of millions of years and is therefore representative of the changing global ocean value in steady state condition. The exogenic cycle must have functioned with very different, and currently unrecognized, controls than during the Phanerozoic (Bartley and Kah, 2004) probably involving a large carbon reservoir with much longer residence time (Rothman et al., 2003) or a protracted release of significant light carbon. The strongly negative δ13C excursions (Fig. 1) could imply oxidation of such a large reservoir of organic carbon (Fike et al., 2006; Peltier et al., 2007; Rothman et al., 2003). A primary marine interpretation for this data has significant implications for the interrelationship of evolutionary events and the carbon cycle that has not been fully explored (Peltier et al., 2007) and could record oxidation of this organic carbon reservoir with draw down of atmospheric oxygen. The end of the oxidation event around 550 Ma would allow p02 to build up sufficiently to impact metazoan evolution.
Acknowledgements
Swiss national research project (Number: PBEZ2-115170) is thanked for financial support. Petroleum Development Oman and especially Jan Schreurs are thanked for long time support. This is a contribution to the IGCP-512 project. Anonymous reviewers helped to improve the manuscript.