


 CC-BY 4.0
1. Introduction
Glaciers exhibit highly variable erosion rates, ranging from 10−4 to 101 mm⋅a−1. This significant variability results from various glaciological factors such as basal temperature, subglacial topography, and flow velocity (Sugden and John, 1976; Hallet et al., 1996; Delmas et al., 2009; Herman, Beyssac, et al., 2015). Analysis of catchments of valley glaciers spanning from Patagonia to the Antarctic Peninsula has shown that glacial erosion rates vary from 1 to over 10 mm⋅a−1 for temperate glaciers and from 0.01 to less than 0.1 mm⋅a−1 for cold glaciers, highlighting latitudinal control and climate influence (M. Koppes et al., 2015; Fernandez et al., 2016). Climate variations are affecting glacial and periglacial erosion, which depends on temperature, water availability, and freeze-thaw cycles (Hallet et al., 1996; Godon et al., 2013). Glacial advances are linked to cold and humid periods, but the impact of climatic conditions on glacial erosion rates remains under debate, particularly regarding the interactions between temperature, moisture, and glacier dynamic (Delmas et al., 2009; Herman, De Doncker, et al., 2021).
Glacial cirques are highly sensitive to climate changes (Huss and Fischer, 2016; Schwat et al., 2023). In these environments, two erosive processes coexist: subglacial erosion over bedrock and periglacial erosion processes in the cirque walls (Guillon, J. Mugnier, et al., 2015; Herman, De Doncker, et al., 2021). The moraines of cirque glaciers are mainly composed of materials produced by periglacial erosion processes, then transported and deposited by the glacier (R. J. Small, Clark, et al., 1979; Gomez and R. Small, 1985; Wetterauer, Scherler, et al., 2022). A variable proportion of subglacial sediment can also be deposited within moraines (Reheis, 1975; Anderson, 1978). However, the finest part of the materials produced by subglacial abrasion are generally exported into proglacial streams (N. F. Humphrey and Raymond, 1994; Godon et al., 2013; Herman, Beyssac, et al., 2015; Herman, De Doncker, et al., 2021). As a result, determining the moraine volumes can serve as a proxy for erosion within glacial cirques (Reheis, 1975; Anderson, 1978; Larsen and Mangerud, 1981; Crest, 2017).
Since the Last Glacial Maximum, two periods when glaciers were more extensive than today are particularly well-documented in the Alps: (1) the Little Ice Age (LIA, 1250–1850), representing the final Neoglacial advances (O. N. Solomina et al., 2016), with temperatures approximately 0.5 °C lower than 20th-century averages and more humid conditions (McDermott et al., 1999; J. Matthews and Briffa, 2005; Wanner, O. Solomina, et al., 2011; Magny et al., 2012; Furlanetto et al., 2018; Kaufman et al., 2020; Erb et al., 2022); (2) the Younger Dryas (12.9–11.7 ka BP) (Ivy-Ochs, 2015), characterised by temperatures up to 6 °C below 20th-century averages and drier conditions (Ilyashuk et al., 2009; Shakun and Carlson, 2010; Samartin et al., 2012; Carlson, 2013; Renssen, 2020).
In this context, this study aims to test the influence of climate variations on erosion rates in glacial cirques by comparing the Younger Dryas (YD) and Neoglacial (NG) periods. Our approach is based on analysing moraines built during these glacial stages in high-altitude cirques, with moraine volume serving as a proxy for erosion. We examine moraines from these two periods across twelve glacial cirques with relatively homogeneous characteristics (i.e., exposure, lithology, and geographic location) in the alpine massifs of the Gran Paradiso, Mont Blanc, and Aiguilles Rouges. This analysis allows us to assess the impact of climate parameters on erosion processes in glacial cirques and to highlight the links between climate and erosion.
2. Geological setting
This study focuses on glacial cirques located in the European alpine massifs of the Gran Paradiso, Mont Blanc, and Aiguilles Rouges (Figure 1). The Mont Blanc massif lies at the border between France, Italy, and Switzerland. It belongs to the external crystalline massifs and is primarily composed of Variscan gneiss and granite (Ayrton et al., 1987). The Aiguilles Rouges massif, located to the west of Mont Blanc, is also part of the external crystalline massifs. The Gran Paradiso massif (Italy) is one of the internal crystalline massifs and is primarily composed of gneiss and granite with the presence of schist (Compagnoni and Lombardo, 1974; Brouwer et al., 2002). In these two areas, moraine deposits record two periods of glacial advances (available 10Be surface exposure dating for the study area are presented in Supplement S1): (1) the YD moraines (Protin, Schimmelpfennig, J.-L. Mugnier, et al., 2019; Protin, Schimmelpfennig, J.-L. Mugnier, et al., 2021; Baroni et al., 2021; Serra, Valla, et al., 2022; Serra, Magrani, et al., 2022, Agziou, personal communication), which is the last cooling phase before the Holocene, and (2) the NG moraines, which spans the Late Holocene up to the end of the LIA (Le Roy, 2012; Gardent, 2014; Le Roy et al., 2015). In case moraines were not directly dated using cosmogenic nuclides, their deposition age is attributed to either YD or NG period based on PDD modelling results (Section 3.3) and their relative position compared to other dated moraines (Nicoud et al., 2005).
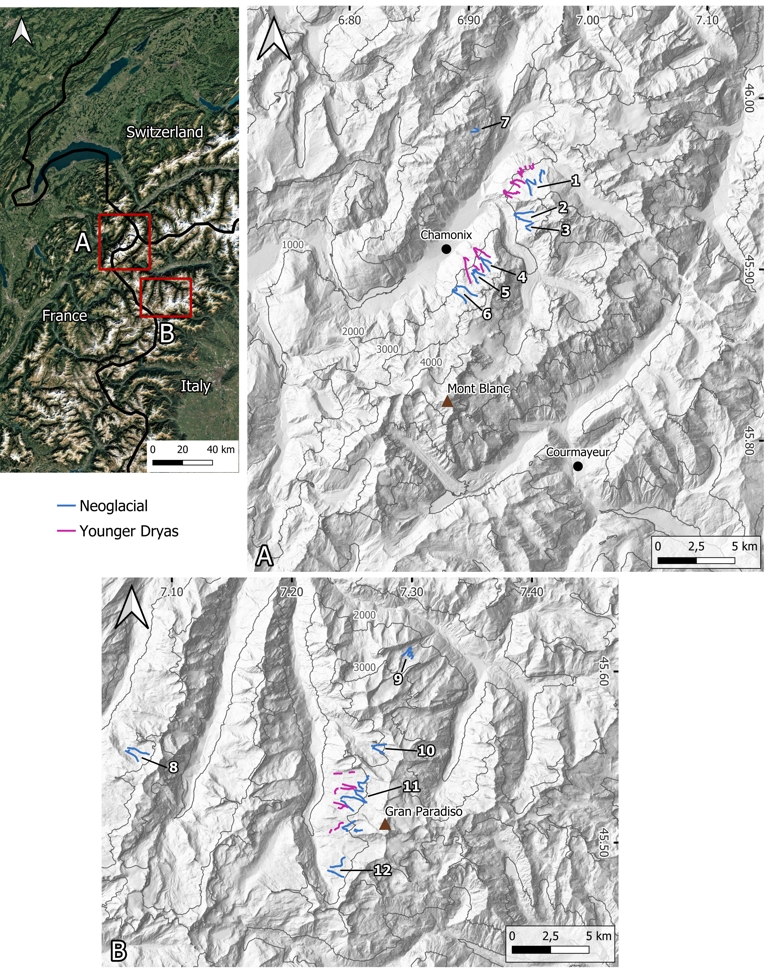
Location of the Mont Blanc and Aiguilles Rouges (A) and Gran Paradiso (B) massifs within the context of the Western Alps, and the studied cirques at the massif scale. (1) Pendant and Lognan; (2) Nant Blanc; (3) Drus; (4) Nantillons; (5) Blaitière; (6) Pèlerins; (7) Remuaz; (8) Invergnan; (9) Trajo; (10) Timorion; (11) Gran Paradiso cirques (including from north to south the Montandayne, Laveciau, and Gran Paradiso glaciers); (12) Monciair.
Based on these previous studies, twelve moraines corresponding to the NG extension were analysed: the junction between the Pendant and Lognan glaciers, the Nant Blanc, the Drus, the Nantillons, the Blaitière and the Pèlerins glaciers in the Mont Blanc massif; the Remuaz cirque in the Aiguilles Rouges massif; the Invergnan, the Trajo, the Timorion, the Monciair glaciers, and the junction between the Montandayne, Laveciau and Gran Paradiso glaciers in the Gran Paradiso massif (Figure 1). These moraines were selected due to their well-preserved morphology, allowing us to determine their respective volumes. To compare the results between the NG and the YD, we studied three glaciers where YD moraines are clearly visible and preserved downstream of the NG moraines (Figure 1): the junction between the Nantillons and Blaitière glaciers and the junction between the Pendant and Lognan glaciers in the Mont Blanc massif; the junction between the Montandayne, Laveciau, and Gran Paradiso glaciers in the Gran Paradiso massif. The limited number of NG and YD moraines included in the study is due to the requirement for well-preserved morphological features, ensuring that the moraines have not undergone significant erosion and allowing reliable volume estimation (see Section 3.1). However, this limited number of moraines is located in a rather homogeneous context, characterised by crystalline lithology and predominantly west- or northwest-facing slopes.
The YD is a cold event dated between 12.9 and 11.7 ka BP, well documented in the Greenland ice stratigraphy (GS-1) (Rasmussen et al., 2006). In Europe, the YD is described as a period that was 2 to 6 °C colder than the 20th-century averages and characterised by reduced precipitation (Ilyashuk et al., 2009; Samartin et al., 2012; Carlson, 2013; Renssen, 2020). In the Swiss and Austrian Alps, the YD corresponds to the moraines of the “Egesen” stadial (Maisch, 1982; Ivy-Ochs et al., 2009).
The NG period follows the climatic optima of the Middle Holocene (Davis et al., 2003; Wanner, Beer, et al., 2008). In Europe, it is characterised by a return to cooler and wetter climatic conditions (McDermott et al., 1999; Vinther et al., 2009; Wanner, O. Solomina, et al., 2011; Magny et al., 2012; Furlanetto et al., 2018; Erb et al., 2022), which fostered several periods of glacial advances (sometimes named LIATEs: Little Ice Age Type Events), mainly the 4.2 ka advance, the Löbben, the Göschenen I and II and the LIA (J. A. Matthews and Dresser, 2008). Temperature anomalies during this period reach approximately −0.5 °C compared to the averages of the second half of the 20th-century (J. Matthews and Briffa, 2005; Kaufman et al., 2020; Erb et al., 2022). Since approximately 5.0 ka BP, alpine glaciers have experienced several phases of advance, with the extent of these advances partly influenced by glacier response times (J. A. Matthews and Dresser, 2008; Ivy-Ochs et al., 2009; O. Solomina et al., 2015).
For our study area, we used two datasets to describe the current climate. (1) Due to the scarcity of data in high mountain regions, we relied on compiled, controlled, and analysed data from 12 meteorological stations (daily temperature and precipitation) located around the massifs, covering the period from 1979 to 2014 (Joly et al., 2017). These data allowed us to calculate altitudinal gradients for temperature and precipitation (S2.1). (2) Interpolated climate data from the CHELSA spatial database (Karger et al., 2017), with a resolution of approximately 1 km, were used to analyse spatial variations in mean annual temperature and precipitation between 1981 and 2010 for the studied glacial cirques.
3. Methods
3.1. Calculation of moraine volume
The boundaries of the moraines were mapped (Figure 2A) using a semi-automatic approach based on a convexity index calculated from a LiDAR DEM with a resolution of 0.5 to 2 m, depending on the available data (S3). This index utilises the Volumetric Obscurance (VO) method, a recent DEM processing technique for characterising landform structures (Rolland et al., 2022; Daynac et al., 2024). By calculating the VO and applying a threshold, concave areas corresponding to the base of the moraines and convex areas to the crests were identified. These boundaries were verified using high-resolution aerial photographs (©ortho IGN) and, in some cases, through direct field observations.
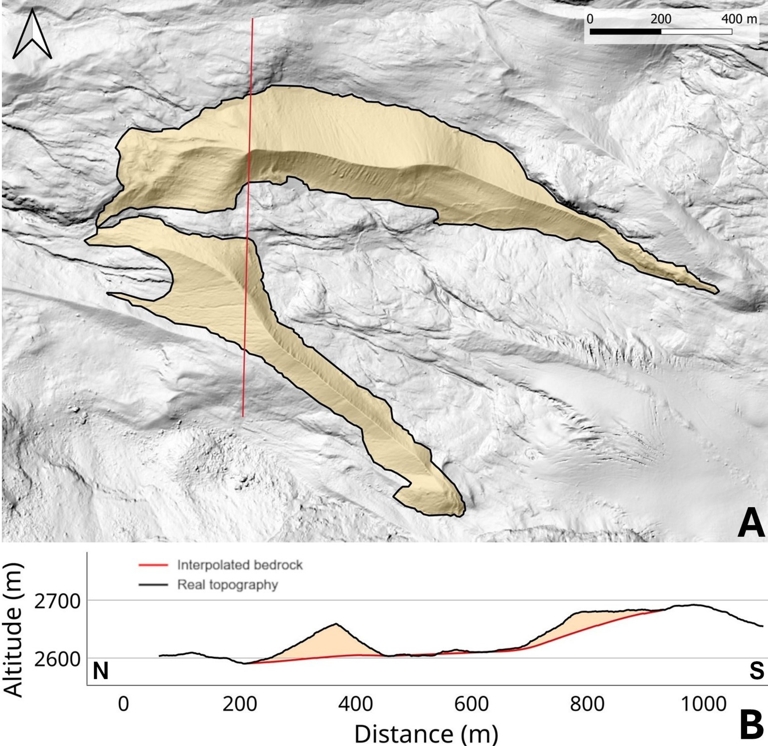
(A) View of the mapping of the surface of a NG moraine from the Laveciau glacier (Gran Paradiso) on a shaded DEM. (B) Cross-section showing in yellow the volume of the moraine calculated between the actual topography (black line) and the interpolation (red line).
The mapped moraines edges were then used to calculate the moraine volumes by reconstructing the bedrock surface beneath the moraines. Along the moraine boundaries, elevation points were extracted every 2 m, and a spline interpolation method, “thin plate splin” of the Saga toolbox in Qgis (Donato and Belongie, 2002), was applied to reconstruct the bedrock surface (Crest, 2017). This method generates a relatively flat surface (Figure 2B), representing a topographic model of the bedrock. The volume between the LiDAR DEM (corresponding to the moraines) and the reconstructed bedrock was then calculated for each moraine (Tables 1 and S6-1). This approach is applicable to all studied moraines, as the geomorphology of the bedrock surrounding the moraines shows no significant relief variation because the moraines are located on glacial polished surfaces below the Last Glacial Maximum (LGM) trimline (Coutterand and Buoncristiani, 2006; Salvatore et al., 2021).
Values of the constants used to calculate the denudation rates in glacial cirques
| Bedrock density 𝜌b | Moraine density 𝜌m | Maximum time NG | Minimum time NG | Maximum time YD | Minimum time YD |
|---|---|---|---|---|---|
| 2700 kg⋅m−3 | 2025 ± 135 kg⋅m−3 | 5000 years | 2500 years | 2400 years | 1200 years |
To estimate the error between the calculated and real moraine volumes and to select the most appropriate interpolation method, we simulated a moraine surface on a large polished bedrock area in the Aiguilles Rouges massif (S4). Several interpolation methods (kriging, IDW, multilevel B-spline, and thin plate spline) were tested to generate an interpolated bedrock model on the simulated moraine surface, following the method described above. For each interpolation method, the volumes above and below the real polished bedrock topography were computed by multiplying the altitude difference (S4-1) between the two surfaces by the cell resolution. The closer the two volume estimates are, the better the bedrock modelling is. The smallest discrepancy, approximately 7%, was achieved using the “thin plate spline” interpolation tool from the SAGA toolbox in QGIS (Donato and Belongie, 2002). Therefore, this tool was selected to create the bedrock model beneath all studied moraines, and the 7% value was adopted as the uncertainty associated with moraine volume calculations.
3.2. Definition of erosional surfaces and calculation of denudation rates
The catchment corresponding to each moraine (NG or YD) was calculated by delineating water flow lines from the DEM (“channel network” of the Saga toolbox in Qgis). Then, the ridge lines separating the flow lines were precisely extracted by thresholding the convexity index calculated using the VO method on the DEM. For each catchment, geomorphological and climatic parameters were extracted: real surface area (taking slope into account), minimum, maximum, and average altitudes, relief (difference between maximum and minimum altitude) median slope, as well as average annual temperature and precipitation (Tables S5-1 and S5-2). The sediment source area corresponds to the entire catchment, considering that the sediments stored in the moraines can result from both periglacial erosion processes and glacial erosion processes (Reheis, 1975; Anderson, 1978; Bennett and Glasser, 2011).
The denudation rates were calculated from the volume of the moraines, the production area, and the time of moraine formation (Equation (1)).
| (1) |
The surface used for this calculation is the real surface area of the catchment, obtained from the DEM using the cosine of the slope for each cell. This volumetric approach does not account for the suspended and bed loads exported in proglacial streams; thus, the calculated denudation rates represent minimum values for the studied glacial cirques and may underestimate the actual denudation.
We estimated the bulk density of the moraine material and the time of formation of the moraines (Table 1). The Gran Paradiso and Mont Blanc massifs consist predominantly of granite and gneiss, leading us to choose a bedrock density of 𝜌b = 2700 kg⋅m−3. Moraine density is often estimated by accounting for a porosity of 20 to 30% (R. J. Small, Beecroft, et al., 1984; Curry et al., 2006), resulting in densities ranging from 1890 to 2160 kg⋅m−3. A density of moraine sediments of 1926 kg⋅m−3 was measured by Altmann et al. (2020) in the Kauner Valley (Austrian Alps, crystalline rocks). Based on these values, we adopted a mean moraine density value of 𝜌m = 2025 ± 135 kg⋅m−3.
During the YD and often during the Early Holocene (EH), glaciers experienced phases of advance or stagnation with some minor fluctuations (Ivy-Ochs et al., 2009; Braumann et al., 2021). Moraines from these periods are documented in the Gran Paradiso and Mont Blanc massifs through 10Be surface exposure dating (Protin, Schimmelpfennig, J.-L. Mugnier, et al., 2019; Protin, Schimmelpfennig, J.-L. Mugnier, et al., 2021; Baroni et al., 2021; Serra, Magrani, et al., 2022) but not all studied moraines were precisely dated. Consequently, two extreme hypotheses were considered to calculate maximum and minimum denudation rate values from moraines volume: (1) the formation time of the YD moraines corresponds solely to the YD duration, spanning 1200 years (Ivy-Ochs et al., 2009); (2) the formation time of the YD moraines corresponds to the total duration of the YD and the EH, spanning approximately from 12.9 to 10.5 ka BP (Ivy-Ochs et al., 2009; Ivy-Ochs, 2015; O. Solomina et al., 2015), and corresponding to a period of 2400 years.
For the moraines of the NG, two extreme scenarios were also considered to provide minimum and maximum values of denudation rates. (1) The moraines may correspond solely to the materials eroded during the five phases of glacial advance similar to the Little Ice Age (LIATEs) (J. Matthews and Briffa, 2005; J. A. Matthews and Dresser, 2008). Summing the duration of these five phases (Ivy-Ochs et al., 2009; Le Roy, 2012) yields a minimum formation time of 2500 years. (2) Alternatively, the moraines may include all erosion products deposited during the NG, if the materials eroded during retreat phases were subsequently transported by the glacier during the following advance phases. Considering this scenario, the formation time of the moraines would span 5000 years, corresponding to the maximum duration of the NG in the Alps (J. A. Matthews and Dresser, 2008; Ivy-Ochs et al., 2009; O. Solomina et al., 2015).
As a result, denudation rates vary by a factor of two for both periods between the two extreme assumptions.
3.3. PDD glaciological model used for paleoclimate calibration
The respective extents of the YD and NG periods for the glaciers were mapped in both massifs using a chronological framework derived from 10Be surface exposure dating (Protin, Schimmelpfennig, J.-L. Mugnier, et al., 2019; Protin, Schimmelpfennig, J.-L. Mugnier, et al., 2021; Baroni et al., 2021; Serra, Magrani, et al., 2022) and geomorphological studies (Ayrton et al., 1987; Gardent, 2014). Using high-resolution LiDAR DEMs (S3) from the Mont Blanc massif, we synthesized the geomorphological mapping of moraines representing the glacial extents of the YD and NG periods onto a DEM with a greater precision than previous studies, resulting in a new geomorphological map that improves upon previous reconstructions (Portal and Buoncristiani, 2024).
The PDD (Positive Degree Day) glacier model calculates a glacier’s mass balance based on annual positive temperatures, using specific melting factors for snow and ice, while incorporating constraints related to basal ice shear on the topography (S2.2) (Paterson, 1994; Harper and N. Humphrey, 2003; Blard et al., 2007; Heyman et al., 2013; Protin, Schimmelpfennig, J.-L. Mugnier, et al., 2019). The parameters of the PDD model were calibrated using current climatic data from 1979 to 2014 (S2.1) (Joly et al., 2017) and present-day glaciological data (S2.3) (Six and Vincent, 2014; Réveillet et al., 2017; Protin, Schimmelpfennig, J.-L. Mugnier, et al., 2019). The following climatic variables were incorporated in the model: monthly mean temperatures and their standard deviation, monthly altitudinal gradients of temperature, monthly mean precipitation, and the annual altitudinal gradient of precipitation. In the PDD model, spatial variations in temperature and precipitation, as well as temperature and precipitation gradients, are assumed to remain constant over time. Calibration parameters for these climatic variables were differentiated between the Mont Blanc and Aiguilles Rouges massifs, and the Gran Paradiso massif, reflecting regional climatic variations. The glaciological parameters to incorporate into the model include the Degree Day Factors (DDF) for snow and ice, also assumed to remain constant over space and time. Using this calibrated PDD model, we determined the optimal combination of precipitation and temperature conditions associated with the glacial extents of the NG period (Figure 3A) and the YD period (Figure 3B) by applying variations to the reference climate data. The most relevant precipitation and temperature combinations to obtain the best possible fit with the moraines for each period were chosen by following literature proxies and climate modelling (McDermott et al., 1999; J. Matthews and Briffa, 2005; Rasmussen et al., 2006; Ilyashuk et al., 2009; Shakun and Carlson, 2010; Wanner, O. Solomina, et al., 2011; Magny et al., 2012; Samartin et al., 2012; Carlson, 2013; Furlanetto et al., 2018; Protin, Schimmelpfennig, J.-L. Mugnier, et al., 2019; Kaufman et al., 2020; Renssen, 2020; Erb et al., 2022). However, the glacial extents obtained from PDD modelling do not perfectly match the moraine crests corresponding to the considered periods (Figure 3). This discrepancy can be attributed to several limitations inherent to this simple modelling approach: (1) the Degree Day Factors (DDF) for snow and ice were calibrated using the Mer de Glace and Argentiere glaciers (Section S2.3), both located on the northern slopes of the Mont Blanc massif. These values may therefore be less accurate for glaciers exposed to the south in the Mont Blanc massif and for those in the Gran Paradiso massif; (2) the poorly constrained ice flow modelling, based on thresholding basal shear stress as a function of slope variations, may overly favor ice flow over steep areas; (3) the DEM used was not corrected for recent surface modifications, such as landslides.
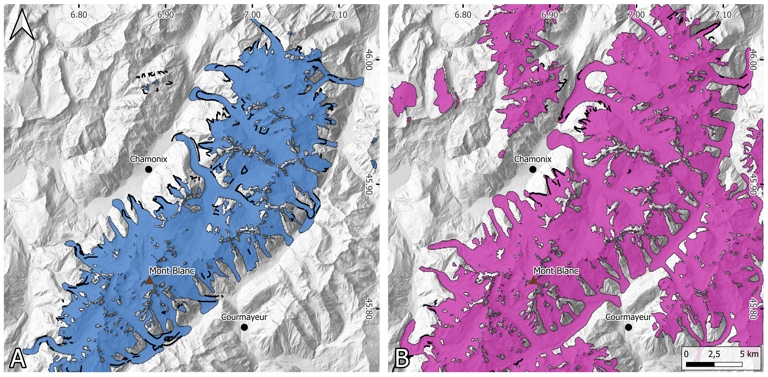
PDD modelling of glacier-covered areas during the Neoglacial (A) and Younger Dryas (B) periods, example from the Mont Blanc massif. The black lines correspond to the moraines from the respective periods.
Thus, the PDD modelling approach enabled us to estimate a cooling of 0.8 °C for the NG period and 4.5 °C for the YD period compared to the 1979–2014 reference period. The precipitation change factor, calibrated against the same reference period, was determined to be 1.2 for the NG and 0.5 for the YD. Our climate calibration indicates a temperature difference of 3.7 °C between the YD and NG, representing a slightly greater cooling than that calibrated by Serra, Magrani, et al. (2022) using a similar glacial modelling approach on the Gran Paradiso massif. They suggested a cooling of 3.1 °C between the two periods when considering half the current precipitation levels for the YD. This discrepancy likely stems from differences in both the models and input climatic data. While our climatic reconstructions rely on more detailed local datasets (see above and Section S2.1), our ice flow dynamic model is based on more simple assumptions.
To assess the spatial variation of temperatures and precipitation during the NG and YD periods, we utilized spatial climate data from the CHELSA database (Karger et al., 2017) for the period 1981–2010. By applying the previously calculated cooling values and precipitation factors to these spatial datasets, we inferred the spatial variations in temperature and precipitation during the NG and YD periods in the Mont Blanc and Gran Paradiso massifs, under the assumption that the present-day spatial distribution mirrored that of the NG and YD, which is probably an approximation (Dumas, 2013).
4. Results
4.1. Volume of moraines during Neoglacial and Younger Dryas periods
The volumes of the NG moraines for the 12 studied glacial cirques vary between 12.95 ± 0.91 and 1.35 ± 0.09 Mm3 (Tables 2 and S6-1). The smallest moraine volume is recorded in the Drus glacier (Mont Blanc massif) and the largest moraine volume is observed in the Gran Paradiso area, encompassing the catchments of the current glaciers of Montandayne, Laveciau, and Gran Paradiso. For the YD period, calculated moraine volumes range from 3.57 ± 0.25 Mm3 for the Pendant and Lognan glaciers to 2.65 ± 0.19 Mm3 for the Gran Paradiso glacier (Table 3).
Main results of the erosion calculation in the glacial cirques during the NG (moraine volumes and denudation rates)
| Cirque (massif) | Moraine volume (106 m3) | Maximum denudation rate (mm⋅an−1) | Minimum denudation rate (mm⋅an−1) |
|---|---|---|---|
| Nant Blanc (MB) | 5.22 ± 0.37 | 0.36 ± 0.03 | 0.18 ± 0.03 |
| Nantillons (MB) | 5.81 ± 0.41 | 0.90 ± 0.09 | 0.45 ± 0.09 |
| Blaitière (MB) | 3.72 ± 0.26 | 0.41 ± 0.04 | 0.20 ± 0.04 |
| Pèlerins (MB) | 7.62 ± 0.53 | 0.38 ± 0.04 | 0.19 ± 0.04 |
| Drus (MB) | 1.35 ± 0.09 | 0.27 ± 0.03 | 0.13 ± 0.03 |
| Pendant and Lognan (MB) | 4.51 ± 0.32 | 0.54 ± 0.05 | 0.27 ± 0.05 |
| Remuaz (AR) | 1.69 ± 0.12 | 0.86 ± 0.08 | 0.43 ± 0.08 |
| Gran Paradiso (GP) | 12.95 ± 0.91 | 0.41 ± 0.04 | 0.21 ± 0.04 |
| Monciair (GP) | 4.54 ± 0.32 | 0.62 ± 0.06 | 0.31 ± 0.06 |
| Trajo (GP) | 4.00 ± 0.28 | 0.24 ± 0.02 | 0.12 ± 0.02 |
| Invergnan (GP) | 4.06 ± 0.28 | 0.60 ± 0.06 | 0.30 ± 0.06 |
| Timorion (GP) | 2.39 ± 0.17 | 0.49 ± 0.05 | 0.24 ± 0.05 |
Minimum denudation: t = 5000 years. Maximum denudation: t = 2500 years. Uncertainties take into account the estimated error in moraine volume and the uncertainty in moraine density. MB = Mont Blanc; AR = Aiguilles Rouges; GP = Gran Paradiso.
Main results of erosion calculations in the glacial cirques during the YD (moraine volumes and denudation rates)
| Cirque (massif) | Moraine volume (106 m3) | Maximum denudation rate (mm⋅an−1) | Minimum denudation rate (mm⋅an−1) |
|---|---|---|---|
| Nantillons and Blaitière (MB) | 2.88 ± 0.20 | 0.23 ± 0.02 | 0.11 ± 0.02 |
| Pendant and Lognan (MB) | 3.57 ± 0.25 | 0.35 ± 0.03 | 0.18 ± 0.03 |
| Gran Paradiso (GP) | 2.65 ± 0.19 | 0.10 ± 0.01 | 0.05 ± 0.01 |
Minimum denudation: t = 2400 years. Maximum denudation: t = 1200 years. Uncertainties take into account the estimated error in moraine volume and the uncertainty in moraine density. MB = Mont Blanc; GP = Gran Paradiso.
We compared volumes of moraines between the YD and the NG periods across three glacial catchments. In the cirques of Gran Paradiso, the moraine volume is 2.65 ± 0.19 Mm3 during the YD, compared to 12.95 ± 0.91 Mm3 during the NG. Merged catchments of the Blaitière and Nantillons glaciers yield a moraine volume of 2.88 ± 0.20 Mm3 for the YD, with corresponding NG volumes of 5.22 ± 0.37 Mm3 and 5.81 ± 0.41 Mm3, respectively. Finally, the Pendant and Lognan glaciers present a moraine volume of 3.57 ± 0.25 Mm3 for the YD and 4.51 ± 0.32 Mm3 for the NG. In all cases, the moraine volumes calculated for the YD are smaller than those of the NG, despite the larger catchments surface areas.
4.2. Denudation rates
Using the previously discussed data and the calculated volumes of the moraines (see Sections 3.1 and 3.2), denudation rates for the 12 glacial cirques were calculated (Equation (1)). During the NG, denudation rates ranged from 0.12 ± 0.02 to 0.45 ± 0.09 mm⋅a−1 based on the maximum formation time and from 0.24 ± 0.02 to 0.90 ± 0.09 mm⋅a−1 for the minimum formation time (Table 2).
For the YD, the calculated denudation rates for the three glacial cirques range between 0.05 ± 0.01 and 0.18 ± 0.03 mm⋅a−1 based on the maximum formation time and between 0.10 ± 0.01 and for 0.35 ± 0.03 mm⋅a−1 based on the minimum formation time (Table 3).
When comparing denudation rates for the YD and NG periods in the three glacial cirques where both glacial advances are recorded (Figure 4), YD denudation rates are lower than those calculated for the NG. The differences are the same when considering minimum or maximum denudation rates, since there is a factor of two between these values for each period. In the Blaitière and Nantillons glacial cirques, the YD denudation rate is approximately two or four times lower than NG rates, with a value of 0.11 ± 0.02 mm⋅a−1 compared to 0.20 ± 0.04 and 0.45 ± 0.09 mm⋅a−1 for minimum values. For the Pendant and Lognan glacial cirques, the difference between the YD denudation rate and the NG denudation rate is smaller, i.e. 0.18 ± 0.03 mm⋅a−1 compared to 0.27 ± 0.05 mm⋅a−1 for the minimum values, respectively. Finally, in the Gran Paradiso cirque, the YD denudation rate is around four times lower than that of the NG, with minimum values of 0.05 ± 0.01 and 0.21 ± 0.04 mm⋅a−1, respectively.
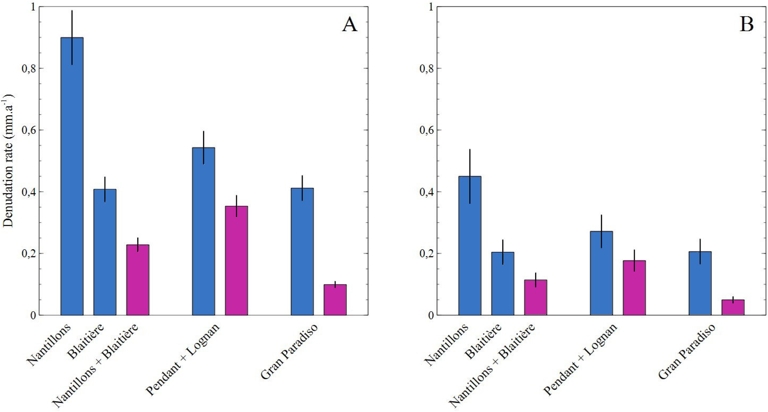
Comparison of the denudation rates calculated for the NG (blue) and the YD (purple) in the three relevant cirques for minimum time hypothesis (A) and maximum time hypothesis (B).
4.3. Climatic parameters correlation with denudation rates
The temperature and precipitation values calibrated using PDD modelling for the NG and YD were averaged for each catchment (Table S5-1) using the CHELSA climate spatial database (Karger et al., 2017). Non-parametric rank correlation tests (Spearman’s rho) were then performed to examine the relationship between climatic parameters, successively, the volumes of the moraines, and the denudation rates. No significant correlation was identified between moraine volumes and climatic parameters. However, a significant positive correlation at the 95% confidence level was observed between climatic parameters (temperature and precipitation) and denudation rates (Table 4). Spearman’s rho value is 0.69 for the correlation with average temperature (Figure 5A, B) and 0.52 for the correlation with average precipitation (Figure 5C, D). These results remain consistent across both extreme hypotheses (minimum and maximum timeframes), despite the two-fold variation in timeframes.
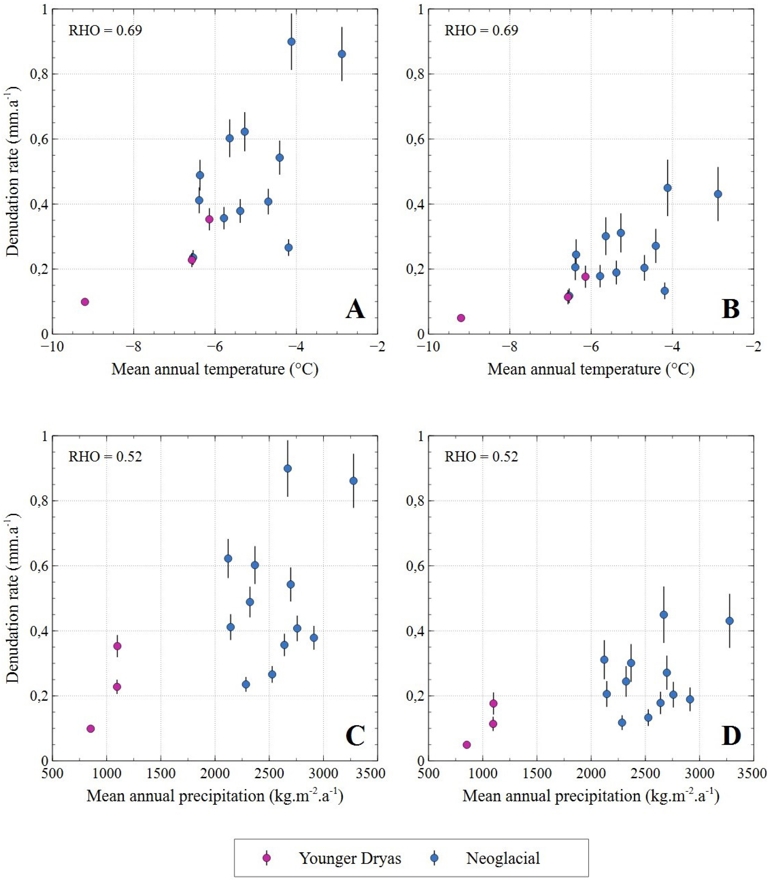
Denudation rates plotted against climatic parameters. (A) Maximum denudation rates against mean annual temperature. (B) Minimum denudation rates against mean annual temperature. (C) Maximum denudation rates against mean annual precipitation. (D) Minimum denudation rates against mean annual precipitation. RHO = Spearman’s rho value.
Results of the Spearman correlation tests between the volumes of the moraines and the denudation rates and the climatic parameters
| Climatic parameter | Moraine volumes | Cirques denudation |
|---|---|---|
| Temperature | 0.01 | 0.69∗ |
| Precipitation | 0.15 | 0.52∗ |
Asterisks indicate significant correlations at the 95% confidence level.
4.4. Correlation between Neoglacial morphological parameters and denudation rates
Spearman’s non-parametric correlation tests were conducted successively between the moraine volumes and the denudation rates with the geomorphological parameters of the catchments for the NG period (Table 5).
Results of the Spearman correlation tests between the volumes of the NG moraines or the denudation rates of the NG and the geomorphological parameters
| Geomorphological parameter | Moraine volumes | Cirques denudation |
|---|---|---|
| Surface area | 0.69∗ | −0.52∗ |
| Minimum altitude | −0.27 | 0.37 |
| Maximum altitude | 0.38 | −0.78∗ |
| Average altitude | 0.34 | −0.22 |
| Relief | 0.39 | −0.79∗ |
| Median slope | −0.04 | −0.21 |
Asterisks indicate significant correlations at the 95% confidence level.
The volume of the moraines only shows a significant positive correlation with the size of the catchment, with a Spearman rho of 0.69 (Figure 6A).
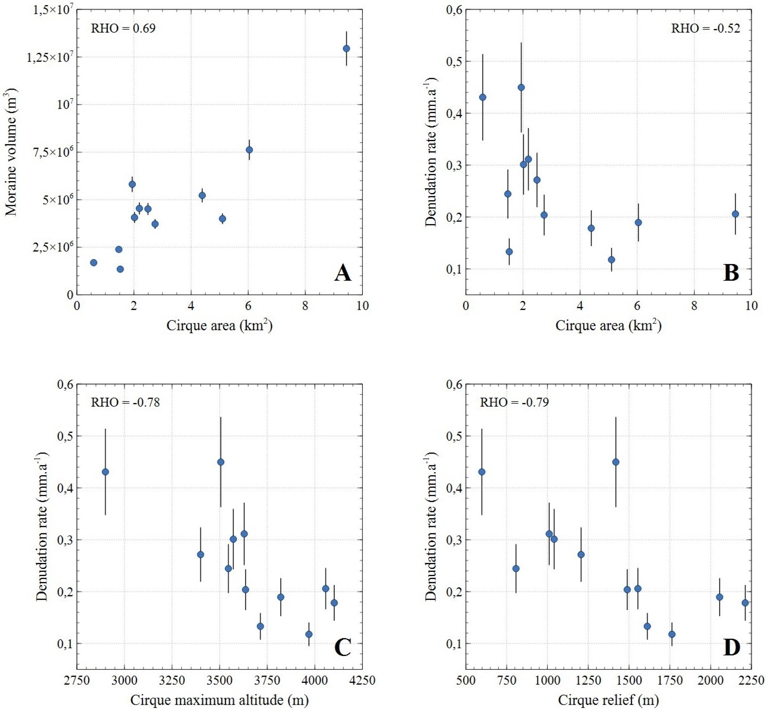
Denudation rates (here minimum values but maximum values would show the same trend) plotted against geomorphological parameters: (A) moraine volumes against cirque area; (B) denudation rates against cirque area; (C) denudation rates against maximum altitude of the cirques; and (D) denudation rates against relief of the cirques.
The denudation rates of the cirques exhibit three significant negative correlations with geomorphological parameters: surface area, maximum altitude, and relief of the cirque. The Spearman rho values are −0.52, −0.78, and −0.79, respectively (Figure 6B–D).
5. Discussion
5.1. Potential issues on denudation rates calculations
5.1.1. Proglacial stream exports
As discussed by Delmas et al. (2009), the fraction of sediment exported via proglacial streams introduces significant underestimation in the interpretation of absolute denudation rates calculated using volumetric approaches. Denudation rates estimated from suspended and bed loads measurements in proglacial streams can span several orders of magnitude (Hallet et al., 1996; Herman, Beyssac, et al., 2015; M. Koppes et al., 2015; Guillon, J.-L. Mugnier, et al., 2018; Jenkin, 2024), including those presented in this study. Consequently, the volume of exported sediment may account for a substantial portion of the total eroded material in glacial cirques. However, estimating average values over millennial timescales remains highly challenging. The absolute denudation rates reported in this study may therefore be significantly underestimated. Nonetheless, relative relationships between denudation rates and other quantitative parameters, such as temperature or precipitation, are likely to remain robust, unless the respective proportions of sediment exported via proglacial streams and that retained in moraines varies markedly among cirques. Such variability may be limited, given the relatively homogeneous characteristics of the studied cirques (i.e., exposure, lithology, and geographic location).
5.1.2. Risk of double counting
Another potential source of error in the calculation of denudation rates is the overestimation of sediment volumes due to the inclusion of material that was originally eroded during an earlier period, left during glacier retreat, and subsequently reworked and redeposited in moraines during a later advance. In our study context, the amount of such reworked older material stored in the analysed moraines appears to be quite limited. The moraines are deposited on polished bedrock, and there are no substantial till deposits within the cirques that could have been remobilized by subsequent glacial advances. Moreover, the maximum time formation hypothesis used to calculate minimum denudation rates assumes that the moraines were formed from material eroded over several advance-retreat cycles, particularly in the case of the NG. This approach implicitly accounts for the possible reworking of previously deposited sediments in the denudation estimates.
5.1.3. Time of moraines formation and paraglacial response
To account for chronological uncertainties in the moraine record, we considered two contrasting time scenarios. The minimum time corresponds to the duration of the YD for YD-related deposits, and to the successive glacier advance episodes of the NG for the NG-related moraines. The maximum time corresponds to the combined duration of the YD and the EH, as several dated YD moraines yield both YD and EH ages. Moreover, the maximum time scenario allows the denudation rate calculations to account for the issue of double counting (see Section 5.1.2) and paraglacial adjustment post-retreat. In small cirques, such paraglacial responses are typically rapid (Church and Slaymaker, 1989; Ballantyne, 2002), and our maximum scenario likely encompasses this effect. However, this approach does not capture potential paraglacial responses acting over longer timescales (e.g., since the Last Glacial Maximum, LGM). If part of the NG headwall destabilization reflects delayed geomorphic adjustments inherited from broader deglaciation, this could partly explain the higher denudation rates calculated for this period compared to the YD. While the maximum time scenario is likely more realistic, using both extreme endmembers provide bounded estimates for denudation rates.
5.2. Climate control on glacial cirques denudation rates
5.2.1. Correlation between climatic parameters and denudation rates
For the three glacial cirques where denudation rates could be calculated for both the NG and the YD, denudation rates were 1.5 to 4.2 times lower than the minimum NG denudation rates. These findings could suggest that erosion in Alpine glacial cirques was more intense during the temperate and humid NG period (−0.8 °C and 1.2 times higher calibrated precipitation relative to the 1979–2014 period) than during the cold and dry YD period (−4.5 °C and half the calibrated precipitation relative to the 1979–2014 period). They also could reflect a long-term effect of the paraglacial response of the post-LGM deglaciation (see Section 5.1.3). Similar results, indicating more efficient erosion during temperate periods compared to glaciated periods, have been observed in glacial cirques using alternative denudation rate estimation methods, such as cosmogenic nuclides (Crest et al., 2017), although without explicit climatic parameters quantification. This type of approach also shows similar results on shorter timescale with increasing erosion rates in glaciated alpine catchments since the LIA (Wetterauer, Scherler, et al., 2022; Wetterauer and Scherler, 2023; Courtial-Manent et al., 2025).
These erosion patterns likely reflect contrasting subglacial and periglacial dynamics, controlled by glacial thermal regimes and frost-cracking processes. During the cold, dry YD climate, glaciers likely developed extensive cold-based surfaces due to a significant lowering of the ELA (Protin, Schimmelpfennig, J.-L. Mugnier, et al., 2019), thereby reducing subglacial erosion processes and protecting the bedrock from erosion (Godon et al., 2013; Herman, Beyssac, et al., 2015). Conversely, during the NG, glaciers had a temperate-type thermal regime, facilitating subglacial erosion processes. Periglacial erosion processes, such as frost-cracking, may also be more limited during the YD compared to the NG in the cirque walls. The altitudinal zone most affected by intense frost-cracking depends on temperature gradient and freeze-thaw cycles within the rock, and the availability of liquid water. This zone varies with climatic conditions and is linked to the state of permafrost (Hales and Roering, 2009; Delunel et al., 2010; Savi et al., 2015; Ravanel et al., 2020; Draebing et al., 2022). During the YD, this zone of active frost-cracking activity may have shifted to lower altitudes than those of the studied cirques, potentially leading to reduced denudation rates in these cirques. This could explain the decrease in denudation rates observed between the NG and the YD in this study. Considering the annual altitudinal temperature gradients used for the PDD modelling (Table S2-3), which are 5.99 °C/1000 m for the Mont Blanc massif and 6.12 °C/1000 m for the Gran Paradiso massif, and the mean annual temperature difference calibrated between these two periods (3.7 °C), the lowering of the frost-cracking window can be roughly estimated at approximately 620 m for the Mont Blanc massif and 600 m for the Gran Paradiso massif. Conversely, current climate change is causing the frost-cracking window to rise. It also affects related processes, such as the frequency of frost occurrence and the altitudes exposed (Pohl et al., 2019), and the degradation of mountain permafrost (Magnin et al., 2017). Consequently, increasing destabilization of high-altitude rock walls in the Mont Blanc massif is already being observed (Courtial-Manent et al., 2025).
5.2.2. Correlation between geomorphological parameters and denudation rates
In glacial cirques, we observed a negative correlation between NG denudation rates and cirque areas (Figure 7). However, several studies suggest a positive relationship between catchment size and glacial erosion rates (Hallet et al., 1996; M. N. Koppes and Montgomery, 2009). This difference could be explained by varying processes between small and large glacial systems, such as importance of subglacial erosion depending on ice sliding velocity and subglacial hydrology, and distinct temporal scales, ranging from a few years to several millennia (Hallet et al., 1996; M. N. Koppes and Montgomery, 2009; Herman, De Doncker, et al., 2021). Furthermore, the catchment surface areas are positively correlated with maximum altitude and relief, with Spearman’s rho values of 0.76 and 0.72, respectively, and could reflect the same trend here.
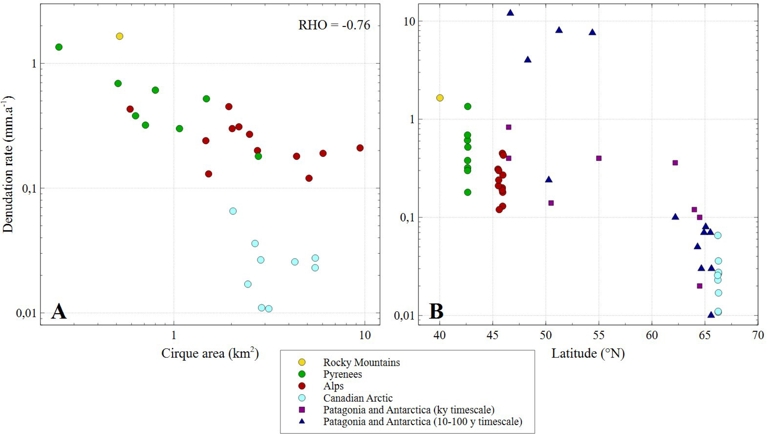
Comparison of denudation rates calculated in glacial cirques based on moraine volumes against: (A) catchment area (logarithmic scale on both axes); (B) latitude (logarithmic scale on the ordinate axis). These calculations assume moraine formation occurred continuously throughout the entire NG period. Data for glaciated catchments of Patagonia and Antarctica have been added for visualization.
NG denudation rates show a negative correlation with maximum cirque altitudes (Figure 5C), suggesting that lower-altitude cirques rock walls experienced more intense erosion during the NG. Assuming a negative altitudinal temperature gradient and a positive altitudinal precipitation gradient (a first-order approximation), our results suggest that temperature exerts a stronger control on denudation rates than precipitation. Additionally, the strong negative correlation between maximum cirque altitude and denudation rates could also indicate that periglacial erosion processes dominate over glacial erosion in forming the studied moraines. This could be due to the altitude-dependent variation of the maximum frost-cracking zone, which is controlled by temperature (Savi et al., 2015).
Our results show that denudation rates decrease as cirque relief increases. While this may seem unexpected at first, our analysis shows that the cirques with the highest relief also have the highest maximum altitudes, with these two parameters being strongly correlated (rho = 0.84). This suggests that maximum altitude is the primary geomorphological factor influencing erosion in the studied cirques, likely due to its relationship with temperature.
5.2.3. Latitudinal variation of cirque denudation rates
To evaluate latitudinal controls on cirque denudation, we compare moraine-derived erosion rates across a climatic gradient, from temperate to polar regions. Our synthesis includes: the Rocky Mountains (∼40° N, Reheis, 1975), Pyrenees (∼43° N, Crest, 2017), and Alps (∼45° N, this study) as mid-latitude benchmarks, contrasted with Arctic conditions on Baffin Island (∼66° N, Anderson, 1978). This ∼26° latitudinal span captures stark differences in glacial/periglacial regime efficiency between temperate and high-latitude environments. The assumptions in these studies align with those used to calculate the minimum denudation rates in this work, considering the moraines formation time to span the entirety of the NG. This duration varies slightly depending on the study area. While cirque areas were calculated by accounting for slope in Crest (2017), Reheis (1975) and Anderson (1978) likely used projected areas, although this is not explicitly stated. If slope had been considered, the calculated denudation rates would have been slightly lower. Across all these datasets, NG denudation rates range from 0.01 mm⋅a−1 to over 1 mm⋅a−1 (Figure 7, Table S6-1).
This comparison leads to two main observations. First, the negative correlation between denudation rates and catchment areas is further strengthened by incorporating additional data, with a Spearman’s rho value of −0.76. Second, denudation rates at high latitudes are one to two orders of magnitude lower than those at mid-latitudes for catchments of comparable surface area (Figure 7A). At mid-latitudes, NG denudation rates range from 0.12 mm⋅a−1 for the Trajo cirque (Alps) to 1.65 mm⋅a−1 for the Arapaho cirque (Rocky Mountains), whereas at high latitudes, they range from 0.01 to 0.07 mm⋅a−1 (Canadian Arctic). Furthermore, Wilcoxon tests show that all latitudinal groups are statistically distinct at the 95% confidence level, except for the single cirque in the Rocky Mountains (Figure 7B).
These results, observed over time scales of several thousand years, highlight variations in denudation rates within glacial cirques that are linked to latitude, potentially reflecting a climate-controlled process. Similar mechanisms as proposed in Section 5.2.1 may also explain the latitudinal variation in denudation rates in glacial cirques. However, other factors influencing denudation rates between these groups, such as lithology, were not tested here and could also play a role. On comparable time scales, similar latitudinal trends have been identified using geophysical data to estimate marine glacial sediment volumes in fjords and bays across Patagonia and Antarctica (Fernandez et al., 2016), spanning approximately 45° S to 65° S. These trends have also been observed over shorter time scales (decades to a century), based on sediment yields from 15 glaciated catchments in the same region (M. Koppes et al., 2015) (Figure 7B).
6. Conclusion
This study investigated the impact of climate on erosion in glacial cirques within the Gran Paradiso, Mont Blanc, and Aiguilles Rouges massifs. Denudation rates were quantified based on moraine volumes and the real surface areas of the cirques. The analysis focused on moraines from two distinct periods: the cold and dry Younger Dryas (YD) and the temperate and humid Neoglacial (NG). A total of three YD moraines and twelve NG moraines were examined.
The main source of uncertainty was the duration of moraine formation. To address this, two extreme hypotheses were considered, allowing for the estimation of minimum and maximum denudation rates. For each period, the results from both hypotheses differed by a factor of two, demonstrating that the relative ranking of denudation rates remained consistent regardless of the time assumption. During the YD, denudation rates ranged from 0.05 to 0.11 mm⋅a−1 for minimum values and from 0.10 to 0.23 mm⋅a−1 for maximum values. During the NG, denudation rates ranged from 0.12 to 0.45 mm⋅a−1 for minimum values and from 0.24 to 0.90 mm⋅a−1 for maximum values. A positive correlation was observed between denudation rates in the studied cirques and mean annual temperature and precipitation. In the three cirques where denudation rates were calculated for both periods, denudation rates were systematically lower during the YD than during the NG. These results highlight those climatic parameters that exert both spatial and temporal control on erosion in glacial cirques, with erosion being significantly accentuated under more temperate and humid climates compared to rather cold and dry climates.
Further investigations could help link these results to the glacial and periglacial erosion processes operating in these environments. For example, the altitudinal shift in the zone of most intense frost-cracking in rock walls may partly explain the differences in denudation rates observed between the two studied periods.
Declaration of interests
The authors do not work for, advise, own shares in, or receive funds from any organization that could benefit from this article, and have declared no affiliations other than their research organizations.
Acknowledgments
This research is part of the MORCLIM project, which received funding from the TelluS program of the Institut National des Sciences de l’Univers, CNRS. The authors thank Florence Magnin for her answers about mountain permafrost. The authors thank the anonymous reviewer for their valuable feedback, which helped improve the quality of this publication.
Vous devez vous connecter pour continuer.
S'authentifier