


 CC-BY 4.0
1. Introduction
The Le Teil earthquake occurred near Montélimar in the lower Rhône valley on Monday, 11 November 2019, at 10:52:45 UTC (11:52:45 local time). This occurrence time is special since it corresponds to the end of the commemoration festivities of the First World War Armistice Day. November 11th is a public holiday that has extended the weekend, making people to be away from home, either outside or in a community hall, to attend the ceremonies or gathered with their families.
From the first automatic localization of the event, the magnitude ML > 5 caused suspicion of damage in the epicentral zone. The magnitude is quickly confirmed by the LDG alert message (ML LDG = 5.4), which does not include information on the depth, this being often poorly constrained. In its detailed data for scientific use, transmitted automatically to the BCSF-Rénass (French Central Seismological Bureau—National Seismic Monitoring Network) at 12:15 local time via a GSE alert message [Global Seismic Exchange; GSE 1997], the LDG proposes a depth of 2 km, fixed by the analyst. At this stage, it is considered with caution because it is estimated with a network whose closest station is located at about 80 km from the epicentre. At 12:16 local time, the BCSF-Rénass sends an automatic information email to the scientific community, local authorities, the media, and over 1000 subscribers of “franceseisme” mailing list. This email is generated for an earthquake with an LDG alert or that is widely felt. It contains the earthquake location, its magnitude, and a link to the dedicated page on the BCSF-Rénass website (http://www.franceseisme.fr), where testimonies are collected and which contains a lot of automated information (alert message, locations, maps of the effects, preliminary macroseismic intensity map, shakemap, etc.).
The scientific community starts a field survey on November 11th with the deployment of temporary post-seismic instrumentation in the epicentral zone and the analysis of the consequences of the earthquake [Cornou et al. 2021]. On November 11th, in view of the damage reported by the population and the media, which indicates that the affected area covers the Montélimar urban area and the surrounding localities (approx. 60 k inhabitants), the BCSF-Rénass decides to activate the Macroseismic Intervention Group (GIM). On November 12th, at 8.30 am, the BCSF-Rénass activates its macroseismic survey via the prefectures of the nine departments around the epicentre, which then ask their 2175 localities to fill in a communal form. The GIM intervenes on the field on November 17th to estimate the shaking intensity in the area affected by the damage.
The objective of this study is to present the collection and analysis of macroseismic data for the 11 November 2019 Le Teil earthquake, and their interpretation in terms of communal EMS98 intensity levels and spatial distribution. After a presentation of the regional context, we present the methods for collecting macroseismic data and their translation into intensity terms. The intensity data and their spatial distribution are analysed and compared with previous regional events or recent similar events.
Source parameters of the 11 November 2019 Le Teil earthquake according to French or International observatories, and specific studies
| Author | Latitude | Longitude | Depth (km) | Magnitude |
|---|---|---|---|---|
| OCA | 44.53° | 4.64° | 3 | 5.2 M |
| OSUG | 44.55° | 4.67° | 0.5 | 5.0 M |
| BCSF-Rénass | 44.53° | 4.64° | 2 | 5.2 MLv |
| CEA-LDG Duverger et al. [2021] | 44.54° | 4.65° | 2 | 5.4 ML |
| EMSC | 44.57° | 4.62° | 10 | 4.9 Mw |
| USGS | 44.61° | 4.64° | 10 | 4.8 Mw |
| Ritz et al. [2020] | 44.518° | 4.671° | 1 | 4.9 Mw |
The epicentre location and Mw estimated by Ritz et al. 2020 are used in this study.
1.1. Earthquake source parameters:
The earthquake locations proposed by the various observatories in the first few hours are scattered over a radius of about 5 km [Cornou et al. 2021]. The depth of the focus varies from 2 to 12 km due to the low density of permanent seismological stations around this area and the uncertainty of the velocity models used [Cornou et al. 2021]. Thanks to Synthetic Aperture Radar (SAR) images acquired by the Sentinel-1 satellite (Copernicus programme) and available from November 12th, InSAR interferograms are calculated from the morning of November 13th and enable the identification of a surface rupture about 4 km long on the Rouvière fault [Ritz et al. 2020; Cornou et al. 2021]. This observation makes it possible to indisputably identify the involved fault, to prove the shallow depth of the hypocentre, to determine the orientation of the rupture, and to give an indication of its dip. In the light of this information, earthquake parameters are further refined with more detailed seismological analyses over the following days. Table 1 gives the source parameters of the 11 November 2019, Le Teil earthquake according to French or International observatories, and other specific studies. The epicentral location (44.518° N and 4.671° E) determined by Ritz et al. [2020], based on a non-linear inversion, and different 1D velocity models, is the only consistent with the surface rupture location and the fault dip to the east. It is used in this article as the reference for the epicentre location.
The Rouvière Fault is located in the northeastern part of the NE–SW oriented Cevennes Fault system, a major regional structural boundary. Despite being bordered by Cevennes and Marsanne left lateral strike-slip potentially active faults, the Rouvière fault was considered inactive [Jomard et al. 2017]. By following the 4.5 km of localized discontinuities on the InSAR images in the field, Ritz et al. [2020] identified evidence of surface ruptures at 17 sites with vertical offsets measured by laser scanner ranging from 2.7 to 13 cm. They correspond to about 45% of the movement observed by InSAR, the rest being distributed over an area of 100 to 800 m wide. These parameters lead the authors to estimate a magnitude Mw between 4.7 and 5.0, in agreement with the estimates derived from the FMNEAR method on seismological records [Delouis 2014], which gives a magnitude Mw of 4.9 and a depth of 1 ± 0.5 km [Ritz et al. 2020; Delouis et al. 2021]. The focal mechanism calculated by the FMNEAR method gives a reverse fault 50/45/89 (Strike/dip/rake) as the optimal solution. Duverger et al. [2021] solution, 47/65/93 (Strike/dip/rake), based on full waveform moment tensor inversions, is close but shows a steeper dip.
The number of aftershocks detected is low. Indeed, around thirty events including only 12 of magnitude >1 and two reaching magnitude between 2 and 3 [Cornou et al. 2021] were recorded up to February 2020. The macroseismic effects of the main earthquake could not be increased by any aftershock, except very marginally at a very short distance.
PGA, PGV, and deduced intensities [using GMICE from Caprio et al. 2015] at the three nearest stations (OGLP, OGDF, BANN) from the epicentre
| Station | Epicentral distance | PGA (cm/s2) [⇒ intensity converted from Caprio et al. 2015] | PGV (cm/s) [⇒ intensity converted from Caprio et al. 2015] | I converted from Caprio et al. [2015] |
|---|---|---|---|---|
| OGLP | 23.5 km south | 6.8 (⇒ I = 1.8) | 1.2 (⇒ I = 4.2) | II to IV |
| OGDF | 32 km east | 4.1 (⇒ I = 1.0) | 0.36 (⇒ I = 2.8) | I to III |
| BANN | 44 km southwest | 4.8 (⇒ I = 1.2) | 0.38 (⇒ I = 2.9) | I to III |
1.2. Ground motion measurements
In addition to the real-time data streams used by the observatories in charge of seismic monitoring, the recordings obtained by the public seismological networks [Résif 1995a,b] were disseminated in open-access and by user-friendly web service on the Résif-Epos data portal (http://seismology.resif.fr) approximately 20 min after the earthquake. The closest public and permanent accelerometer to the epicentre, OGLP (Résif-RAP network), is located at 23.5 km south from the epicentre. The two other closest permanent stations of the Résif-Epos networks, OGDF and BANN, are respectively at 32 km east and 44 km southwest from the epicentre. Table 2 summarizes their recorded Peak Ground Acceleration (PGA), Peak Ground Velocity (PGV), and associated intensities deduced from Caprio et al. [2015] Ground Motion to Intensity Conversion Equation (GMICE).
The ratio PGA/PGV is about 10 which is quite low and indicates a low level of high frequencies. Consequently, the intensities at these stations deduced from PGA, I to II, are lower than from PGV, III to IV. These acceleration or velocity levels are similar to data acquired for earthquakes of comparable magnitude in France [Traversa et al. 2020]. Other private and non-public seismological stations recorded the earthquake at less than 30 km, but these were mostly velocimeters that suffered from varying degrees of saturation effects. Only one accelerometer at 15 km from the epicentre (EDF’s private CRU1 station located at the Cruas nuclear power plant), actually the closest one, was able to record a PGA of 44.5 cm/s2 and a PGV of 1.4 cm/s. They would correspond to Intensity V (value calculated of 4.9 and 4.6, respectively). A velocimeter (IRSN’s ADHE station) at 17.8 km of epicentral distance recorded a PGV of 0.3 cm/s. It would correspond to Intensity III to IV (value calculated of 3.6). The seismograms from these two stations are available to the public on the Résif-Epos data portal [Bertrand et al. 2019].
Because of this sparse data, the acceleration levels that affected the damage area are unknown. The collection and analysis of macroseismic data is, therefore, the only information available to quantify the levels of shaking in the first 40 km, apart from the four measurement points located at more than 15 km from the epicentre (stations CRU1, ADHE, OGLP, OGDF).
2. Context
2.1. Known regional seismicity
The region around the epicentre is classified as a moderate seismicity zone (zone 3) in the regulatory seismic zoning of France. In this zoning, the hazard is represented on a scale ranging from 1 to 5, zone 4 being the strongest in mainland France and zone 5 concerning only the French West Indies. We summarize here the knowledge of the seismicity near the epicentre of the Le Teil earthquake (Figures 1 and 2) from the SisFrance database (http://www.sisfrance.net) until 1961, from the SI-Hex catalogue since 1962 [Cara et al. 2015 and BCSF-Rénass] and from Ritz et al. [2020]. All the magnitude values for earthquakes before 1962 are from Manchuel et al. [2018].
The earliest known evidence of earthquakes in the epicentre region (50 km radius) dates back to the 16th century (Figure 2), but data are limited to a single locality, which is not sufficient to determine the epicentre location. Knowledge of seismicity, based on archives and known historical documents, increases from the end of the 18th century, with a seismic crisis in 1773 when an intensity of VII (MSK64) reached in Clansayes for the 23 January 1773 event (Figures 2 and 8). Another seismic crisis took place in 1873, better known, thanks to richer documentation. It includes two earthquakes reaching intensity VII at Châteauneuf-du-Rhône on 19 July 1873 and at La Garde-Adhémar and Malataverne on 8 August 1873 (Figures 1 and 2). According to the SisFrance database, the epicentres of these two earthquakes are located to the south of the Châteauneuf-du-Rhône village. The estimated magnitudes Mw for these earthquakes remain moderate with a superficial depth, respectively 3.8 ± 0.4, 2 km and 4.1 ± 0.4, 3 km [Manchuel et al. 2018]. The seismicity is characterized by various swarms felt over the historical period (24 in 1873, and 64 in 1933–1936). Recently, two swarms were observed in 2002–2003 to the east of La Garde-Adhémar, with about 50 localized earthquakes. Several events were felt despite their very low magnitude (MLmax = 1.7, the two felt earthquakes being ML = 1.3 and ML = 1.7) because of their extremely shallow depth, down to 200 m [Thouvenot et al. 2009].
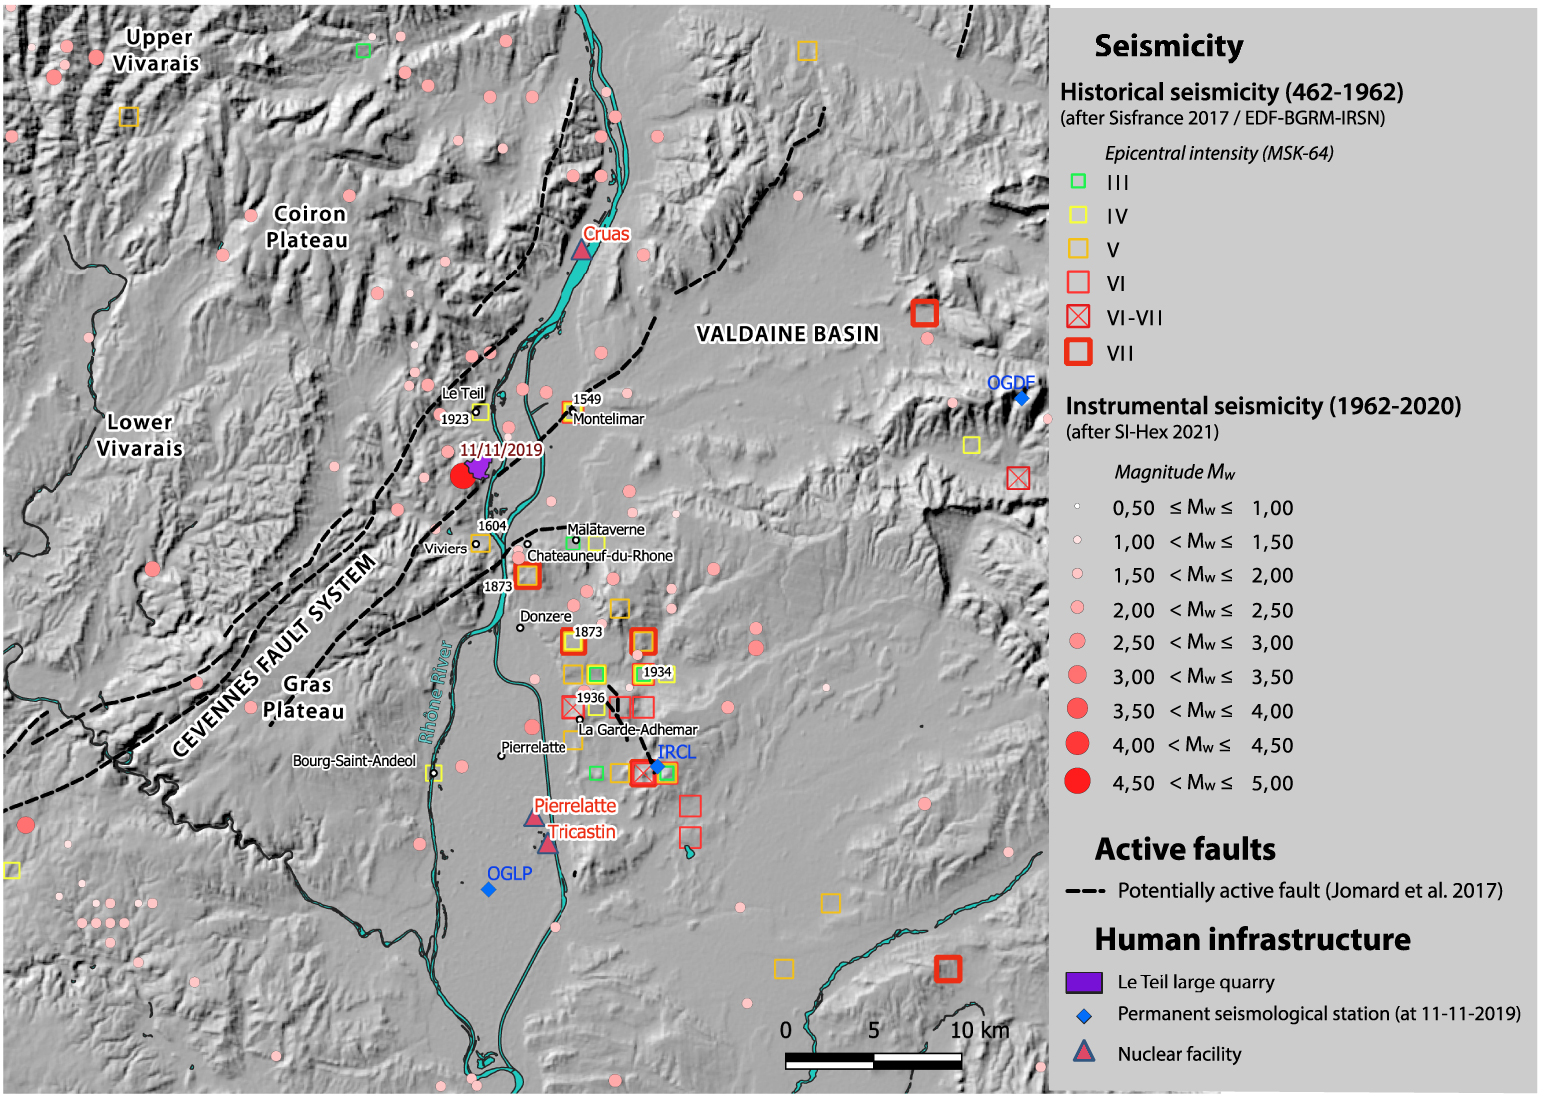
Map of known seismicity in the Le Teil earthquake region. The red dot is the epicentre of the 11 November 2019 Le Teil earthquake after Ritz et al. [2020].
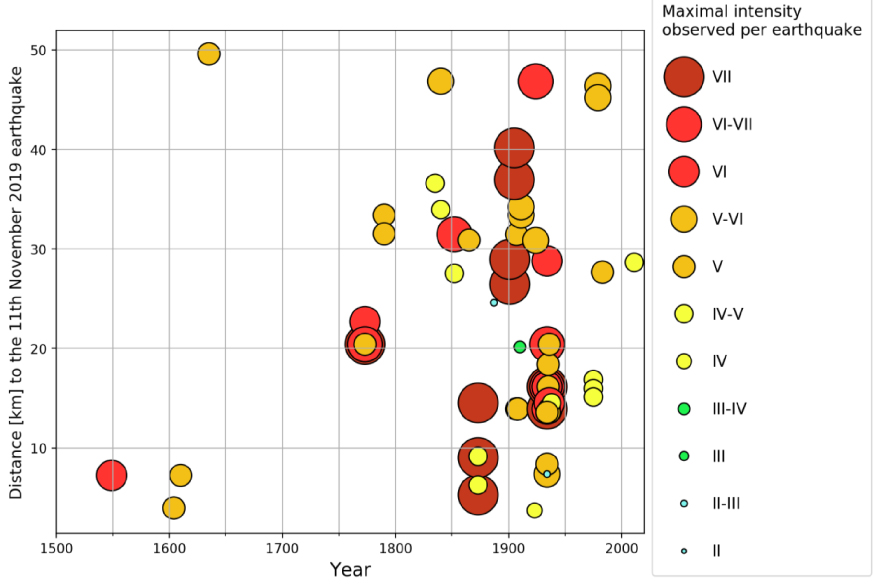
Maximum intensity observed for each known earthquake as a function of time and distance, within 50 km of the 11 November 2019 epicentre.
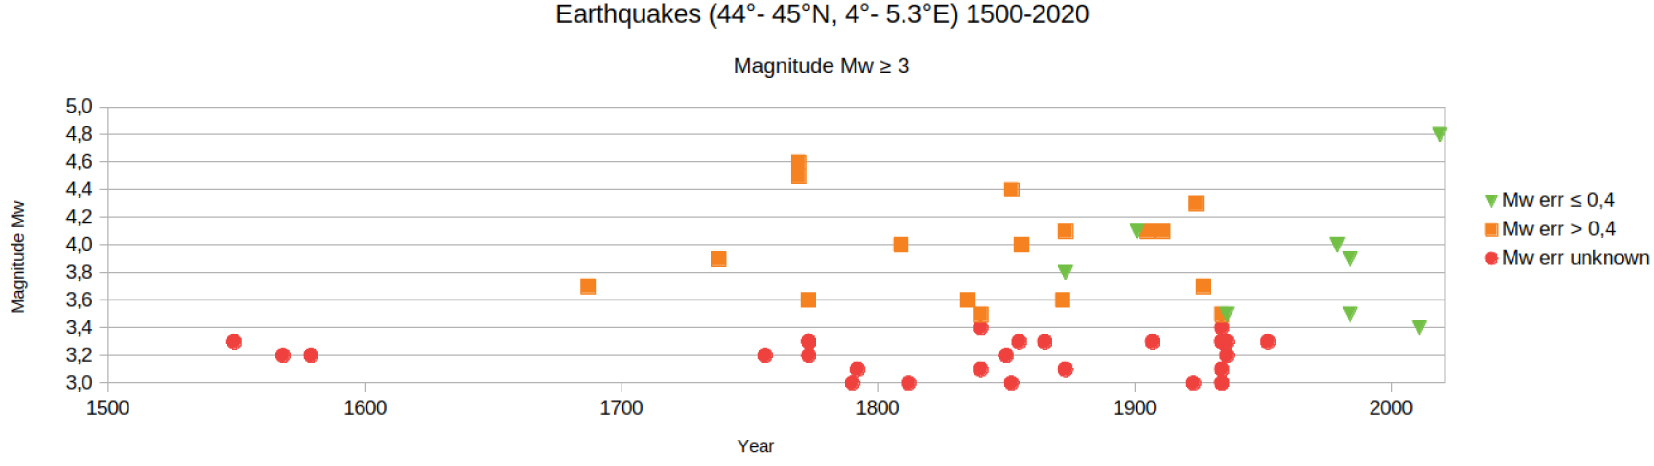
Known seismicity of magnitude ⩾ 3 at epicentral distance ⩽ 50 km, as a function of time and magnitude Mw [from Manchuel et al. 2018 for pre-1962, Cara et al. 2015 for post-1962 and Ritz et al. 2020 for Le Teil 11 November 2019]. The two events in 1769 (Mw 4.5 and 4.6) are at about 53 km to the south from the epicentre and poorly known.
A weak earthquake, felt only in Le Teil (MSK intensity = IV), can be noticed in 1923. No known earthquake has exceeded the MSK intensity of VII. The seismicity recorded since 1962 does not exceed Mw = 3 and over the historical period, only the 1873 and 1936 crises include stronger earthquakes reaching magnitudes of 4.1 ± 0.4 in 1873 and 3.5 ± 0.4 in 1936. The 11 November 2019 Le Teil earthquake is thus the strongest event ever known within 50 km of the epicentre, where the strongest historical event being the earthquake of 8 August 1873, Io MSK = VII, (Mw 4.1 ± 0.4) (Figure 3).
This observation of shallow events, based on well-constrained localization, feeds the debate that superficial seismicity could be a regional characteristic. This was already suggested by Rothé [1936] despite that he could not prove it at that time. The possible relationship between the very shallow depth of the 11 November 2019 Le Teil earthquake and these regional characteristics remains an open question. The influence of a large quarry in the immediate vicinity of the Rouvière fault is one of the hypotheses explaining the triggering and the very shallow focal depth of the focus for the Le Teil earthquake [Delouis et al. 2019; Liang and Ampuero 2020 and De Novellis et al. 2020 and author correction, 2021]. Unfortunately, apart from the Le Teil earthquake and the swarm studied by Thouvenot et al. [2009], the depth of the earthquakes in the region listed in the instrumental catalogues, including the SI-Hex reference catalogue, cannot be considered as reliable data due to the low density of stations and to the distances from the nearest station, often several tens of kilometres.
The origin of some of these earthquakes and tremors is still very much debated with, in some cases, a possible combination of very heavy rainfall and the presence of karst at very shallow depths [Miller 2008; Rigo et al. 2008]. Indeed, in several cases, the observations are limited to a single locality for the historical period, which can be explained either by a major lack of information or by very superficial foci of “seismotectonic” or “seismokarstic” origin.
2.2. Geomorphological and geological context: impact on possible site effects
The epicentre region is crossed by a network of faults running South-West/North-East, known as the Cevennes Fault Zone (Figure 1). It is bordered to the West by the Massif Central and to the East by the Pre-Alps which are separated by the Rhône valley oriented North–South. At the eastern side of the Rhône, the Valdaine plain, about 15 km in diameter, is embedded in the Pre-Alps. The Rhône valley and the Valdaine plain are filled with sedimentary deposits dating from the Pliocene to Quaternary. The pre-Alpine massif, bordering the Valdaine basin, and the area of the Massif Central near the epicentre are made up of limestone plateaus and reliefs dating mainly from the Tertiary period. Volcanic flows dating from the Jurassic–Miocene period are observed to the northwest of the epicentre.
The Massif Central, near the epicentre, is crossed by deep valleys, carved by rivers flowing west to east towards the Rhône. The Escoutay valley runs through the centre of Saint-Thomé and Viviers, bordered by limestone plateaus at north and south. A similar configuration can be observed in the locality of Le Teil, located to the north of the epicentre, along the Frayol valley. The reliefs west of Rhône river are locally steep making a clear limit with the valley like in Le Teil, Rochemaure and Cruas cities. At Saint-Thomé, the historical part of the city is built on a rocky peak.
Another particularity of the region, especially in the Rhone valley, is the presence of a hundred metres deep Messinian palaeo-canyon [Clauzon 1982] filled with Pliocene sediments.
Many of these geographical characteristics could induce various local geologic or topographic site effects, i.e., a modification/amplification of the seismic signal, shaking, and intensity. This has to be taken into account when estimating the intensity value for a city that can be partially affected by site effects.
Another particularity of this sector is the presence of clays close to the surface, inducing a shrink-swell effect in times of drought. This effect was strong enough in 2017 and 2018 to be the subject of natural disaster decrees. We have then to pay attention to possible pre-existing damage when analysing the effects of the Le Teil earthquake.
2.3. Population and specific local industrial characteristics
The most populated city in the epicentre area is Montélimar with about 40,000 inhabitants. The neighbouring towns of the epicentre are smaller with almost 9000 inhabitants for Le Teil, 3700 for Viviers, and 2700 for Châteauneuf-du-Rhône [INSEE 2017]. In total, nearly 110,000 inhabitants are located within a 20 km radius of the epicentre, with an average of only 2300 inhabitants per municipality. The distribution of the population by age is broadly similar to that of the French metropolitan territory (FMT). The population of the locality of Le Teil and its eight neighbouring municipalities is characterized by greater social and economic vulnerability when compared to the FMT population. The rate of executives and intellectual professions is 7.8% compared to 11.5% for FMT, and the rate of workers is 17.5% compared to 14.9% for FMT. For the municipalities with available data, the average net hourly wage is almost 11% lower than the average FMT salary and the poverty rate is slightly higher (15% compared to 14.5%), particularly among homeowners (9% compared to 6.5%) [INSEE 2017].
These different indicators of socio-economic vulnerability could contribute to the vulnerability of some of the buildings due to ageing and/or poor maintenance of buildings.
Outside regional agricultural or industrial activities, the area contains two specific establishments: a wide and deep limestone quarry, located next to the epicentre at the limit between Le Teil and Viviers, and the Cruas nuclear power plant, located at about 14 km north from the epicentre.
2.4. Buildings characteristics and vulnerability by EMS98 class
In the area affected by the earthquake, more than half of the individual houses date from before 1970 and a good third from before the First World War.
2.4.1. Vulnerability A
This class of vulnerability is predominant in the majority of the villages surrounding the earthquake epicentre. In this agricultural area, traditional architecture is closely linked to the natural environment [Carlat 1982]. The traditional Ardèche house is generally composed of a ground floor, often corresponding to vaulted cellars, and a storage area topped by a terrace opening onto the house. The latter includes a kitchen and bedrooms, covered by an attic. The use of wood completes the construction for the floors and roofs. The very old masonry is generally made of pebbles or more worked boulders of various sizes bound together with thick mortar. However, the buildings differ, in form and materials, depending on the location, in particular according to the geomorphology of the place. The old housings of the Bas-Vivarais (see Figure 1 for location) are specific in that limestone is the most common building material, whereas in the Coiron, basalt stones from the volcanic plateau are included in the covering of the building’s external walls. In these two areas, the buildings benefit from chalk, which allows them to be built higher (up to three storeys). The farm buildings, often massive, can in some places be made up of double thick masonry walls filled with all kinds of materials. The roofs, generally not very steep, are covered with grey tiles and do not overhang much, generally on a genoise with two or three rows of canal tiles. In the Rhône valley, on the hillsides in the northern part and in the plain further south, the buildings are generally constructed in limestone or with granite pebbles from the Rhône or its tributaries, sometimes with basalt inclusions. At the same time, in the more northerly areas, it is possible to find brick for the frames and adobe on a granite base for the walls.
Since the 1970s, many old houses have been rehabilitated to make them permanent homes or second homes. The materials used are often different from the original materials, resulting in heterogeneous constructions. Moreover, by modifying openings, making extensions and additions, the vulnerability of these buildings to earthquakes has been significantly increased.
2.4.2. Vulnerability B or C
Since the beginning of the 20th century, masonry houses have benefited from the building materials produced by the Le Teil–Viviers limestone quarry. Floors can be constructed with metal beams and vaults or cast-in-place concrete. The limestone, which is easy to cut, allows for a solid construction in a single volume, with well-prepared blocks, both for the wall ties and for the frames. At the end of the 1960s, building regulations imposed light chaining on masonry constructions, which contributed to a better resistance to earthquakes. Some ancient massive stone constructions, historical buildings from the 19th century or even older, can also be found throughout the epicentral zone.
2.4.3. Vulnerability D
Since the 1990s, the application of earthquake-resistant construction rules has recommended at least vertical reinforced ties for masonry buildings, at least in the projecting and re-entrant angles and on both sides of the joints, and horizontal ties at the diaphragms (foundations, floors, and roofs). In addition, each opening requires a chained frame. Most of the apartment buildings outside the old town’s centre belong to this vulnerability class.
3. Data collection and analysis methods
The BCSF-Rénass has the task of estimating the communal macroseismic intensities for the French territory for any earthquake of magnitude ⩾ 3.7 (ML LDG). To do this, it relies on three components for collecting effects on the macroseismic indicators described by the European macroseismic scale EMS98 [Grünthal 1998]:
- individual forms filled in spontaneously by citizens (public link on http://www.franceseisme.fr),
- communal forms, distributed to the authorities and filled in by the town halls, fire brigades and gendarmeries (private link on http://www.franceseisme.fr),
- field expertise, in the case of significant damage (degree of damage ⩾ 3) with the activation of the GIM.
These methods of collecting and analysing macroseismic data, used at the BCSF-Rénass, are explained in detail in Sira et al. [2021a,b].
In France, and beyond the many scientific uses, the intensity value is ultimately used by the interministerial commission that decides which communes are subject to a natural disaster classification order entitling them to compensation for the victims [Caisse centrale de réassurance 2020]. The mission of the BCSF-Rénass is, therefore, both for scientific and operational purposes.
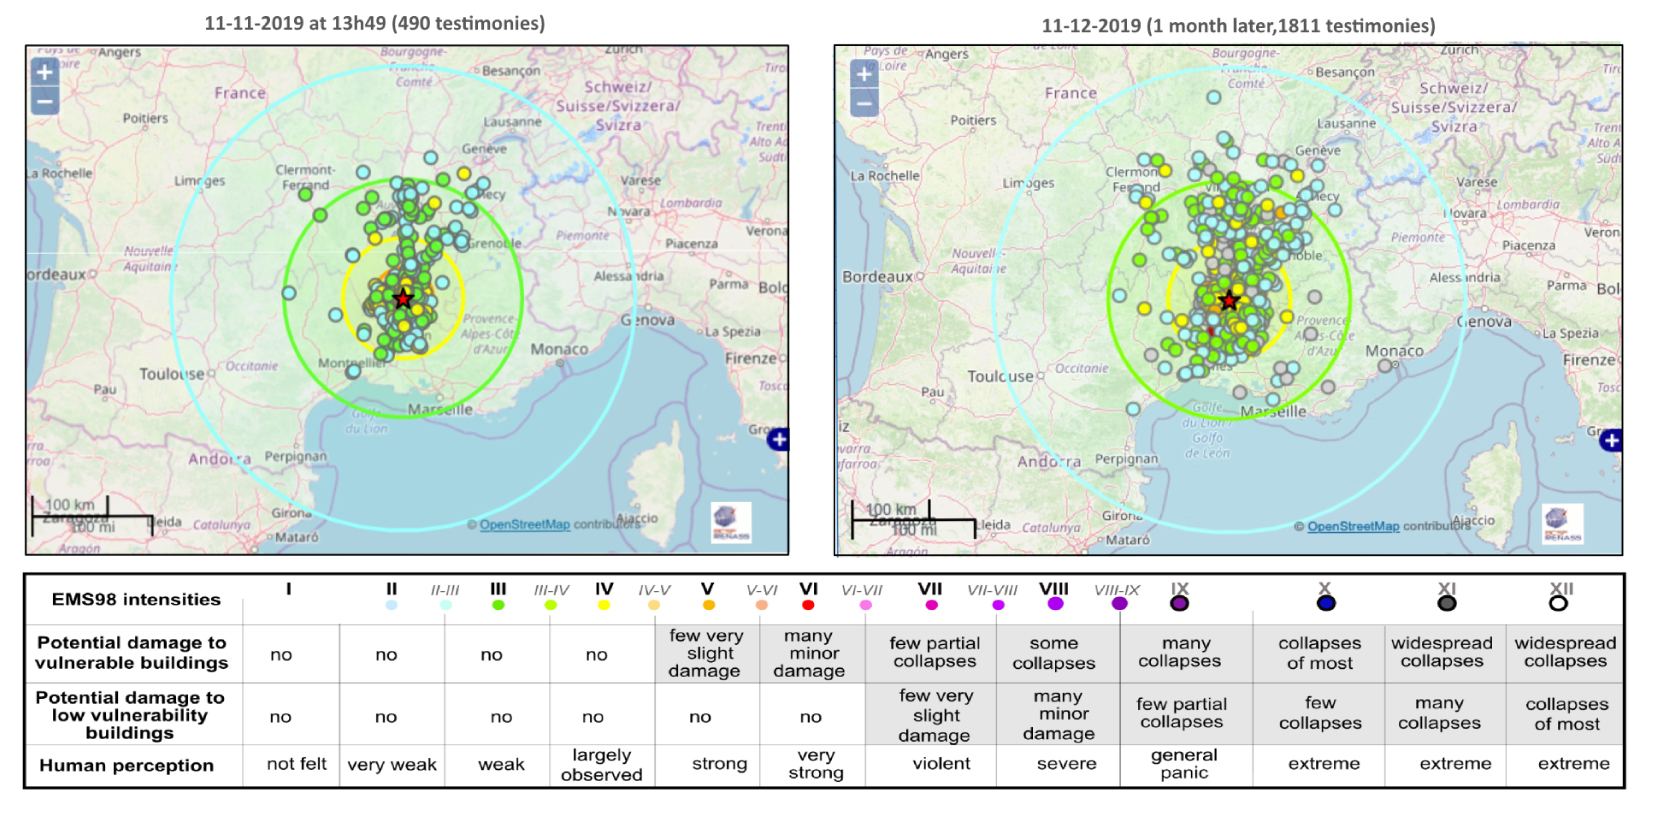
Automatic preliminary mapping of communal intensities displayed on http://www.franceseisme.fr/ for two distinct periods: (left) 2 h after the earthquake and (right) one month later. Each point represents a locality and its colour corresponds to the average of the “individual intensities” collected. The large coloured circles correspond to the intensities calculated using the earthquake magnitude and depth and the Intensity prediction equation (IPE) according to Marin et al. [2004].
3.1. Collection via online forms (individual and communal)
As for any earthquake of magnitude ⩾ 3.7 that has generated an LDG seismic alert, the BCSF-Rénass immediately opens the 11 November 2019 a dedicated page on his website (http://www.franceseisme.fr/) with the instrumental characteristics and direct access to the individual internet form for the collection of testimonies from citizens [Sira et al. 2021b]. In order to solicit these testimonies, a message is posted manually on the “Franceseisme” Twitter and Facebook pages, about thirty minutes after the earthquake, allowing the information to be relayed as widely as possible.
Figure 4 displays the automatic preliminary mapping of communal intensities available on http://www.franceseisme.fr 2 h after the earthquake and one month later. The internet intensity map, based on 490 individual testimonies, is posted there at 13:49 local time. It is seen by nearly 60,000 people on Twitter and 12,000 on Facebook from the 4500 subscribers of each of these networks. In the first 40 min, about 650 individual forms are collected. It is followed by a strong increase with about 200 testimonies within 3 min.
In the first few hours, effects are reported up to 193 km north of the epicentre (Bourg-en-Bresse in the Ain), 150 km west (Le Cayrol in the Aveyron), and 120 km south (Montpellier in the Hérault). At the end, the BCSF-Rénass collected 2094 individual forms, confirming the perception of effects in the north as far as Dijon (Côte-d’Or) at 313 km or Auxy (Saône et Loire) at 271 km, to the west up to 221 km in Etroussat (Allier), to the east up to 214 km in Collonges-sous-Salève (Haute-Savoie), to the south-south-west up to 200 km in Narbonne (Aude), or Marseille to the south at 147 km.
Preliminary communal intensities are automatically deduced from these testimonies when an image summarizing the effects is selected in the individual form and are used for automatic maps [Sira et al. 2021a]. This is the case for 1811 testimonies for the Le Teil event, corresponding to ≈86% of the total testimonies, that were used to calculate 529 preliminary communal intensities. These preliminary communal intensities are of maximum V near the epicentre while important damages (D4 or even D5) have been reported by the media and the authorities. It shows that the preliminary intensities in the epicentral zone, obtained shortly after the event (Figure 4 left) or even one month later (Figure 4 right) do not reflect the level of shaking and they must be interpreted with caution for this earthquake.
Similarly, if we consider only the theoretical intensities based on the source parameters and a default depth of 12 km, as it is not specified in the warning message (large circles on Figure 4, map 13:49 local), it do not suggest intensities higher than VI again not compatible with D4 to D5 damage (Reminder: a single D4 or D5 damage is not taken into account for the EMS98 intensity estimation which is based on a statistical approach). This difference in epicentre area suggests a shallower depth than 12 km, which is confirmed later.
On November 12th, a communal survey, with a dedicated form, is launched by the BCSF-Rénass via the prefectures in nine French departments around the epicentre: Hautes-Alpes, Ardèche, Drôme, Gard, Isère, Loire, Haute-Loire, Rhône, and Vaucluse. It then targets 2175 localities in these departments, enabling to collect 388 communal forms.
Beyond these nine departments, the shaking is reported by Internet users in 12 other departments: Ain, Allier, Aude, Aveyron, Bouches-du-Rhône, Cantal, Côte-d’Or, Hérault, Lozère, Puy-de-Dôme, Savoie, and Haute-Savoie.
3.2. Shakemap combining instrumental observations and preliminary macroseismic data
Shakemaps are automatically calculated by the BCSF-Rénass from instrumental and macroseismic data for any earthquake subject to a seismic alert (if LDG magnitude ⩾ 3.7 in metropolitan France). The calculation is based on the USGS ShakeMapTM program version 3.5 [Wald et al. 1999; Worden et al. 2020]. Results are published on http://www.franceseisme.fr website. The first one, produced 29 min after the earthquake, is based on 335 observation points, including 182 preliminary communal intensities deduced from internet testimonies and 153 instrumental measurements available in real time at the BCSF-Rénass. However, in the first 50 km around the epicentre, if 96 preliminary communal intensities are available (we have at the end 233 in this zone), there are only four permanent stations, the closest at about 23 km. In the first 24 h, the shakemaps are upgraded 12 times as the number of testimonies increases [Schlupp et al. 2021].
If the first shakemap is informative, it suffers from several limitations in the case of the Le Teil earthquake. The epicentre is the one broadcasted in alert mode by the LDG without information on the depth, so we consider a 12 km default depth. The shallow depth of the Le Teil earthquake is only known later, particularly thanks to radar interferometry images indicating a rupture propagating on the surface. This is a rare case in France, and it also made it possible to constrain the various locations and inversions of the source by the seismological observatories, the LDG warning location being about 7 km further east. As the hypocentre is fixed in the calculation procedure, this shift has an important effect on the shakemap calculated in the epicentral zone.
The final shakemap shown on Figure 5, calculated after one month, is based on BCSF-Rénass relocated hypocentre. It includes 682 calibration points of which 529 preliminary communal intensities estimated from 1811 testimonies and 153 values deduced from instrumental records. Figure 6 presents the distribution of intensities according to the distance to the epicentre together with Marin et al. [2004] IPE law. Both figures confirm that the internet intensities for this earthquake underestimate the ground motion. A zoom on the epicentral zone shows that almost all the intensities deduced from the internet testimonies are rejected (see small circles on Figure 5 that are outside the attenuation law ±3 sigma after bias correction on Figure 6) and that the expected intensities from attenuation law are VI and higher. This last shakemap is very close to the one available on November 17th, just before the GIM fieldwork, as we had already collected 96% of the testimonies.
We also observe a peculiarity that we had never observed on the shakemaps calculated since 2016 in France. There is a strong discrepancy between the instrumental data and the preliminary, weaker macroseismic data, up to more than 150 km from the epicentre for all the shakemaps produced (from the first version until the last version calculated after a month) using internet testimonies (Figures 5 and 6). While it is typical to observe a discrepancy between preliminary intensities based on internet reports and intensities from detailed surveys, including a probable underestimation of intensities VI and above, this should be limited to the epicentre area only. It should not, a priori, come from the conversion between instrumental measurements and GMICE intensities [Caprio et al. 2015], which has been used for more than 1500 shakemaps for about 125 earthquakes since 2016 without observing such discrepancy.
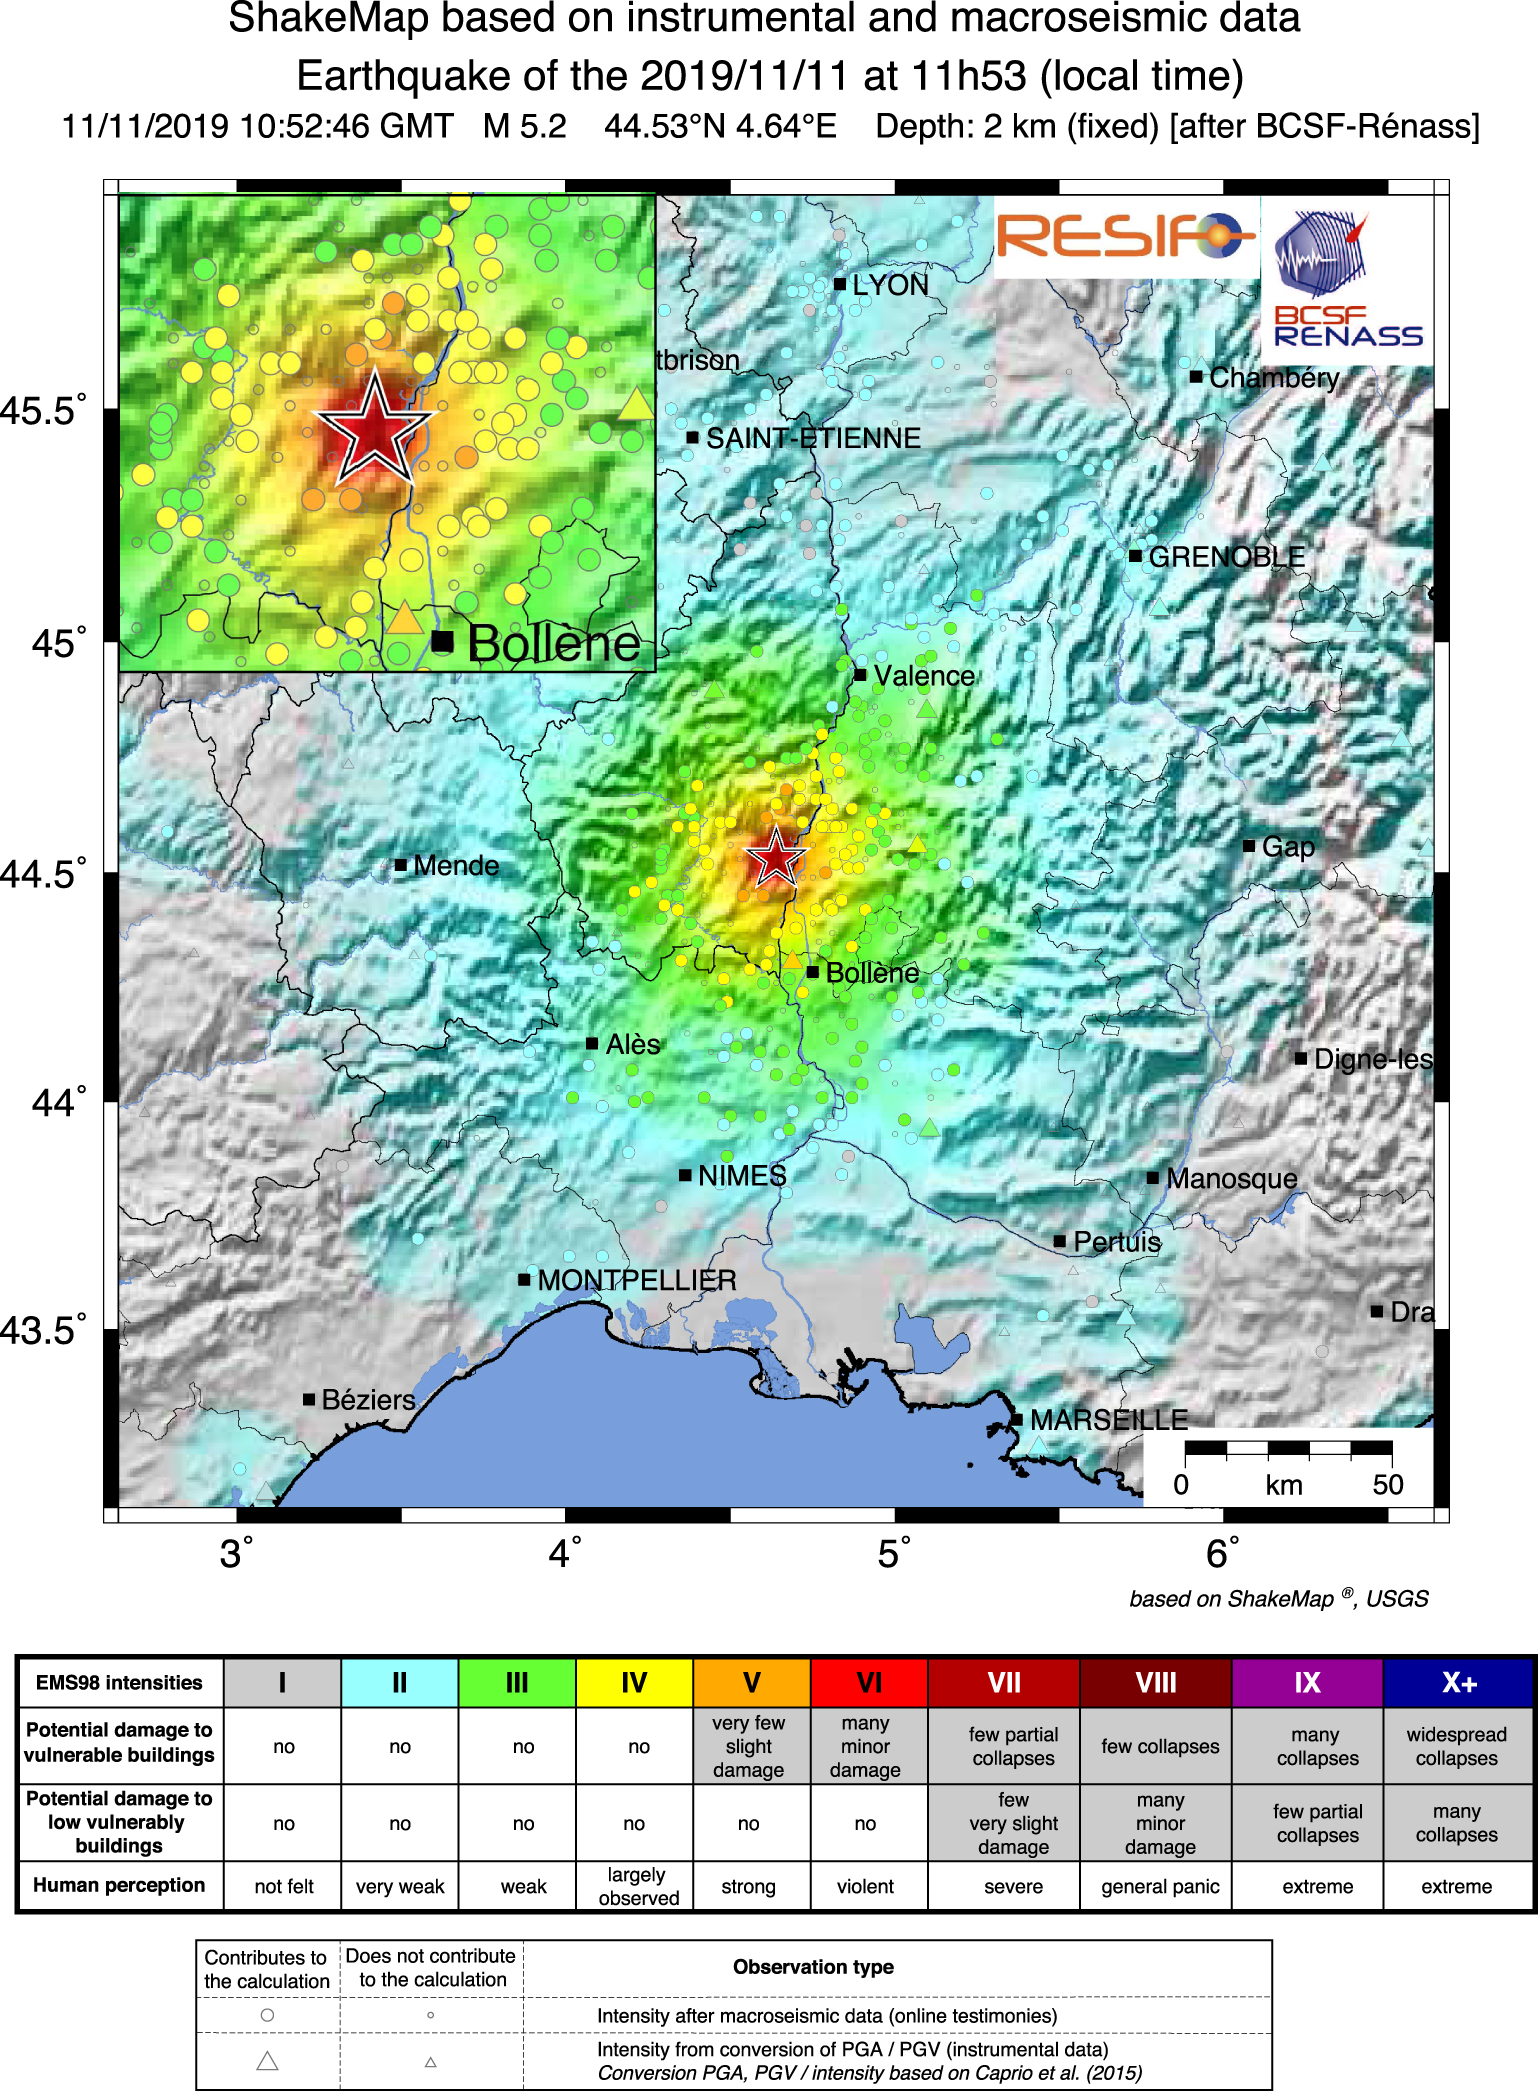
Shakemap of Le Teil event based on instrumental and on preliminary intensities deduced from the 1811 individual testimonies with a selected image. The small circles are the rejected intensities as they are too far from the model (see discussion in text and Figure 6). Hypocentre is after BCSF-Rénass, the shakemap is calculated at 11 December 2019.
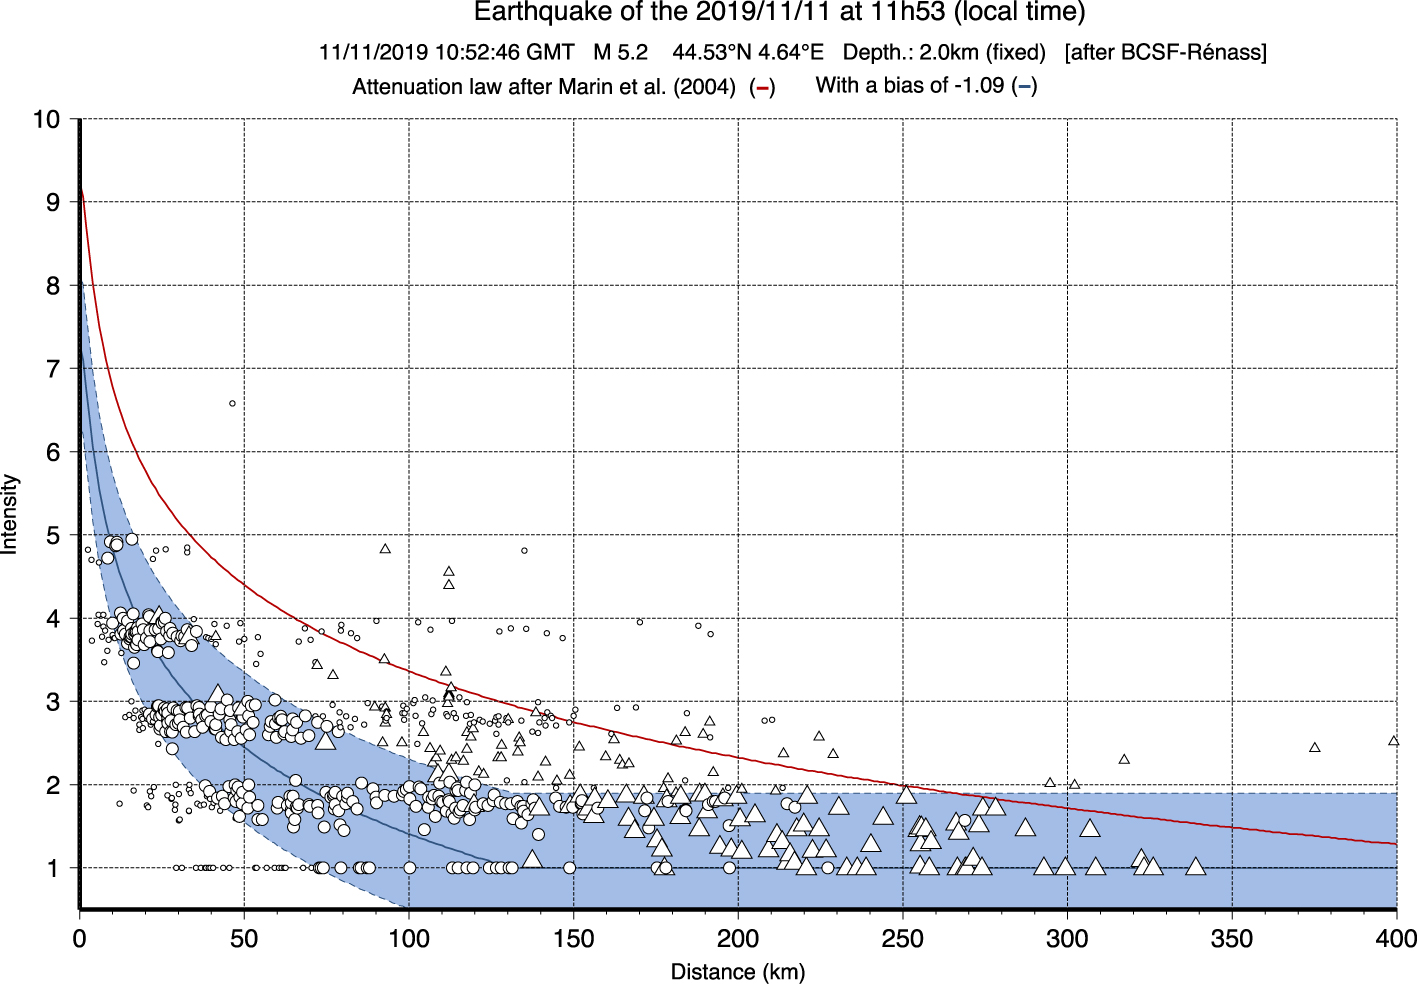
Magnitude “bias” correction used for the processing of the shakemap: regression between instrumental data (triangles) converted into intensity using Caprio et al. [2015] GMICE, macroseismic (circle) data and ground motion models (red = Marin et al. [2004] IPE with M = 5.2, dark blue = Marin et al. [2004] IPE after magnitude adjustment of −1.09 for minimum RMS). The instrumental data give higher values than the preliminary communal intensities derived from witness testimony only (see text). Small circles or triangles are data outside the attenuation law ±3 sigma after bias correction (light blue zone). Masquer
Magnitude “bias” correction used for the processing of the shakemap: regression between instrumental data (triangles) converted into intensity using Caprio et al. [2015] GMICE, macroseismic (circle) data and ground motion models (red = Marin et al. [2004] IPE with M = 5.2, ... Lire la suite
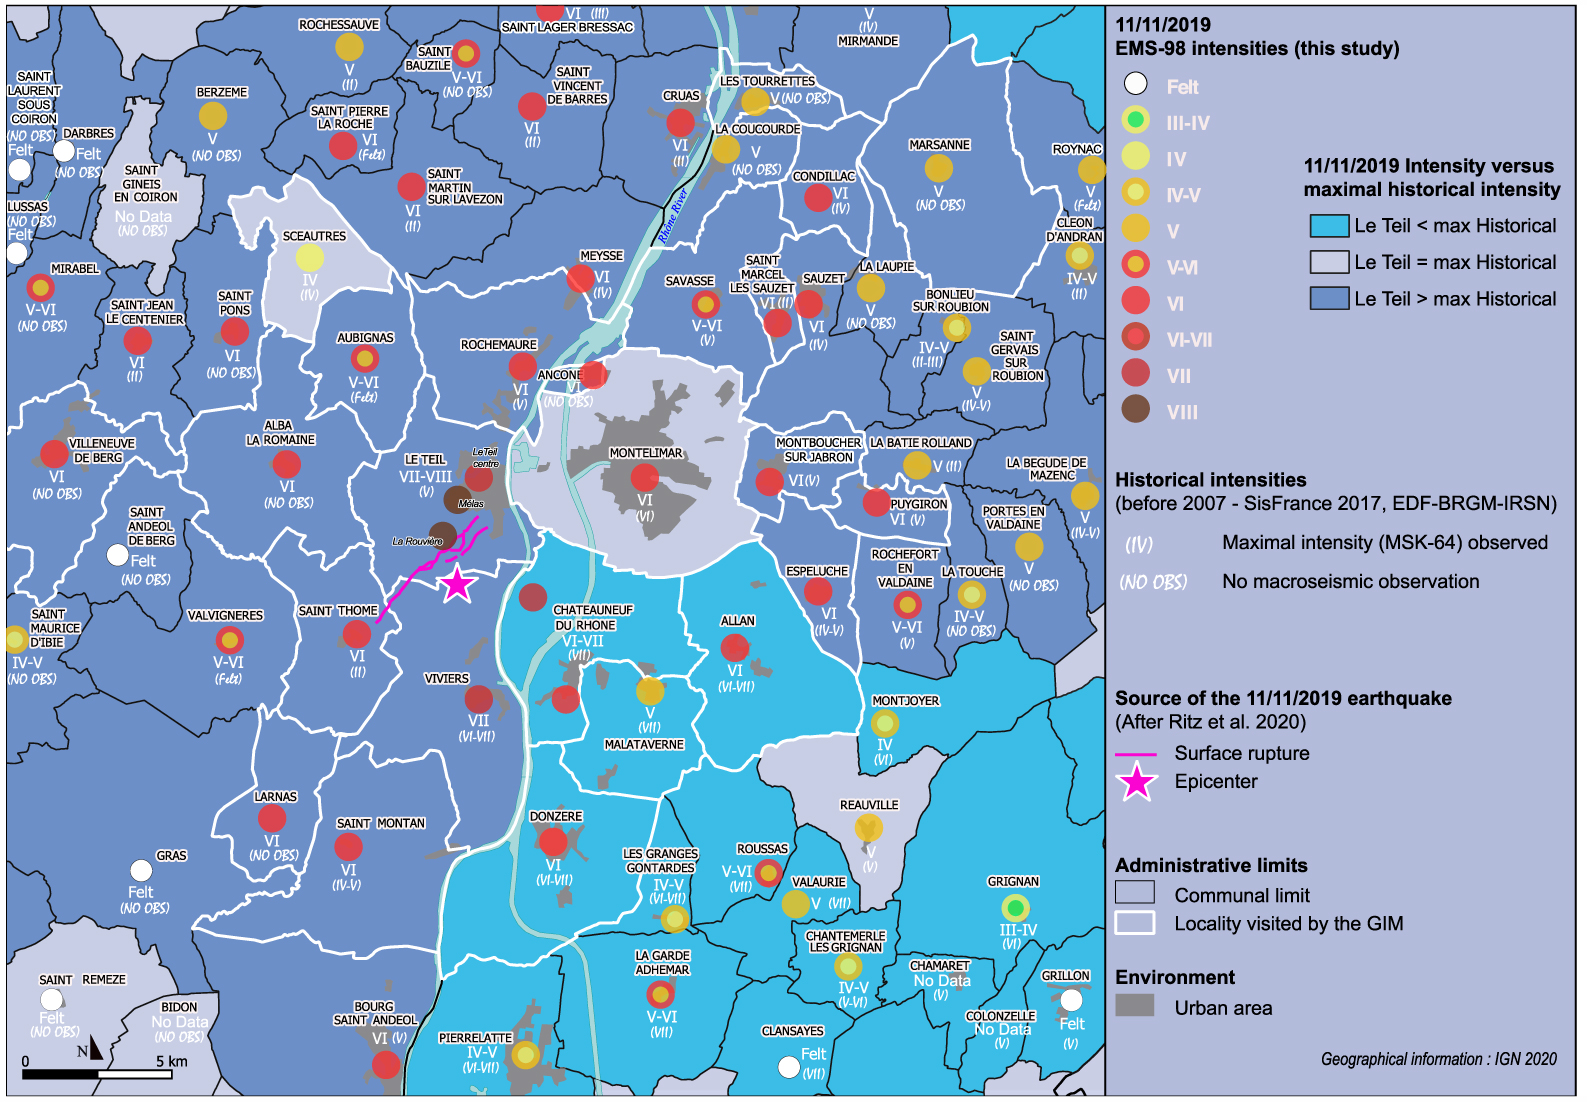
Final map of EMS98 communal intensities of the epicentral zone during the Le Teil earthquake and comparison with the maximum known historical intensities (MSK) before 2007 (no earthquake has affected the zone since 2007).
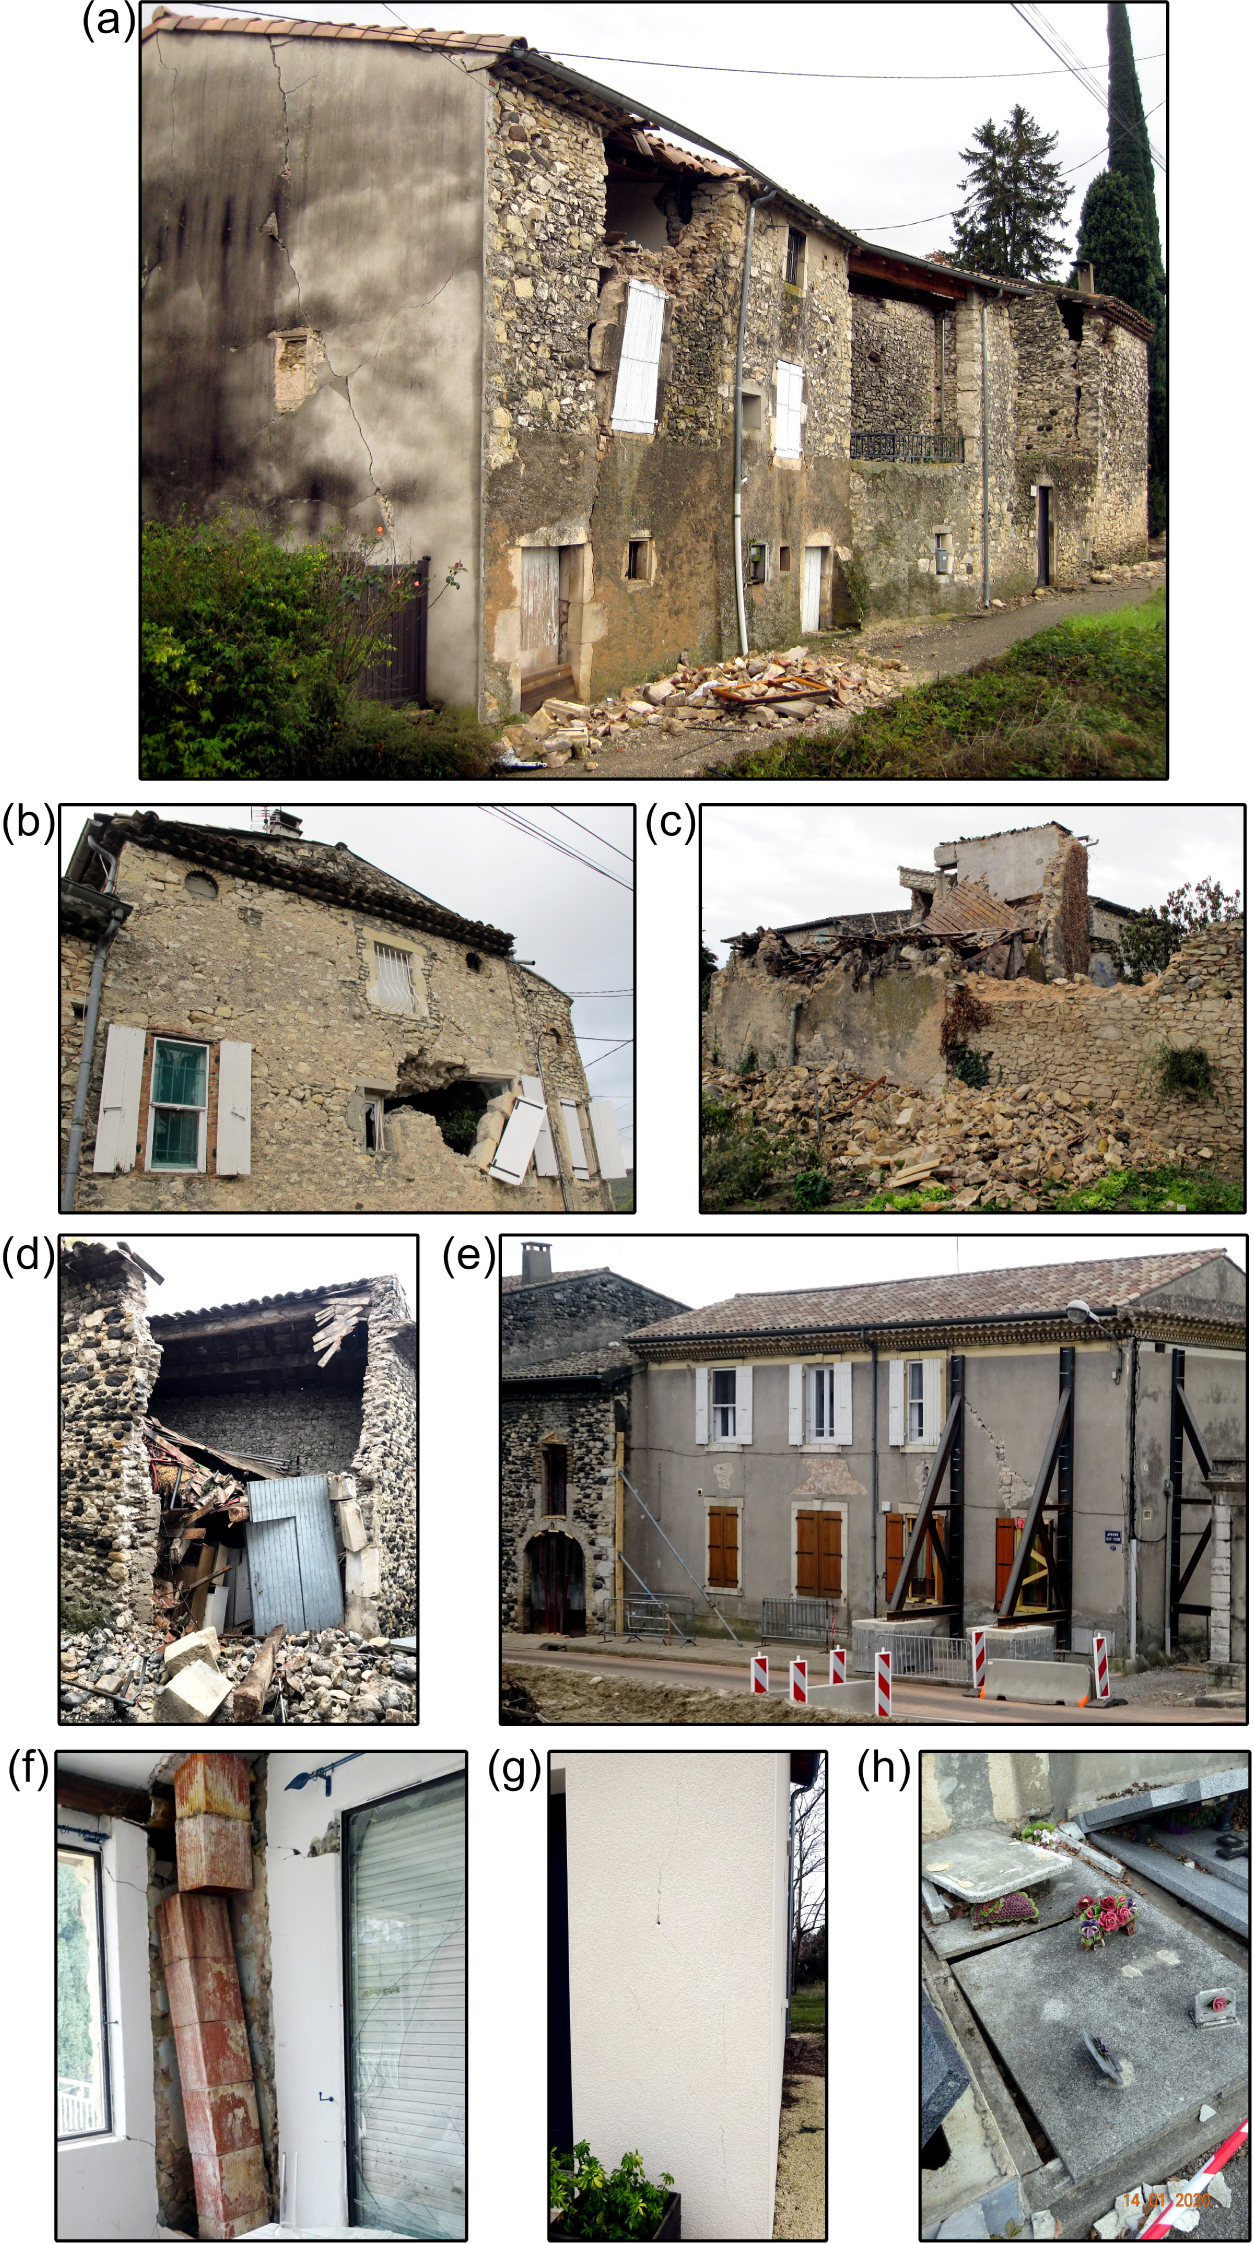
Types of damage observed in the zone of maximum intensity VIII, locality of Le Teil, from La Rouvière district (photographs a, b, c) to the Mélas district (photographs d and e), and on the road connecting the two districts (photographs f, g, h).
3.3. Data collection in the field (GIM team)
Numerous damages of degrees 2 to 4 and some of degree 5 are identified very quickly by the feedback of media, individual forms, prefectures, and social networks. In view of this initial information, the BCSF-Rénass activates the GIM with seven trained volunteer members from five organizations (CEREMA, EOST-IPGS, IRSN, PACTE, RAP). The objective of the GIM is to evaluate the EMS98 intensity in the most affected localities. In view of the human and financial resources available, a one-week field mission is planned. The target localities are those where intensity VI and above is suspected. Given the size of the area concerned and the numerous localities listed by the prefectures, we have prioritized those closest to the epicentre.
For this fieldwork, we interview an informed municipal representative (mayor, urban planning officer, etc.) to study all the effects produced by the shaking on the macroseismic indicators (people, objects, furniture, buildings), with particular attention to the effects on buildings. Thus, for this indicator, a statistical approach is carried out per municipality according to the EMS98 seismic vulnerability classes (from A to F) and the degree of damage to buildings. The most significant damage is evaluated on the basis of these same criteria by a field visit in order to set the maximum level produced for this indicator.
As part of the accelerated implementation of the procedure for compensating municipalities for natural disasters, GIM assessed 24 municipalities from 18 to 22 November. On Wednesday November 20th, the first BCSF-Rénass report was sent to the Direction générale de la sécurité civile et de la gestion des crises (DGSCGC) containing the intensities of the first nine municipalities selected by the prefectures for a government decision on the same day by the interministerial commission [Schlupp 2019]. Based on the information received (media, prefectures), the municipalities of Le Teil and Châteauneuf-du-Rhône were at first estimated to exceed the intensity thresholds, I ⩾ VII and I ⩾ VI, respectively. It was followed by an end-of-mission report, eight days after the earthquake [Schlupp et al. 2019].
4. Observations during the GIM field survey
The greatest damage is observed in two distinct areas, respectively at the northern end and at the southeastern part of the fault segment activated by the earthquake. The northern end, which emerges into the urbanized area of Le Teil locality, is where the highest intensities are observed (intensity VII–VIII) (Figure 7). The southeastern part of the fault crosses a low-density rural area belonging to the locality of Viviers, to which intensity VII is attributed. Numerous testimonies of the inhabitants agree on a very strong shake in these two zones. This is the strongest intensity observed in mainland France since the 1967 Arette earthquake, Imax = VIII–IX [Rothé 1972].
An intensity of VII–VIII, the maximum intensity of the earthquake, was attributed to the locality of Le Teil, in order to reflect the observation of these two degrees of intensity in the city, i.e., VIII for the districts of Mélas and La Rouvière and VII for the rest of the locality (Figure 7).
The zone of maximum intensity VIII covers the districts of La Rouvière and Mélas in the Le Teil locality and does not extend over more than 2 km2. These districts are located directly above the fault plane or at a distance of less than one kilometre. Most buildings of vulnerability A in the area were highly damaged (degree D4 EMS98, Figures 8a and b) and two of them were completely collapsed (degree D5 EMS98) (Figures 8c and d). The damage in La Rouvière, where the walls of the collapsed houses all fell on the same side of the street, was widely reported in the national press (Figure 8a). In the intensity VIII zone, about half of the buildings of vulnerability B were partially collapsed (degree D4), and the other half had at least degree D3 damage (which led to numerous decrees of unsafe property, Figures 8e, and f). In this vulnerability class, lower damage levels are the exception. The people present in the area at the time of the earthquake described a rather upward, brief (or even unique), and brutal motion. Many heard a violent explosion very close by, thinking it was related to the Cruas nuclear power plant or to the nearby quarry; few described a vibration. A few recent houses (built less than ten years ago, vulnerability D) suffered slight structural damage, from displaced roof tiles to fine cracks, including through load-bearing walls (Figure 8g). These disorders on modern houses are observed only along the road linking La Rouvière and Mélas districts (i.e., over a distance of only 1300 m, about ten modern houses with D1 damage, two with D2, one with D3). It should be noted that the cemetery on this road had numerous fallen steles, and funeral slabs that had tipped over or been displaced by several centimetres [Figure 8h; measurements available in Causse et al. 2021]. Another cemetery located in the Mélas district also showed some displaced slabs and fallen steles, and the mausoleums are heavily cracked. These particular effects belong to the indicators of intensity VIII [Grünthal 1998].
Intensity VII was assigned to a large part of the locality of Le Teil (excluding La Rouvière and Mélas districts in the intensity VIII zone) and the locality of Viviers. Chimney damage, despite being observed all over the Le Teil, concerned only a part of them and was mainly limited to chimney caps, with multiple rotations or horizontal shifts. Only a small proportion of them collapsed. Many masonry houses (fieldstone or simple stone, vulnerability A to B) were affected by damage grades up to D3 and a few damage D4 were observed with massive failures of non-structural inner walls or partly collapsed floors.
South of the city centre, up to the quarry (Frayol, La Violette, and Paul Langevin neighbourhoods) many D2 to D3 have been observed within vulnerability class A and B individual houses (one or two floors) and streets of adjoining houses (two floors in majority. Even if some damage is visible from outside, it is only during the inside visit that we could observe the numerous D2 to D3 with frequent to generalized open fissures and their continuity from wall through roofs. Vertical fissures at the angle of the houses and diagonal fissures (in a X shape) between windows corner and roof are common. We also observed very often horizontal cracks at the wall–floor connection, suggesting possible vertical decoupling between walls and floors consistent with the description of strong and short vertical acceleration by inhabitants. Several walls of rounded stone (vulnerability A) collapsed from the height of houses (2 to 3 floors) on the roof of the attached house, sometimes piercing it. Along the Paul Langevin boulevard, a differential effect was observed on the buildings due to their position on a slight slope. Although little damage is visible on the outside of the buildings on the street side, the façades on the lower side of the slope are more damaged. Also, some staircases collapsed or were severely damaged by the earthquake. However, the few more recent buildings existing in this area (vulnerability C to D) did not suffer from any damage.
Two cemeteries are also present in the intensity-VII part of the municipality; a few displacements of small objects have been observed there, but no displacement of funeral slabs [Causse et al. 2021].
The mayor of Le Teil, a city of less than 9000 inhabitants and less than 3000 buildings, issued 794 evacuation orders, mostly in the city centre. Many inhabitants were able to return to their homes after a few days or weeks, but the State had to rehouse 245 families.
In the Viviers locality, excluding the rural Rocherenard district described below, some renovated stone houses (vulnerability B) show D3 damage. Most of the damage is of type D1 and D2 in buildings of vulnerability A and B. Non-capillary cracks were observed in a concrete building (vulnerability C, damage D2) located very close to the quarry. There is an obvious decrease in damage with the distance to the fault plane, as the locality has a large NS extension (distance from the fault varies from 0 to about 8 km, the central part being about 4 km away). It should be noted that the number of decrees of unsafe property increases as we get closer to the surface rupture.
This municipality presented some difficulties in the intensity estimation because of a strong dispersion of its rural districts, with large uninhabited areas in-between. The most affected district is the so-called Rocherenard district, but this is a sparsely populated small area (400 × 800 m) including only seven houses and two sheds separated by fields. Rocherenard is located on a plateau above the southern part of the fault plane. The rest of the municipality lies below or on the landforms further south. Witnesses in Rocherenard describe a deafening noise and a sudden lifting of the ground. There was no collapse, except for two ruins that were already partially collapsed before the earthquake. One vulnerability B and three vulnerability A houses in Rocherenard show EMS98 degree D4 damage: open cracks several centimetres wide in almost all the walls, a few partial collapses of walls, one reinforced load-bearing wall was bent, and water infiltration after rainfall reveals failure of the structure. In two of these houses, we observed heavy furniture moved a few centimetres (gas cookers, refrigerators), many objects falling, broken dishes, and a few cracked windows. However, the three houses of vulnerability C or D show no apparent damage from outside view, and the roof tiles did not move. In this small area, a shaking of intensity VIII cannot be excluded due to the high damage on the four houses of vulnerability A or B, but cannot be confirmed according to the EMS98 due to the very low density of buildings, which limits the statistical approach. A strong seismic motion could occur here due to the proximity of the surface rupture (400 to 700 m away), and it is also possible that the ground motion was highly variable inside the district [see more discussion in Causse et al. 2021]. In the opposite way, unless a more thorough survey is made on the slightly damaged buildings in the south of Viviers, the occurrence of parts of intensity VI in the locality cannot be excluded.
An intensity of VI–VII was observed in the locality of Châteauneuf-du-Rhône. The city has about 1200 buildings, and a minimum of 12% of these buildings have been declared damaged one week after the earthquake. The city centre is affected by intensity VI, like in the surrounding localities, but the district closer to the epicentre was significantly more impacted by intensity VII (Figure 7), hence the communal EMS98 double intensity VI–VII. Although the proximity of that district to the fault can explain its greater intensity level, it is also located between two branches of the Rhône river, thus a sedimentary site effect that amplifies the ground motion may be suspected. In that district, a few buildings of vulnerability A or B show degree D3 damage with major cracks in all the walls and unstable roof. No damage of this degree has been observed in the city outside this area. An earthen levee more than 100 m long, near the Le Teil–Viviers quarry, failed and was rebuilt urgently. The damage in the rest of the locality (intensity VI) was up to degree D2 on buildings of vulnerability A or B; only one building made of dressed stone (vulnerability C) had cracks through supporting walls (degree D2 damage). A few recent houses, built less than 20 years ago (vulnerability D), have fine cracks in some walls (degree D1 damage).
The localities classified in intensity VI show similarities in terms of the damage observed: old houses, of vulnerability A, often showed D2 damage. More recent houses and buildings of vulnerability B (1980s) rarely showed this level of damage, but regularly showed D1 damage. In some localities, the population reported a rumbling sound resembling a crashing plane or a derailed train, making the link with an event of “mechanical” origin. Several people reported feelings of discomfort and dizziness during the shaking, a typical marker of the passing of surface waves. Notice that the area of Savasse built on Rhône valley sediments is associated with intensity VI (D2 in many vulnerability A) when the main part of the village built on rock is associated with intensity V (D1 in some vulnerability A, very rare D2) suggesting site effects. The value V–VI is given to Savasse.
Intensity V and IV. During the field survey, few localities near the epicentre, despite intensity VI being suspected, are associated with intensity V or IV. For example, the Malataverne locality, 13 km from the epicentre, estimated at intensity V, is a locality marked by late development (1970s). Little damage was observed (mainly D1). D2 damage was observed on buildings of vulnerability B characterized by strong irregularities in plan in the Les Joannins district, located in the southern part of the city. Another example is the Sceautres village, despite its short distance from the epicentre (12 km), is characterized by an intensity IV. It is a predominantly agricultural and relatively sparsely populated village (150 inhabitants) with a majority of buildings of vulnerability A. The oldest part of the village, composed of a dozen houses, is built against a 130-metre-high volcanic neck. No one of these buildings suffered from any damage. Very few individual houses, located in the valley, suffered from slight damage to non-structural walls. Only one single individual testimony of the shaking was received from this locality with an intensity of V.
For this earthquake, we observed that, for damage types D1, D2, and D3, the damage was more visible from inside the buildings than from outside. The number of collapsed chimneys in the whole region was unusually low compared to the description of the intensity scale. In order to understand the cause of this discrepancy, a further study could be carried out to analyse their design regionally (height above the roof, material, age, obsolescence, location in the building structure, average building height, etc.). Indeed, these often appear to be reinforced to prevent them from falling due to strong winds during the Cévennes episodes. We also observed that in certain localities, such as Saint-Marcel-lès-Sauzet, damage linked to the shrinking and swelling of clays had been aggravated by the earthquake.
5. Regional distribution of intensities
5.1. Contribution of the three types of collection for the estimation of the final EMS98 intensities
In the absence of a field inspection, the macroseismic intensity of a municipality is based primarily on the forms returned by the authorities. By comparing the responses to the indicators with the EMS98 criteria, each communal form is evaluated in terms of its degree of intensity. It is complemented by individual intensities if ten individual forms or more are received in the same city. An average value of the individual intensities, obtained by selecting representative images of the shaking, is calculated. Nevertheless, due to a better statistical approach and its more informed source, information from the authorities remains the essential basis for the final intensity. In the absence of a communal form and a number of individual forms lower than 10, only the value “R” for felt is indicated on the locality. Only 19 intensities out of 767 (2.48%) were estimated from individual forms alone (more than ten forms and no collective form).
Synthesis of the number of cities, for which we collected macroseismic data, by intensity and associated range of distance (calculated using city coordinates given by IGN)
| Number of cities | Min. epicentral distance (km) | Max. epicentral distance (km) | |
|---|---|---|---|
| F—Felt, undetermined intensity | 356 | 12 | 271 |
| I* | 198 | 29 | - |
| II* | 46 | 31 | 313 |
| III (including III–IV)* | 47 | 22 | 188 |
| IV (including IV–V)* | 53 | 12 | 63 |
| V (including V–VI)* | 36 | 7 | 49 |
| VI (including VI–VII)* | 28 | 4 | 27 |
| VII (including VII–VIII)* | 2 | 4 | 4 |
| Total number of intensities determined (*) | 410 |
The intensities estimated by the GIM are more reliable than the data collected by forms. The values estimated during the GIM mission, therefore, take precedence over the estimates from the forms. However, at the time of the GIM’s visit, some light damage (D1, D2) may not have been notified to the town hall. The intensities are then validated a posteriori with the additional data received on the damage. For this additional information, a building damage declaration form was designed [Sira et al. 2021a]. It allowed the respondents to return a degree of damage (D1 to D5), the address, type, and date of construction of the building, supplemented by pictures. The images are compared, where possible, with Google Street View images to confirm the seismic vulnerability of the building and the absence of previous damage, and then estimated in degrees of damage. The degrees of damage are related to the number of buildings in the corresponding communal seismic vulnerability class (A to F EMS98 according to land registration data). The percentage of damage per degree of damage in each of the vulnerability classes is then compared to the patterns expected by EMS98 [Sira et al. 2021b]. The intensity obtained on the construction indicator is compared to the results of the other indicators (people, objects, furniture). An expert choice based on the EMS98 criteria is made on these results to determine the final intensity level [Grünthal 1998].
In the end, 765 communal intensities in 23 departments were estimated (see ADM1 in Supplementary material). The final EMS98 macroseismic intensity map is shown on Figure 9, where the background colour is obtained by kriging interpolation. The number of cities in each intensity is given in Table 3. The maximum intensity is VII–VIII in the locality of Le Teil. The intensities were estimated from three sources: GIM expert reports (24 localities), communal forms (town halls, gendarmeries, emergency centres, 388 forms) supplemented by building damage declarations (1303 damage declarations were associated with the data declared by the localities) and individual forms (2094) [Sira et al. 2020, 2021a].
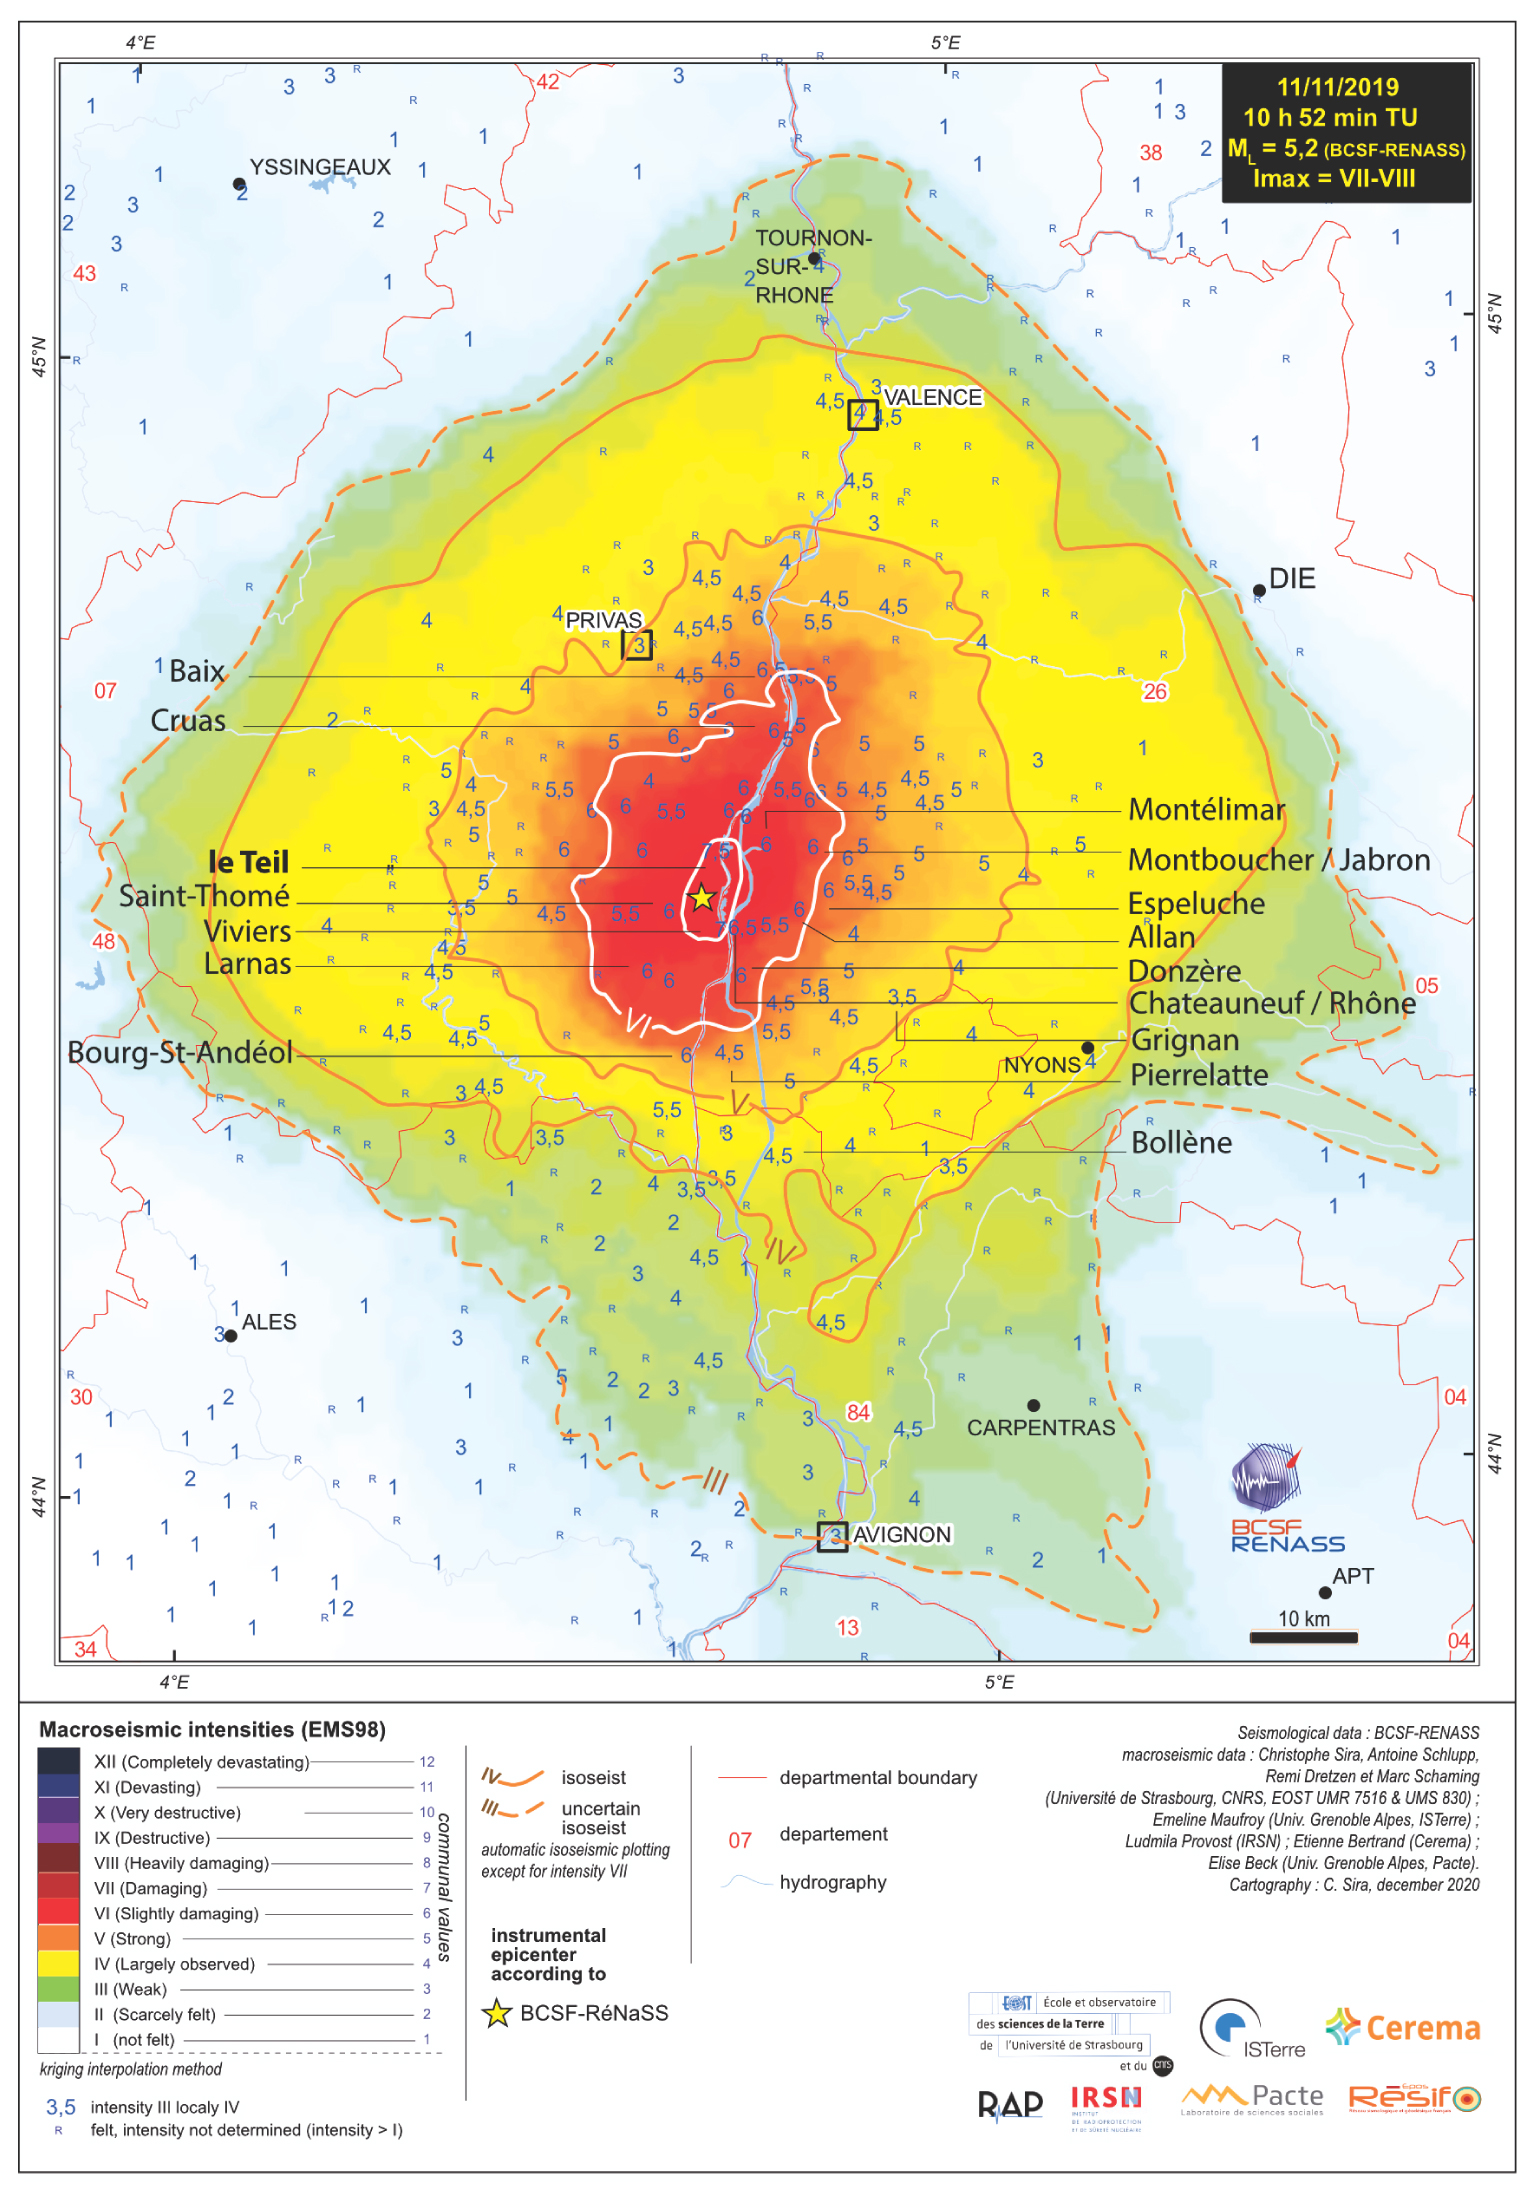
Final EMS98 macroseismic intensity map of the 11 November 2019 Le Teil earthquake.
The final intensities for the Le Teil earthquake, mapped at the regional scale in Figure 9, show an elongation of isoseismals with a major axis oriented about N20. In addition, we see a lower attenuation of intensities towards the north. This asymmetry was already observed with the preliminary internet intensities based on testimonies (Figure 4). The origin of this asymmetry is probably multiple, such as regional propagation characteristics or source directivity as observed on other earthquakes [Courboulex et al. 2013]. It would be more difficult to link it with local particularities as site effects, either in narrow valleys or at the Rhône river basin. It should be noted that elongation N20 is different from the N50 fault orientation.
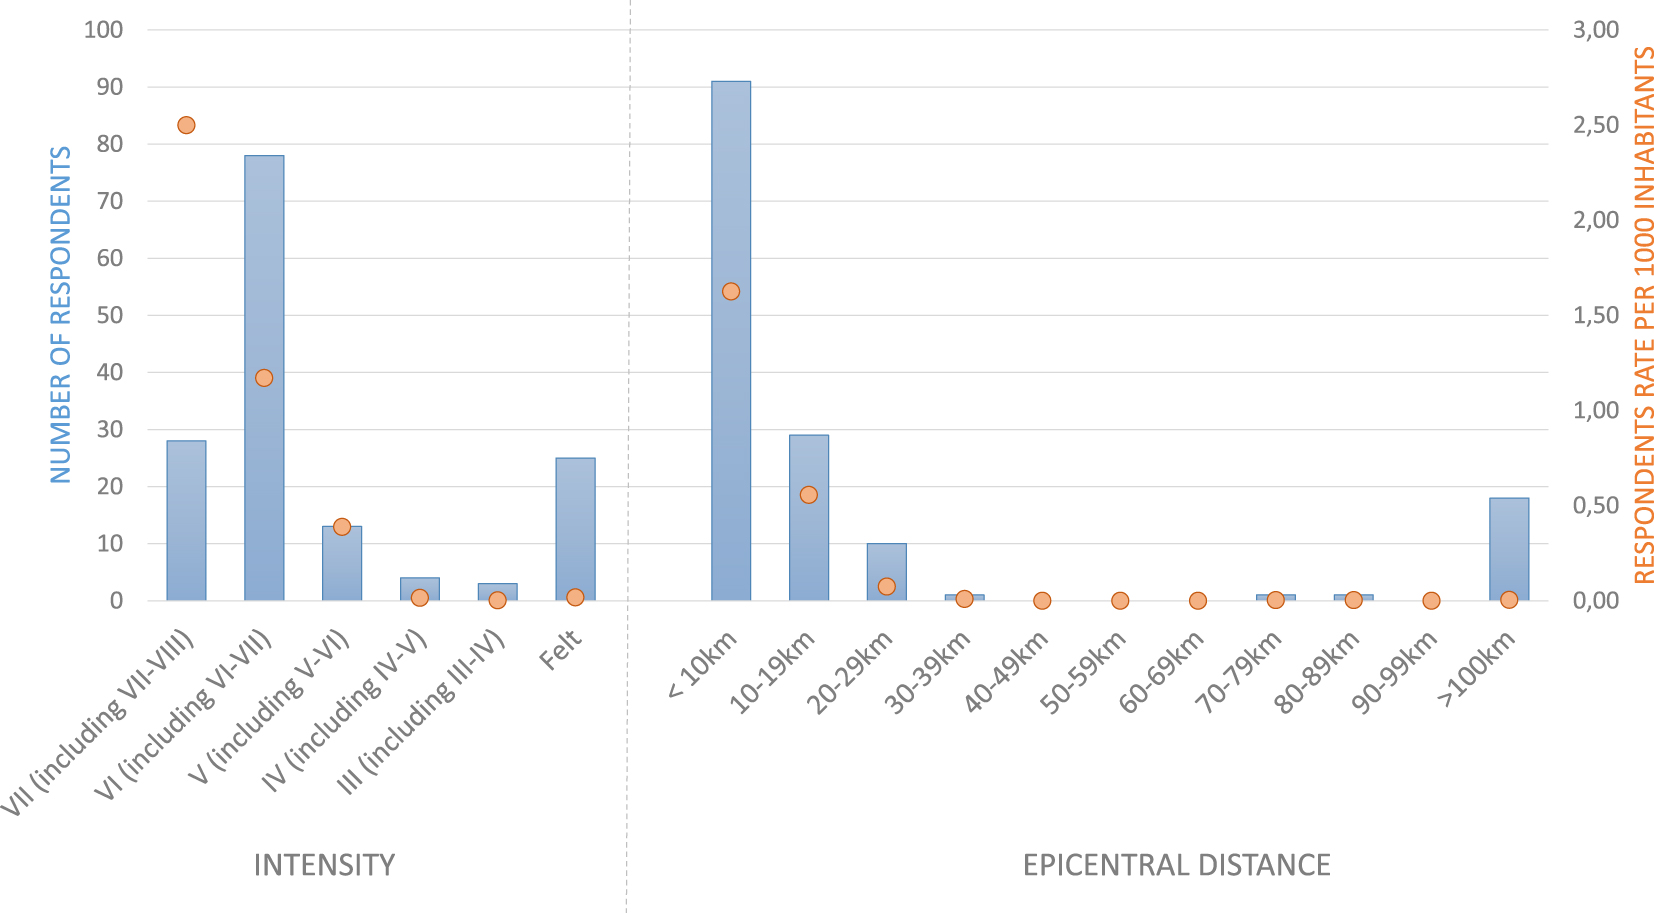
Distribution of Pacte online survey respondents by BCSF-Rénass intensity and epicentral distance.
5.2. Citizens observations collected through surveys and their analysis
In parallel with the work carried out by the BCSF-Rénass and the GIM, a survey using an online questionnaire was carried out by a team of researchers from the Pacte laboratory, ISTerre, and the Grenoble Computer Laboratory. Addressed to all persons who experienced the earthquake, the survey aimed above all to collect the behaviours adopted during and immediately after the earthquake and the factors behind these behaviours, with the aim of calibrating multi-agent models simulating the post-seismic reactions of individuals [Iskandar et al. 2021]. The questionnaire used for the Le Teil earthquake is based on a protocol developed within the framework of the MUDAMO project (see ADM3) [Beck et al. 2020]. Figure 10 details the distribution of respondents by intensity and epicentral distance. A total of 180 people responded to the survey, 60% of whom were located within a 10 km radius of the epicentre, the majority of whom were women (71%) and people aged 40–64 (46%). The sample is, therefore, not representative of the parent population. The rate of respondents per 1000 inhabitants is the highest in the first 10 km, therefore, in cities that suffered highest intensities (VII–VIII, VII and VI). The survey provides some interesting insights.
Figure 11 presents the reaction of individuals according to the epicentral distance. Concerning the behaviours adopted at the time of the shake, a certain confusion can be observed. It is not recommended to go out at the time of the tremor, official instructions recommending going out after the event. If most of the respondents followed the recommendations, the Pacte survey shows that there are still about 10% of individuals who evacuated the building during the shake in the first 20 km (Figure 11a). If we compare with the BCSF-Rénass survey (dedicated to intensity estimation and not specifically human behaviour) the rate seems higher but the question is limited to “I ran out of the building” without specifying if it was during or after the shake (Figure 11b). It corresponds probably to a part of the respondents of the Pacte survey that “evacuated the building after the shake”.
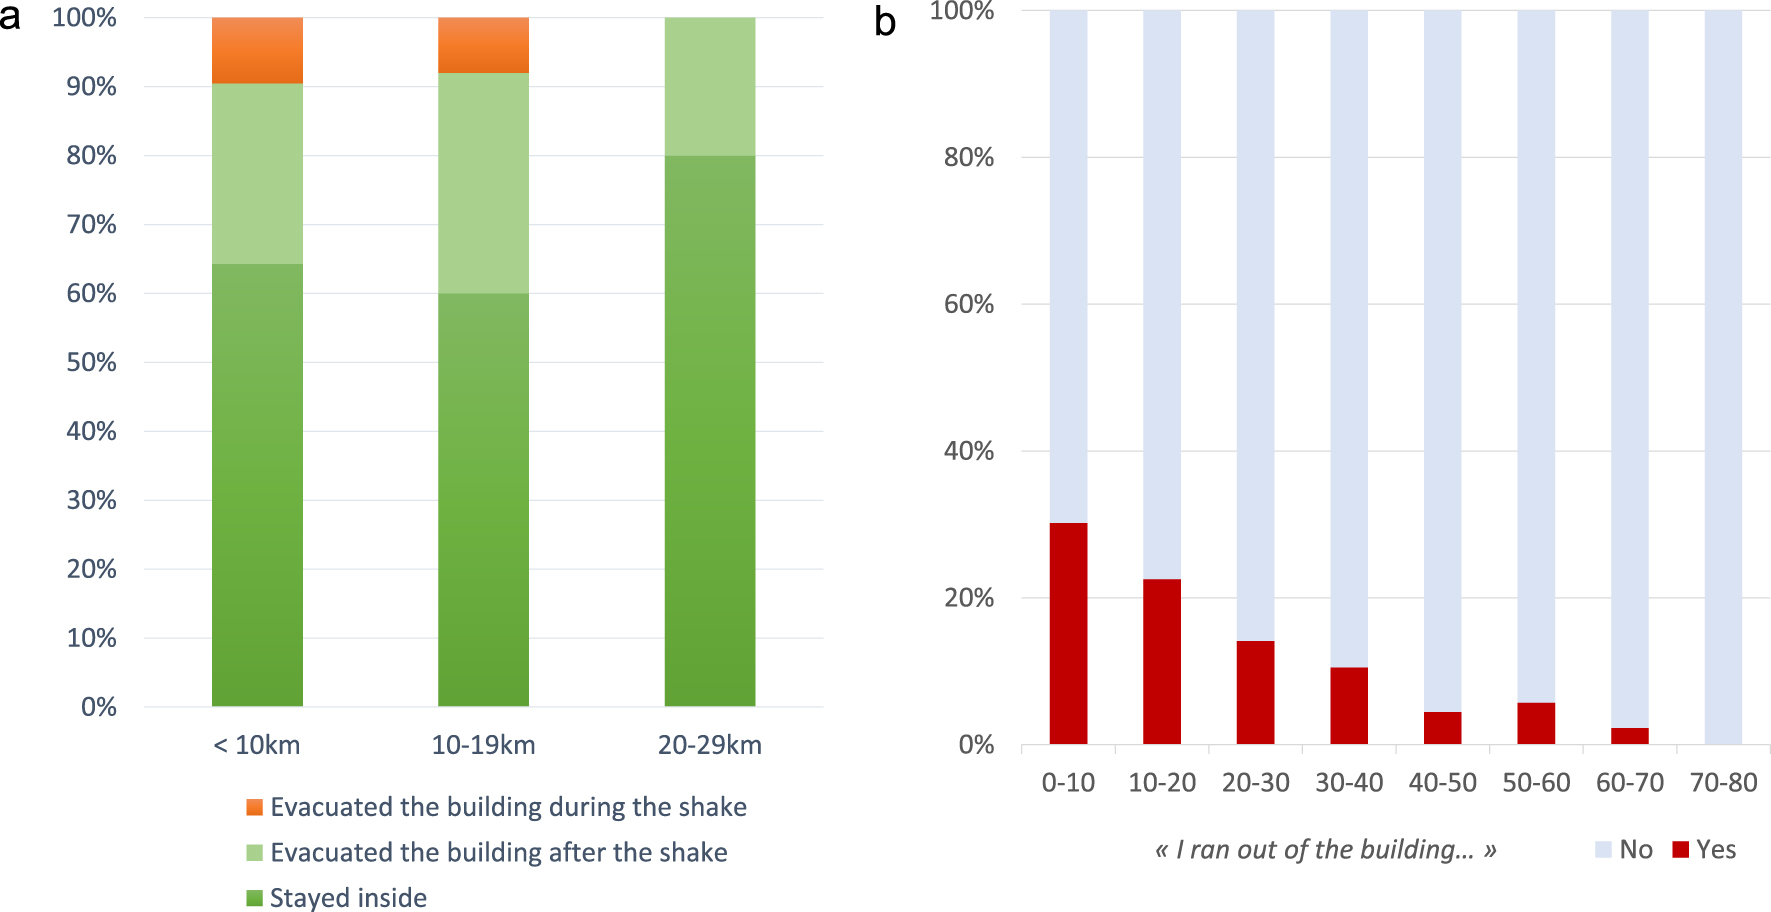
Reaction of individuals according to epicentral distance. Left: Pacte online survey in the first 30 km. Right: BCSF-Rénass online individual survey in the first 80 km. (Beyond these distance, the number of respondents is too low to be representative.)
The reactions adopted may be linked to difficulties in identifying the event through environmental signals. In fact, in the municipalities located less than 10 km from the epicentre, 54% immediately identified the origin of the shake by a noise, vibrations, effects on structures and objects, whereas 46% realized that it was an earthquake after the event through discussion with their family and friends, social networks, or the media. In some cases, social networks or the media were used to confirm that it was an earthquake, which is in line with the difficulty of recognizing the phenomenon at stake, as has been noted for other events. For example, in the case of the port explosion of Beirut, Lebanon, 48% of the respondents who felt the 1st explosion first thought it was an earthquake [Iskandar et al. 2021]. Finally, some people indicated in the online survey that they had thought it was an explosion, which probably contributed to inappropriate reactions: some of them thought of an explosion at the Cruas nuclear plant and advised to get back into the buildings instead of staying outside. This was also pointed out during the GIM interviews and in individual forms of the BCSF-Rénass survey (see ADM2). As already reported in many cases [Bañgate et al. 2019], disaster behaviour is also strongly linked to social bonds. The case of Le Teil did not escape this logic, since, among the people located outside, after exiting a building or not, 44% of them sought to join their relatives.
Overall, the respondents to this questionnaire expressed a general feeling of unpreparedness and powerlessness in the face of such a brief tremor: only 13% of respondents were completely satisfied with the way they reacted, and almost 40% were unable to evaluate their reaction: “we don’t have a culture of seismic risk”; “very bad experience because I did everything I shouldn’t have done”; “not informed at all”.
The individual forms collected by the BCSF-Rénass provided other interesting insights (see graphs in ADM4) like the percentage of non-responses (see Figure ADM4-2). First, the questions about themselves like psychological effect (panic, anxiety, etc.) or the floor on which the person was, or the vibration felt, were answered by a large majority of respondents with only 11% to 14% of non-responses. Second, the effect on the objects that need an observation on what is going on around them, has still a high score with 18% to 25% of non-responses. Then, the questions about liquid (oscillation or overflow) are poorly answered with 54% to 58% of non-responses that can be due to the absence of liquid near the witness during the shaking itself. At the end, the question about strong effects (Doors opening–closing, displacement or falling or breaking objects) has 26% to 36% of non-responses that could be related to lack of these indicators. It can be highlighted that 86% of witnesses selected a thumbnail to describe their experience of the shake, that corresponds to a synthesis of the global effect observed linked to a “local intensity observation”, despite it being the last question of the form. The attractivity of a picture and its clear relation with witness experience play a key role.
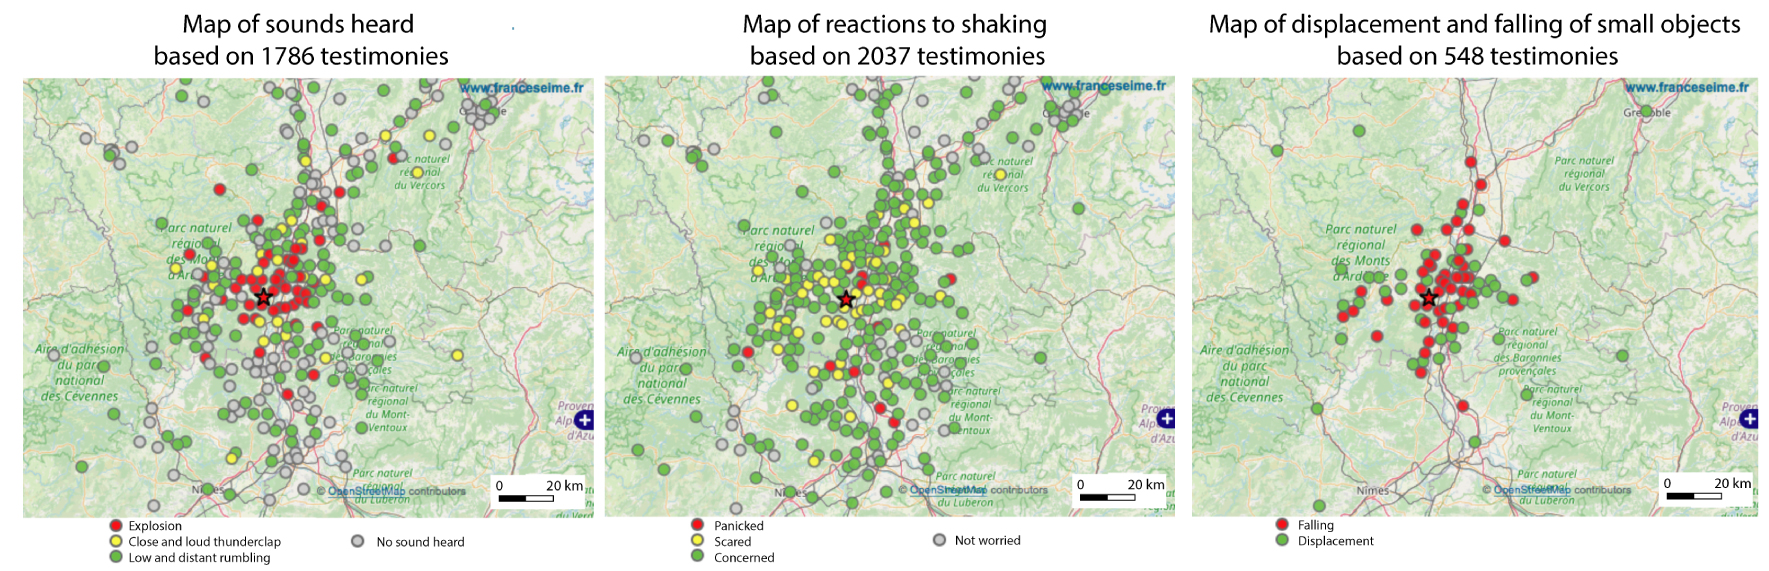
Maps of sounds heard, reactions to shaking and effects on small objects from individual testimonies. The effect represented by each dot is the most frequent at the scale of the city taking into account all the testimonies collected. (Maps from http://www.franceseisme.fr—BCSF-Rénass.)
We selected the answers to the 20 questions of the BCSF-Rénass individual form that are not related to building damage for witnesses on floors below 3 (see ADM4). We observe that all effects and their strength decrease statistically with the distance until about 50 to 80 km. Beyond that, the answers appear more random, that is, due to the low number of respondents (see Figure ADM4-3). It shows that each question is well adapted to characterize a decrease in the shaking. Nevertheless, when we plot them on a map (Figure 12), we see a clear NS trend of the shaking that was confirmed by the detailed survey and analysis (Figure 9). This trend, hidden on graphs by distance, is highlighted by the mapping of effects and intensities, a very informative way of presenting the data.
6. Discussion
6.1. Uncertainties on intensity estimations
The historical assignment, widely practiced, of a unique intensity value for a specific city, despite not imposed by the EMS98, has clear limits. In the case of the Le Teil earthquake, we observe that close to the fault, the spatial variability of the seismic motion is important inside specific cities even if they can be considered as small localities (examples of Le Teil and Viviers, see part 5). The assignment of double intensity value (e.g., VII–VIII at Le Teil) can compensate for this problem. We can face the same variability when site effects are present only on a part of the city. Shaking variability in the same locality could even reach, for exceptional situations, three degrees of intensity. Another case was observed at the locality of Saint-Thomé, at the SW end of the surface rupture. It is spread partly on top of a rocky peak and partly on sediments along a river: both configurations can induce probable site effects of the same order, so in that case we assigned only one intensity value for the whole locality.

Comparison of the preliminary rapid communal intensities (left map) from all the testimonies collected on the site http://www.franceseisme.fr, and the definitive EMS98 intensities estimated after the whole macroseismic survey (right map).
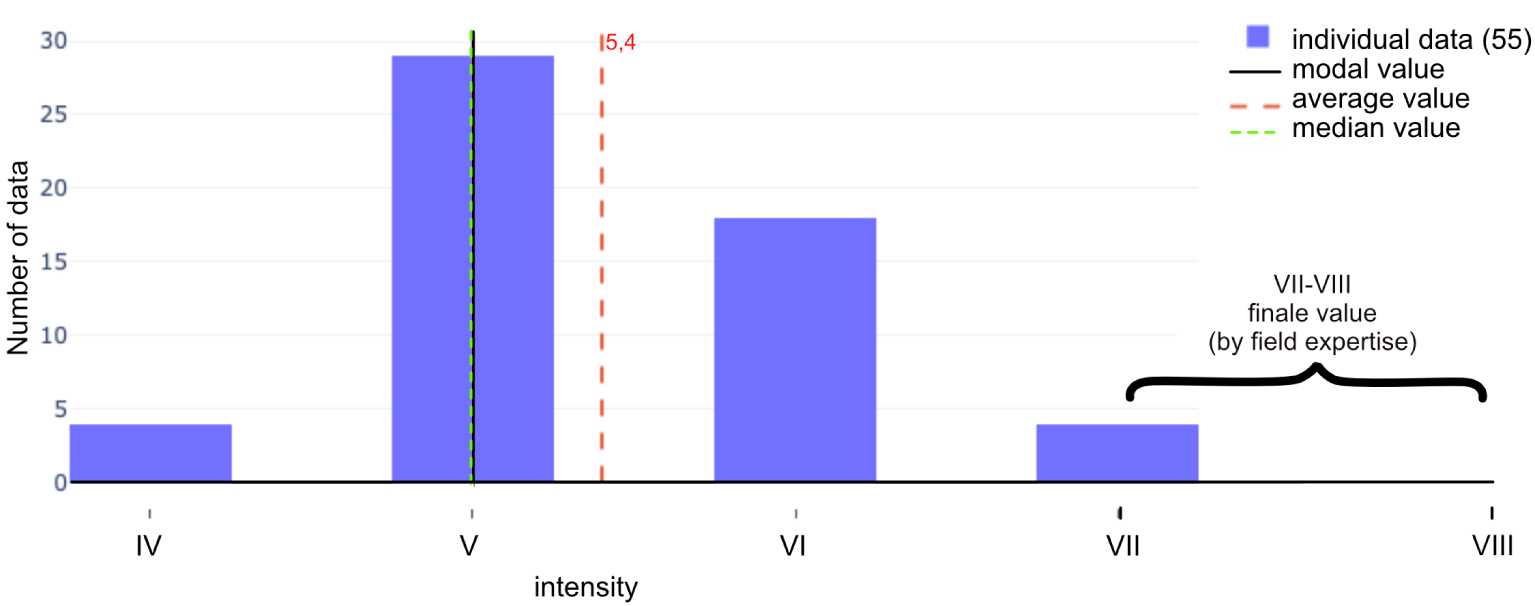
Repartition of the individual intensity values, from testimonies, collected in the commune of Le Teil and the final value after field survey.
Mw and macroseismic parameters for events in France since 1967 similar in terms of magnitude and depth to the 2019 Le Teil earthquake
| Name | Date | Mw (Author) | Macroseismic depths | Numb. I ⩾ VI | Numb. I ⩾ VII | Numb. I = VIII or I = VII–VIII | Author intensity data (scale) |
|---|---|---|---|---|---|---|---|
| Le Teil | 11/11/2019 | 4.9 [Ritz et al. 2020] | 1–1.6 km | 30 | 2 | 1 | BCSF-Rénass (EMS98) |
| Barcelonnette | 07/04/2014 | 4.8 (SI-Hex) | 4–6 km | 3 | 0 | 0 | BCSF-Rénass (EMS98) |
| Epagny | 15/07/1996 | 4.9 (SI-Hex) | 1.5–5 km | 22 | 3 | 0 | SisFrance (MSK) |
| Arudy | 29/02/1980 | 5.0 (SI-Hex) | 2–5 km | 155 | 32 | 0 | SisFrance (MSK) |
| Arette | 13/08/1967 | 5.2 (SI-Hex) | 1.5–5 km | 92 | 9 | 3 | SisFrance (MSK) |
Macroseismic depths estimates are calculated with the QUake-MD tool using the Baumont et al. [2018] intensity attenuation prediction equations.
Another peculiarity of this earthquake is the difference between the internet preliminary intensities, obtained shortly after the occurrence of the earthquake by individual testimonies, and the final intensities obtained after the GIM field survey and communal surveys (Figure 13) [Sira et al. 2021c]. Indeed, the internet intensities tend to underestimate the intensities in the epicentral zone, locally up to 20 km. For example, for the locality of Le Teil, the communal intensity deduced from the average (or mode or median) of the 55 spontaneous forms is only V (Figure 14), whereas images relayed by the press showed collapsed buildings. These 55 testimonies received on the website are obviously not representative of the impact on the whole city (8796 inhabitants). We got only four testimonies for characteristic effects of intensity VII, but 18 for VI, 29 for V, and 4 for IV when the intensity of this locality, following the field survey, is finally estimated to VII–VIII. Indeed, for victims of serious damage, it is obvious that the BCSF-Rénass testimony form (little known by the population) does not represent a priority.
This example makes us legitimately question the validity of the average (or even mode or median) value of individual testimonies, even as a preliminary estimate. A full statistical approach could improve it but would be limited to the few cities with sufficient testimonies. Therefore, a particular attention must be paid to this problem when several testimonies characteristic of intensity VI and above are received, even if they are not the most frequent over the city.
6.2. Comparison of intensity field with similar earthquakes in mainland France
The Le Teil earthquake is the first known event in mainland France with clearly identified surface rupture, which offers an excellent constraint on hypocentral depth and location.
The strongest events in mainland France in terms of shaking level since 1967 are the Arette (1967), Arudy (1980), Epagny (1996), Barcelonnette (2014), and Le Teil (2019) earthquakes (Table 4, Figure 15). They are all close in Mw (4.8 to 5.2). The Le Teil earthquake is comparable to the Epagny earthquake, identical in magnitude and both are shallow (Epagny is located at about 3 km depth). Their impact is close (intensity VI and above). The Barcelonnette earthquake is deeper (about 8 km—SI-Hex catalogue), and there was no city at less than 10 km, making the comparison more difficult. The two larger events, also shallow, are Arette and Arudy in Pyrenees, the latter having affected a very large area of 155 localities with intensity VI and more. By comparing them (Figure 15), we confirm Bakun and Scotti [2006] results with a stronger intensity decrease with distance in the Alps (Barcelonnette, Epagny) than in the Pyrenees (Arudy, Arette), also consistent with recent work by Mayor et al. [2018]. Differences of maximal intensity, observed in epicentral area, may be linked to a difference of depth properties, magnitude, and epicentral distance of the closest city.
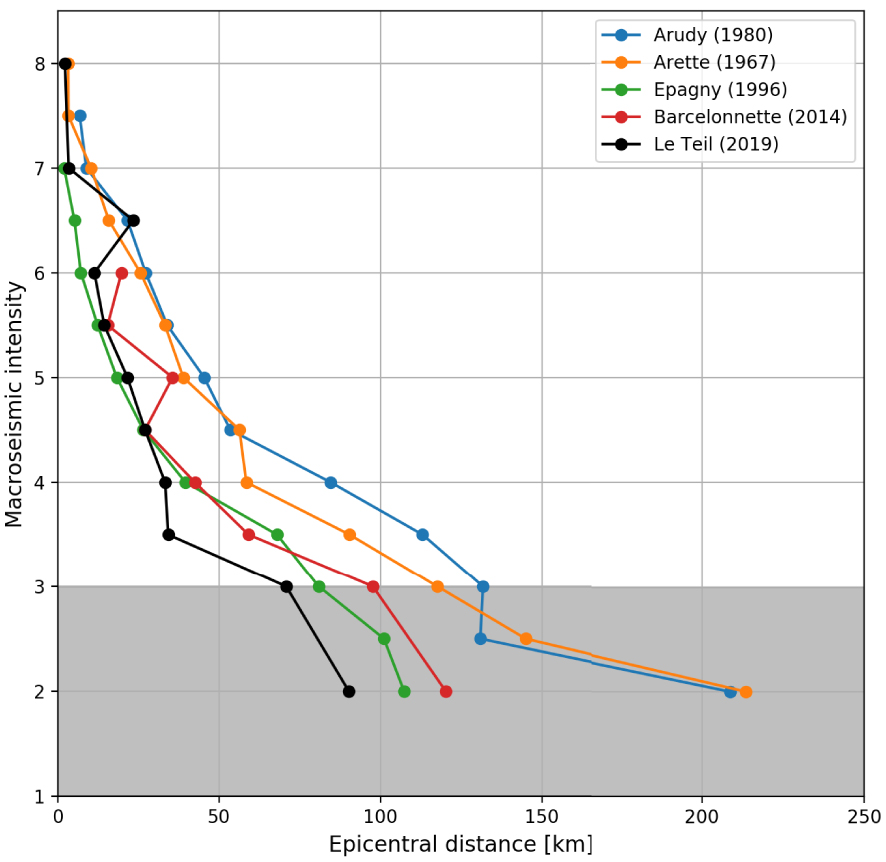
Comparison of intensity decreases with epicentral distance for various past reference earthquakes in France. Each intensity point is equal to a weighted mean of epicentral distance within one intensity class. The weights are based on the quality factor associated with each intensity data point (A: weight of 16, B: weight of 4, C: weight of 1). The grey area shows intensity <3 that are not comparable as they are incomplete.
6.3. Should the seismic hazard assessment in the area be revised?
6.3.1. Comparison with previous earthquakes
On the map in Figure 7, within a radius of approximately 15 km around its epicentre, we observe that the Le Teil earthquake intensities exceed the maximum known historical intensities for the communes located to the west of the Rhône and in the northeastern quarter. For the localities in the southeastern quarter of the map, the intensities of the Le Teil earthquake remain lower. This is due to the occurrence of numerous earthquakes at the end of the 18th and 19th centuries, with some associated with intensity of VII between the localities of Roussas and Châteauneuf-du-Rhône. The Montélimar city has been equally affected by the Le Teil earthquake and the strongest previous one (1873). This comparison between maximum known historical intensities and the Le Teil intensities must be weighed against the fact that these intensities are not expressed on the same scale, even if their definitions are close: MSK for historical, EMS98 for the Le Teil.
6.3.2. Impact of the Le Teil earthquake on the knowledge of past earthquakes in the region
For the 19 July and 8 August 1873 earthquakes, localities close to the epicentre were associated with intensity VII, like the Le Teil 2019 earthquake. However, the magnitudes of the two 1873 earthquakes according to FCAT catalogue [Manchuel et al. 2018] are between Mw 3.8 and 4.1, which is 1 Mw unit less than the Le Teil earthquake. Therefore, we investigated this difference by using the QUake-MD tool [Provost and Scotti 2020] with some intensity prediction models used to build FCAT and presented in Baumont et al. [2018]. The QUake-MD tool estimates magnitude and depth space of solutions from a macroseismic intensity field and intensity prediction models. We obtained very close values to FCAT for the two 1873 earthquakes, with differences in magnitude of about 0.1 and in depth of about 1 km. Next, we applied the QUake-MD tool to the Le Teil macroseismic field: magnitudes estimated are between Mw 4.2 and 4.5 and the depth estimated between 1 and 1.5 km. If macroseismic depth estimates seem to be in accordance with the instrumental estimates, the magnitude estimates are underestimated by at least 0.5 unit. We obtained similar magnitude estimates for the Le Teil earthquake with Bakun and Scotti [2006] Alps and Provence models, with about 1 to 2 km deeper depths. The three studied earthquakes occurred in the same region (at less than 20 km) and seem to share similar depth properties (depths of 2 and 3 km for the 19 July and the 8 August 1873 earthquakes, respectively). It points out that methods used to estimate historical magnitude can be tested on modern well-known events after detailed macroseismic surveys as we did for the Le Teil earthquake. In light of the Le Teil event, the estimates of the Mw magnitudes of historical earthquakes in this area might be underestimated. The origin of this underestimation still needs to be investigated.
7. Conclusion
The collection and analysis of the macroseismic data allowed us to estimate 765 communal values (410 intensities from I to VII–VIII and 355 felt) in the region affected by the Le Teil earthquake. Only four permanent seismological sensors were running in the first 50 km. The initial data collected via the 2094 testimonies of the Internet users made it possible to obtain preliminary information on a vast area. The rapid shakemap showed a discrepancy between the shaking levels from the testimonies and the seismological records. While this shift is expected in the epicentral zone for intensities VI and above, it was more surprising at greater distances. The exceptional shallowness of the hypocentre may be one of the explanations. The internet intensities are therefore preliminary and informative data but cannot be the only data used for reference EMS98 intensities. They do, however, provide a lot of detailed information on how people feel and react during an earthquake. The second level of survey, via the communal forms, makes it possible to greatly improve the estimated intensities over a large area. This survey, over a longer period of time, enables more precise data to be collected at the municipality level, better distributed over the municipality, and with a statistical approach in accordance with the EMS98 scale. Although it is possible to collect data on damage, the analysis of the vulnerability of buildings remains limited and the nature of the damage is sometimes uncertain. Therefore, the field survey (GIM) is the only one that allows a detailed analysis in the epicentral zone and remains essential in case of damage, it is the most precise data collected. This earthquake, very well located thanks to the detection of surface rupture, and the intensity field obtained with our work, allow it to be a reference earthquake to estimate parameters of historical events. The experience gained during the study of this earthquake also helps us to better prepare the macroseismic survey for future major events (Mw ⩾ 6) expected in France.
Acknowledgements
We would like to thank the State services, Prefectures, Town Halls, fire brigade, police, gendarmerie as well as the Internet users for their help or participation in the communal and individual macroseismic surveys. We also thank the inhabitants who opened their doors to facilitate our fieldwork. We thank Marc Grunberg, Julien Monticollo, and Véronique Mendel for their assistance with the BCSF-Rénass seismic database. We also thank the Pacte-LIG team for its support for launching the online survey. This work was made possible by the financial support of CNRS, UNISTRA, RAP-Résif, ISTerre, IRSN, CEREMA, and UGA. This work is in the framework of the Transversal Seismicity Action of Résif-Epos [Masson et al. 2021].
Web sites
RAP and RLBP are members of the Research Infrastructure (IR) Résif-Epos, managed by CNRS-Insu. Résif-Epos is inscribed on the roadmap of the Ministry of Higher Education, Research and Innovation, the Résif-Epos IR is a consortium of eighteen French research organizations and institutions. Résif-Epos benefits from the support of the Ministry of Ecological Transition.
Résif-Epos seismic data portal: http://seismology.resif.fr
Seismic catalogues with online access (last access: 8 June 2021)
SisFrance: Historical seismicity database managed by the BRGM, EDF and IRSN consortium. http://www.sisfrance.net
SI-Hex Catalogue 1962–2020 (BCSF-Rénass, version 2021): https://gitlab.com/eost/bulletins/-/tree/master/sismicite_1962_2020
BCSF-Rénass: Bureau central sismologique français – Réseau national de surveillance sismique (http://www.franceseisme.fr/, http://renass.unistra.fr/)
CEREMA: Centre d’études et d’expertise sur les risques, l’environnement, la mobilité et l’aménagement (https://www.cerema.fr/fr)
DGSCGC: (Direction générale de la sécurité civile et de la gestion des crises) Department of Civil Defense and Emergency Preparedness
CNRS: Centre National de la Recherche Scientifique (https://www.cnrs.fr/)
EMSC: European-Mediterranean Seismological Centre (http://www.emsc-csem.org)
IGN: Institut national de l’information géographique et forestière (https://www.ign.fr)
IRSN: Institut de Radioprotection et Sûreté Nucléaire (https://www.irsn.fr)
ISTerre: Institut des Sciences de la Terre (https://www.isterre.fr)
OCA: Observatoire de la côte d’Azur (https://geoazur.oca.eu/fr/obs-sismo-geoazur)
OSUG: Observatoire des Sciences de l’Univers de Grenoble (https://www.osug.fr)
Pacte: Pacte, laboratoire de sciences sociales (https://www.pacte-grenoble.fr/)
RAP-Résif: Réseau accélérométrique permanent (https://rap.resif.fr)
Résif-RLBP: Réseau large bande permanent (https://rlbp.resif.fr)
UNISTRA: Université de Strasbourg (https://www.unistra.fr)
USGS: US Geological Survey (https://earthquake.usgs.gov)
UGA: Université Grenoble Alpes (https://www.univ-grenoble-alpes.fr/)