


 CC-BY 4.0
1. Introduction
The primary incentive for developing seismic hazard quantitative assessment methods has been driven by civil engineering structure designs. Although a variety of applications and regulatory background has led to different approaches used for common buildings and nuclear power plants, estimating seismic hazard is highly multidisciplinary, regardless of the approach and application, as it involves in-depth studies from varying disciplines of Earth science (e.g., geology, geodesy, tectonics, classical and engineering seismology, statistical and probabilistic analysis to cope with uncertainties). An interface with earthquake engineering is also required to ensure the hazard definition is consistent with its subsequent use as a loading parameter.
This overview focuses on studies that perform probabilistic seismic hazard in mainland France. Only published studies for France or those that focus on a set of sites are considered. Site-specific studies related to critical facilities are not considered, as these studies are partially confidential and not published. Studies that cover a wider geographic area than just France (e.g., Global Seismic Hazard Assessment Program (GSHAP) that covers the world [Grünthal et al. 1999] or ESHM13 that covers Europe [European Seismic Hazard Model 2013, Woessner et al. 2015]) are considered in the discussion section. Consequently, all selected hazard studies perform seismic hazard assessment (SHA) for “standard rock”. We focus on the probabilistic approach (i.e., probabilistic seismic hazard assessment (PSHA)), which is the method most used internationally. The mathematics framework of PSHA enables consideration of multiple sources of uncertainty and is well suited for downstream estimations of potential damage and loss (i.e., risk assessment studies).
A short reminder of the engineering and regulatory background that explains why, when, and how SHA studies were performed is included. An overview of published probabilistic seismic hazard studies on the French mainland territory over the previous three decades is then presented. There is also a focus on the history of the three generations of official seismic zonation maps in France. Current zonation relies on outdated models; thus, the academic and engineering communities have the opportunity to build the next seismic hazard model for France.
2. Engineering and regulatory background
2.1. Original goals of hazard assessment
Seismic hazard was first assessed for civil engineering design purposes in the early twentieth century after a series of worldwide destructive events (i.e., Messina, Italy, in 1908; San Francisco, United States, in 1906; Kanto, Japan, in 1923 [see, e.g., Housner 1997, Beattie et al. 2008, Calvi 2010, Fajfar 2018]). There was a lack of strong-motion recordings at the time, so the first earthquake loading estimations were guessed by civil engineers. These guesses were used in the simple design methods that were available (i.e., static linear elasticity). Civil engineers correctly assumed that the main destructions were associated with horizontal vibrations [e.g. Despeyroux 1985, Betbeder-Matibet 2003]; however, they were optimistic regarding shaking levels. In very active areas (e.g., Italy, California, Japan, Chile)—where earthquake engineering started to develop on a quantitative basis—the equivalent static horizontal forces that characterize earthquake loads were estimated to be 8%–12% of a building’s weight, grossly corresponding to horizontal accelerations ≈0.8–1.2 m/s2 in the structure [Bertero and Bozorgnia 2004, Reitherman 2012a,b, Fajfar 2018]. After acquisition of additional strong-motion recordings and feedback from destructive earthquakes, it was shown that (1) free-field horizontal accelerations could reach much larger values (very often several m/s2; present world record is 28 m/s2 at KNET station MYG004 during the 2011/03/11 Tohoku earthquake [Goto and Morikawa 2012]), and (2) the simple static design for low levels (≈1 m/s2) was already efficient in reducing damage, even during large magnitude events [Despeyroux 1985, Betbeder-Matibet 2003, Reitherman 2012a,b, Fajfar 2018].
Estimating loading levels in relation with evolving design methods has historically been performed mainly by earthquake engineers. The link between seismic hazard in terms of strong-motion recordings and design levels has been done in a more explicit way over the last 4–5 decades, with quantitative hazard assessment involving increasing participation of earth scientists, ranging from individual expertise [e.g., Rothé 1967] to larger working groups [Goguel et al. 1985, Autran et al. 1998, Woessner et al. 2015, Danciu et al. 2021]. Long-lasting consequences of the early phase of assessment likely include the existence of safety margins in the design methods that evolved over the previous century and the historic difference between the design level and the actual shaking level [e.g., Betbeder-Matibet 2003, Reitherman 2012a,b, Fajfar 2018]. This difference resulted in an apparent underestimation of the design level with respect to the actual hazard and in the reluctancy of the engineering community to assimilate hazard and design levels as clear identification of the actual design safety margins would be required. Building code reference design levels are typically the shaking hazard, with a 10% probability of being exceeded at least once over a 50-year time span (or with a mean return period of 475 years). Longer return periods are also currently considered [e.g., Atkinson 2004, Bommer and Pinho 2006, Grünthal et al. 2018]. Moreover, the recent proposition of design levels based on risk-targeted seismic design implies consideration of various return periods for convolution with fragility curves [Douglas et al. 2013, Gkimprixis et al. 2019], and this could be considered in the next zonation update.
Overview of official zonations, seismic rules, and enforcing dates for mainland France
| Zonation generation | Background hazard studies | Proposition of official zonation map | Associated seismic rules | Corresponding decrees | Zonation enforcing date |
|---|---|---|---|---|---|
| 1 | Rothé [1967] | Rothé [1967] | PS 69 French Standard DTU P06-003 (1972) | Arrêté 6/03/1981 | 1969 |
| 2 | Despeyroux and Godefroy [1986] | Despeyroux and Godefroy [1986] | PS 92 French Standard NFP06-13 (1995) | Décret 91-461, 14/05/1991 Arrêté ENVP9250115A, 16/07/1992 (PS69/82) Arrêté ENVP9760254A, 29/05/1997 (PS92) | 1991 |
| 3 | Martin et al. [2002] | Bard and Lebrun [2004] | EC8—European Standard—NF EN 1998-1 [2005], NF EN 1998-3 [2005], NF EN 1998-5 [2005] and associated national annexes, NF EN 1998-1/NA [2007] | Décrets 2010-1254 et 2010-1255, 22/10/2010 | 2011 |
2.2. Seismic regulations and zonation in France (Table 1)
French seismicity is low to moderate. Despite the Lambesc event in 1909, there was no organized effort to account for seismic actions in the building code until the Orléansville earthquake in northern Algeria (under French rule at the time) in 1954. This event triggered the first generation of French seismic provisions [AS55 1955], which were applied only in Algeria. The Agadir event in Morocco (formerly a French protectorate until 1956) in 1960 led to the first update (PS62/64 rules), which was applied for the reconstruction of Agadir. The Arette earthquake in 1967 convinced French authorities that similar rules should be applied in some areas in mainland France. Seismic rules were updated (PS69) and associated with the first zonation map based on past seismicity (as it was known at that time [Rothé 1967]). These rules were given the status of document technique unifié (DTU), which acknowledged a technical consensus between construction professionals and regulating authorities. These rules were first adopted on a voluntary contractual basis between the constructor and the client. Based on the legacy of events in northern Africa, the El Asnam, Algeria, earthquake in 1980 led to an update that made the technical rules (labeled PS69/82) mandatory (1981 March 6 decree) for all new buildings in Guadeloupe and Martinique and to some collective buildings in a few areas of mainland France.
The occurrence of several major earthquakes in the following decade (Guerrero-Michoacan, 1985; Spitak, Armenia, 1988; and Loma Prieta, California, 1989) led the French Association of Earthquake Engineering (AFPS) to rewrite the design rules [AFPS90 1990], and the Bureau de Recherches Géologiques et Minières (BRGM) updated the seismic zonation map on a more rational basis [Despeyroux and Godefroy 1986]. These efforts led to a new official regulatory corpus (PS92) that combined the 1986 zonation map with more advanced design rules and structural detailing that accounted for soil-related issues (e.g., foundation type, soil softness, geometry); however, the seismic loading to be considered was still only loosely related to actual shaking, which was poorly known at the time. Loading levels were derived from poorly constrained correlations between macroseismic intensity and peak ground acceleration. Some implicit assumptions regarding behavior of the buildings (i.e., value of the behavior coefficient related to the poorly known structural ductility) were accounted for, as well as an explicit desire to avoid too large discontinuities with the previous PS69/82 loading parameters [Despeyroux and Godefroy 1986, AFPS 1989].
Because of European harmonization efforts that led to establishment of the Eurocode 8 (EC8) technical rules to be applied at the European scale, it became clear in the late 1990s/early twenty-first century that the design level should be related directly to the ground shaking hazard level, which had to be estimated with a probabilistic approach. The present French zonation map for common buildings was established in 2004 and is based on a probabilistic seismic hazard map from the early 2000s [Martin et al. 2002]. This map became official in 2010 via two decrees on October 22, 2010. The corresponding zonation maps are displayed in Figures 6 and 7 and will be explained and commented on in Section 4.
2.3. Critical facilities
Parallel to developments for “normal risk” construction, numerous seismic hazard safety studies for critical facilities were performed on a site-specific basis, starting with development of nuclear energy (i.e., Règle Fondamentale de Sûreté [RFS1.2c] in 1981 and updated in 2001 [RFS 2001-01]), followed by chemical industries [Arrêté du 10 mai, updated in Arrêté du 15 février] and dams [Arrêté du 6 août].
The history of seismic zonation in France since the 1970s would have been very different without the developments performed for the nuclear industry that made some key contributions essential for several components of SHA:
- Creation and maintenance of the SisFrance database [www.sisfrance.net, maintained jointly by BRGM, EDF, and IRSN; see, e.g., Lambert et al. [1996], Lambert [2009], Scotti et al. [2004], or Jomard et al. [2021] in the present issue] helped achieve a major breakthrough in the knowledge of historical seismicity. The SisFrance database has been used to derive several earthquake catalogs for SHA, including the French Seismic CATalog (FCAT) published by Manchuel et al. [2018].
- Knowledge of the seismotectonics at large in mainland France. The seismotectonic map project for France [Goguel et al. 1985] further triggered and provided background research on seismotectonics [e.g., Grellet et al. 1993], neotectonics, and fault characterization. The first fault database for France was published by Jomard et al. [2017].
Although the deterministic approach (RFS2001-01) has been, and still is, the official approach imposed by the control authorities in France, the nuclear community first attempted to develop a probabilistic approach for the French territory in the early 1980s [Hendrickx 1981, Dadou 1981, Dadou et al. 1984, Goula 1980] and continue to work on this topic [see, e.g., Marin et al. 2004, Clément et al. 2004, Scotti et al. 2004]. The probabilistic approach has been officially considered for the post-Fukushima complementary safety evaluations of core elements (ASN Decision ASN no 2014-DC-0394 to 2014-DC-0412), with a return period of 20,000 years.
3. Overview of PSHA studies in France
3.1. Selection of publications that reflect PSHA in France
We have selected 11 publications covering a period of nearly 30 years (1992–2020) to show an overview of probabilistic seismic hazard studies performed for France. Except for the two earliest studies [i.e., Bottard and Ferrieux 1992, Dominique and André 2000], all articles have been published in peer-reviewed journals (see Supplementary Table 1). The selected works aim to calculate probabilistic seismic hazard for a site, a selection of sites, or a region. We did not include PhD thesis or project reports, nor did we include publications related to testing PSHA against observations or publications related to hazard calculations at the European scale [GSHAP, Grünthal et al. 1999; ESHM13, Woessner et al. 2015; ESHM20, Danciu et al. 2021]. Results of the European projects were nevertheless considered for comparison purposes.
The foundation of probabilistic seismic hazard dates back to the 1960s [Cornell 1968, Esteva 1968]. PSHA has evolved greatly since these seminal works, and this evolution is reflected in the publications related to France. Hazard studies currently account for uncertainties much more thoroughly than early studies, both in the source model (i.e., earthquake forecast) and in the ground-motion prediction model. The set of articles selected for France can be grouped into (1) those aimed at providing hazard levels in the form of seismic hazard maps [Bottard and Ferrieux 1992, Dominique and André 2000, Marin et al. 2004, Secanell et al. 2008, Martin et al. 2017, Drouet et al. 2020] and (2) those aimed at scientific appraisal of PSHA methodology and analysis of the origin of uncertainties, with calculations performed at selected sites [Beauval and Scotti 2004, Beauval et al. 2006b, Clément et al. 2004, Chartier et al. 2017a, Beauval et al. 2020].
A probabilistic seismic hazard study in a low-to-moderate seismicity region relies on two important inputs: an earthquake catalog that gathers historical and instrumental earthquakes and a seismogenic source model that defines geographic areas where seismicity will be assumed homogeneous (area sources). All selected publications include such an area source model; some also consider a smoothed seismicity model [Woo 1996 method for papers published between 2004 and 2007; Frankel 1995 method for papers published after 2007], and four studies built a fault model. Supplementary Table 1 attempts to summarize the main features of each study. The first columns address the building of the source model: catalogs used, techniques applied to determine complete time windows and achieve declustering (i.e., identify clustered events and keep only the mainshocks), seismogenic source models considered, methods applied to evaluate earthquake recurrence parameters in each source zone, method of estimating maximum magnitudes, and handling of uncertainties. The remaining columns handle ground-motion prediction and hazard calculation: list of ground-motion models used, information on whether the variability of ground motion was accounted for, hazard codes employed, information provided on parameters related to the hazard calculations.
3.2. Earthquake catalog used
All earthquake catalogs rely on the SisFrance macroseismic database for the historical period; however, there are major differences in how magnitudes and locations are determined for historical events. In early publications [e.g., Bottard and Ferrieux 1992, Dominique and André 2000, Marin et al. 2004, Secanell et al. 2008], historical magnitudes were evaluated based on a single intensity assignment, epicentral intensity, and an empirical relation. As emphasized in Bakun et al. [2011], epicentral intensity alone cannot provide accurate estimates of location and magnitude, nor estimates of their uncertainty; therefore, most PSHA studies after 2004 include a historical catalog with magnitudes inverted from the set of intensity observations available for each earthquake, applying intensity–magnitude relationships. Magnitudes are provided together with their associated uncertainties, that can be propagated up to the hazard estimates in the hazard calculation.
Beauval and Scotti [2004], Beauval et al. [2006b], and Chartier et al. [2017a] use a historical catalog built at IRSN [2011 version is called FPEC, see Baumont and Scotti 2011]. These estimated magnitudes have been considered in the SHARE European Earthquake Catalog (SHEEC) developed for SHA at the European scale [Stucchi et al. 2013]. In SCHEEC, the magnitudes for earthquakes in France correspond to the weighted mean between FPEC magnitude and the magnitude derived via the Boxer method. Martin et al. [2017], Drouet et al. [2020], and Beauval et al. [2020] use the only historical catalog published and fully available at the time (i.e., FCAT), which was built by EDF and Geoter [Traversa et al. 2018, Manchuel et al. 2018]. FPEC and FCAT use the same location estimates (i.e., the SisFrance epicentral locations) for historical earthquakes.
For the instrumental period up to 2017, all catalogs used in hazard studies included LDG solutions, in which earthquakes are characterized by local LDG magnitude [ML, LDG 1998]. One major advantage of the LDG catalog is that it has reported the same ML since 1962; however, the ground-motion models to be used in hazard studies were first developed for surface magnitude [MS; e.g., pan-European models by Ambraseys 1995, Ambraseys et al. 1996, and Berge-Thierry et al. 2003], and then for moment magnitude [MW; e.g., western US models, next generation acceleration models, Abrahamson et al. 2008, Bozorgnia et al. 2014; or European models based on the RESORCE database, Douglas et al. 2014]. Use of the LDG catalog thus implies a magnitude conversion known to be responsible for strong uncertainties. Some authors [e.g., Clément et al. 2004, Beauval and Scotti 2004] prefer to make a conservative assumption that ML is equivalent to MS, whereas other authors [e.g., Marin et al. 2004] apply an in-house ML–MS conversion equation. After 2017, hazard studies use the SiHex instrumental catalog in MW that was built by a consortium of French seismologic networks and observatories [Cara et al. 2015]. This catalog constitutes the instrumental part of the FCAT catalog [Manchuel et al. 2018]. Moment magnitudes in this catalog have been obtained by applying different magnitude conversion equations [Cara et al. 2015]. This catalog is ready for use in hazard assessment studies. Several authors note issues related to estimation of MW in SiHex [e.g., Laurendeau et al. 2019] and the apparent lack of homogeneity of instrumental MW magnitudes with MW estimates for historical events in FCAT [Beauval et al. 2020; Figure 1]. Additional work is still needed.
FCAT catalog [Manchuel et al. 2018], issues related to inhomogeneity between the historical and instrumental periods. Left: cumulative number of events versus time: 3.5⩽MW < 3.8, 3.8⩽MW < 4.1, and 4.1⩽MW < 4.4. Right: subcatalog for a source zone in Northern Brittany [for the source zone that includes the Cotentin peninsula in the seismogenic source model, see Figure 2; Baize et al. 2013]; black vertical line corresponds to 1965, which is when the FCAT historical part is appended to the SiHex instrumental catalog.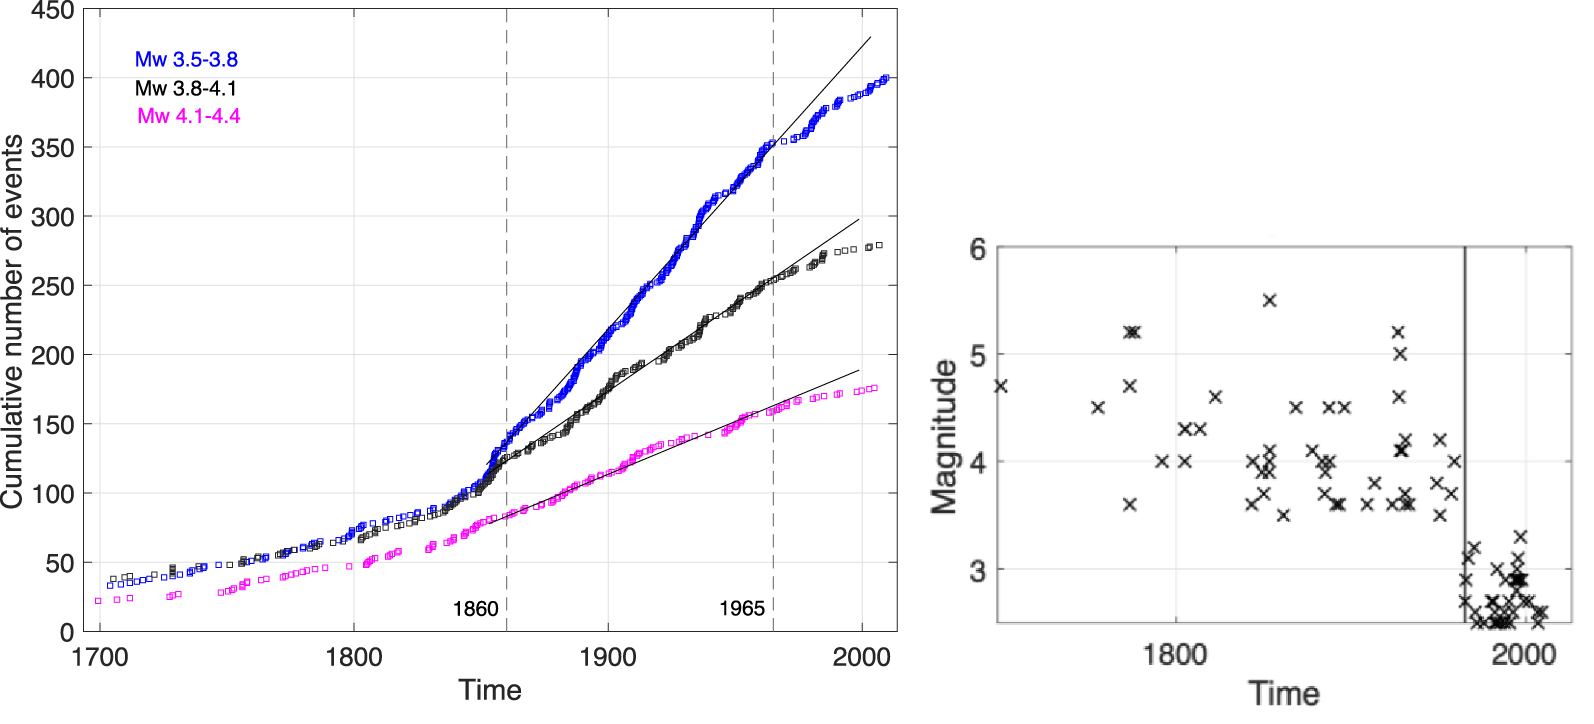
The academic community has produced the SiHex catalog; however, unlike our neighboring countries there has never been an earthquake catalog for France that represents an authoritative dataset for seismic hazard studies which merges historical and instrumental periods. This may be because there is no institution in France officially in charge of SHA. For example, Istituto Nazionale di Geofisica e Vulcanologia (INGV) in Italy [CPTI, Rovida et al. 2020], ETH in Switzerland [ECOS, Fäh et al. 2011], and GFZ in Germany [EMEC, Grünthal and Wahlström 2012]. Given the huge uncertainties associated with some historical events, a future catalog should clearly provide uncertainty ranges for all earthquake parameters or consists of a series of earthquake catalogs.
3.3. Seismogenic source models used
Most of the selected studies are based on a seismogenic source model made up of areal source zones considered in the hazard calculation to be homogeneous in terms of earthquake potential (i.e., seismic activity, focal mechanisms, depth distribution of earthquakes, maximum possible magnitude). Such a seismogenic model is based on analysis of available data: deep and surface geology, tectonic activity, geodetic information, historical earthquakes, and instrumental seismicity. Authors must hierarchize the criteria to be used in the delineation of sources, and final boundaries reflect understanding of the seismogenic processes of the region.
The first published seismogenic source model was produced by the Evaluation probabiliste de l’aléa sismique (EPAS) working group, which was started within AFPS in the 1990s. EPAS consisted of seismologists and geologists from different institutions and private companies (e.g., BRGM, GEOTER, IRSN, EDF, ICC-Barcelona). The objective was to obtain a consensual seismotectonic zonation that could be used for PSHA. The final zoning was published in the Proceedings of the European Conference on Earthquake Engineering [Autran et al. 1998]. To account for the inherent uncertainty associated with such work, zoning included a hierarchical classification for source zone boundaries, from solid to poorly defined limits. This zoning has been used in many seismic hazard studies [Dominique and André 2000, Clément et al. 2004, Beauval and Scotti 2004, Beauval et al. 2006b, Secanell et al. 2008], including those that led to the current French official zonation map [Martin et al. 2002] and the European seismic hazard map [Woessner et al. 2015; Figure 2a].
Example of two seismogenic source models used in PSHA calculations: (a) model used in ESHM13 [Woessner et al. 2015], built from the EPAS source model [Autran et al. 1998]. (b) Baize et al., 2013 model (aggregated version). Stars: sites considered in the Section 3.8: Nantes, Lourdes, Clermont-Ferrand, Strasbourg, Briançon, Nice, Grenoble, Rambervillers, and Le Teil.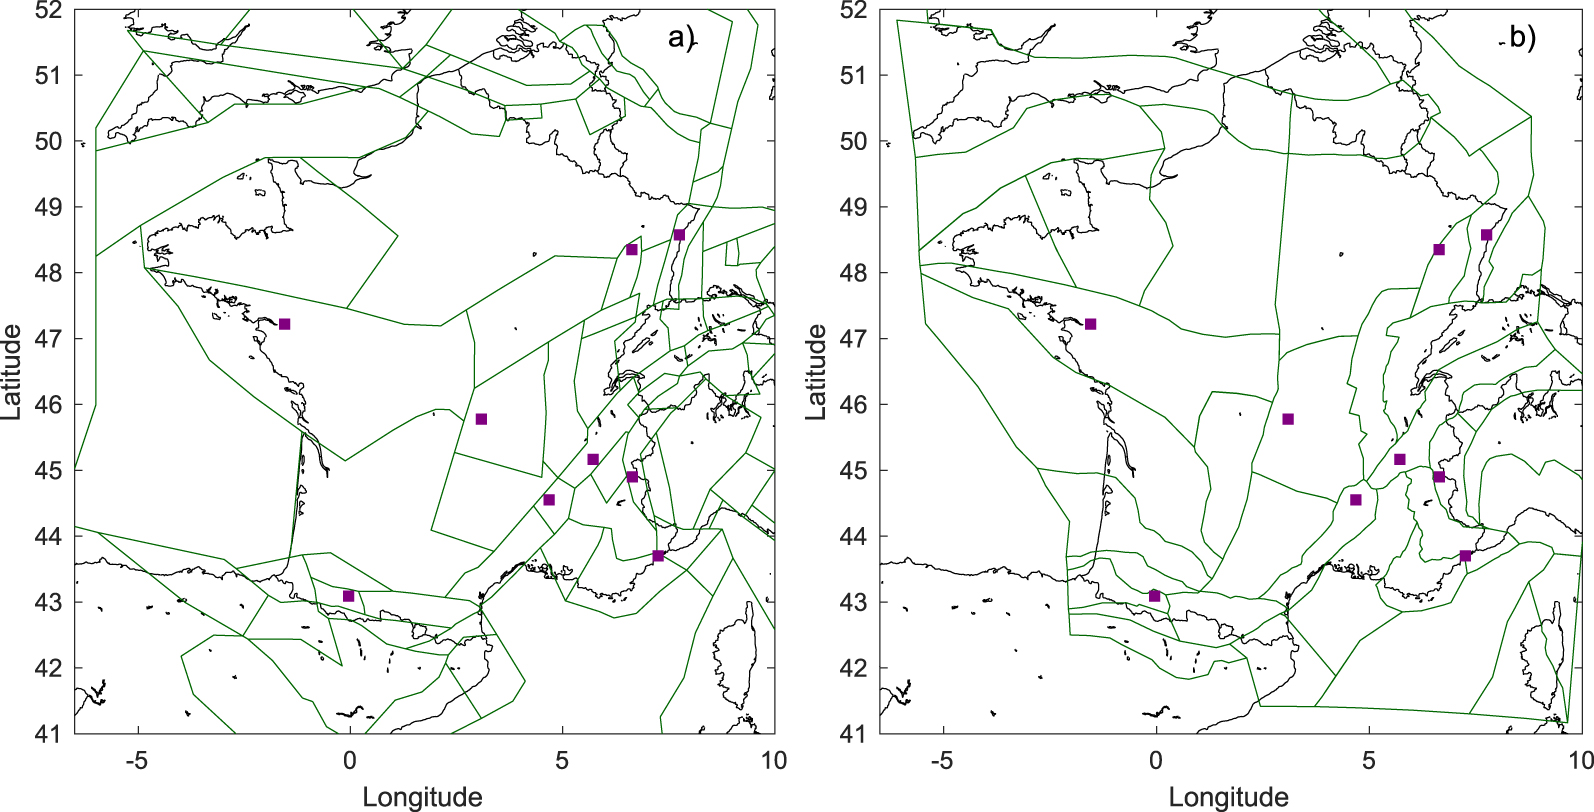
More recently, Baize et al. [2013] published a seismogenic source model for France that presented the zoning scheme used at IRSN (Figure 2b). This model builds on previous works, including EPAS, and provides detailed explanations of the philosophy behind the zoning, the criteria applied to delineate source zones, and the uncertainties associated with source zone limits. Dynamic criteria (e.g., seismicity, stress field, neotectonics) are superimposed with static criteria (e.g., geology, structural and rheologic properties of the crust) to determine boundaries. Several alternative sets of source zones can be derived from this seismogenic source model to account for uncertainties. This seismogenic source model has been used in all published seismic hazard studies from and after 2017 [Chartier et al. 2017a, Martin et al. 2017, Drouet et al. 2020, Beauval et al. 2020; see Supplementary Table 1]. It was also used to build the ESHM20 seismogenic source model; border modifications were made to account for models proposed by neighboring countries [Danciu et al. 2021].
France also has other seismogenic source models. The Geoter model has been used in different hazard studies performed by the eponymous company and in two publications: Martin et al. [2017] and Drouet et al. [2020]. Le Dortz et al. [2019] described this models latest update in an AFPS conference proceeding. Another model has been developed by EDF [used by Drouet et al. 2020], but it is not yet published. All of these models use research findings obtained by both the academic and engineering communities. A seismogenic source model will be developed in the near future that represents the vision of the academic community, thanks to the efforts of RESIF through Action Transverse Sismicité (ATS).
3.4. Earthquake recurrence modeling
In each area source, an earthquake recurrence model is built from the earthquake catalog. A model that predicts an exponential decrease of earthquake frequencies with increasing magnitudes is used, following the well-known Gutenberg–Richter model [Gutenberg and Richter 1944; GR]. The presence of aftershock sequences and swarms in an earthquake catalog may bias determination of the b-value, the slope of the GR model, toward abnormally high values. A declustering algorithm is usually applied to remove clustered events from the earthquake catalog. Time periods of completeness are then evaluated for different magnitude intervals in the declustered catalog. The long-term earthquake recurrence model can be established from observed seismic rates calculated over time periods of completeness. The 11 previously mentioned selected publications use the Weichert [1980] maximum likelihood method to infer recurrence parameters from the observed seismic rates. The determination of earthquake parameters is reproducible if the following information is provided: indication of the declustering algorithm used and its parametrization; indication of the time windows of completeness per magnitude interval; minimum magnitude (or magnitude range) and magnitude bin width used to model the recurrence, and number of events involved. At last, the strategy applied for the source zones that contain few events needs to be described. Few publications provide all the information required for the recurrence modeling to be fully reproducible; however, from the early publications to the most recent ones, the tendency is to provide more and more information.
3.4.1. Declustering
Several publications observe that the catalog for France is only weakly clustered; Beauval and Scotti [2004], Clément et al. [2004], and Beauval et al. [2006b] did not apply any declustering. This was based on the number of events identified by the Reasenberg [1985] algorithm and considering magnitudes ML down to 3.5. Marin et al. [2004] does not mention the presence of clusters in the catalog nor any declustering; however, starting in 2008, all studies include a declustering stage in the earthquake recurrence modeling procedure. Secanell et al. [2008] apply windows in time and space to identify and remove aftershocks, thus applying the Gardner and Knopoff [1974, GK74] method without explicitly naming it. Martin et al. [2017] apply the GK74 windowing technique with window parameters from the original publications by Gardner and Knopoff [1974] that were established from earthquake sequences in southern California. Drouet et al. [2020] apply the GK74 windowing technique with windows from Burkhard and Grünthal [2009] that are known to be more conservative than the original windows. Considering magnitudes down to MW 2.5, they find 30% of clustered events. Beauval et al. [2020] compare two alternative algorithms on events with MW ⩾ 2.0: Reasenberg [1985], which leads to 20% clustered events (with uncertainties on earthquake locations accounted for), and GK74 with Burkhard and Grünthal [2009], which leads to 33% clustered events [roughly consistent with the percentage obtained by Drouet et al. 2020].
Beauval et al. [2020] quantify the impact of the declustering algorithm selected for hazard levels at six sites located in the most active regions in France. They show that although the impact of the declustering algorithm choice depends on the site, it is often negligible. This impact is related to the minimum magnitude used in recurrence modeling [MW 3.2 in Beauval et al. 2020]. In areas where earthquake recurrence models are poorly constrained because of scarcity of data, it is worth going down to lower magnitudes. The number of clustered events increases with decreasing magnitude [see, e.g., Drouet et al. 2020]. Issues related to the presence of non-tectonic events in an earthquake catalog increase with decreasing magnitude [e.g., quarry blasts; Cara et al. 2015]. Given the scarcity of data in some regions, a lower magnitude range needs to be included in modeling; however, in this case, decisions related to declustering might have a larger impact on hazard, but testing is needed.
It is common to decluster an earthquake catalog before modeling recurrence in hazard studies. Practical reasons include that aftershock sequences and swarms may bias estimation of the b-value and lead to the forecast of underestimated rates for the upper magnitude range. Clusters may also be responsible for overpredicting future rates in the neighborhood of past earthquakes (in smoothed seismicity models). Nonetheless, aftershocks contribute to the hazard and should be accounted for [see, e.g., Beauval et al. 2006a, Boyd 2012]. The most meaningful method might be through time-dependent probabilistic seismic hazard [i.e., how long-term hazard estimates are modified after a significant event; see, e.g., Gerstenberger et al. 2016].
3.4.2. Completeness
Dependence of the earthquake recurrence model on earthquake catalog choice. Left: recurrence model for FCAT (magenta) and ESHM13 catalog (black) at the scale of France; overlap of rates in the magnitude range 4–5. Right: same plots as in the left panel but at the level of the Southern Brittany source zone (see Figure 2b); in this case, the rates modeled from FCAT are twice as high as the rates modeled from the ESHM13 catalog. Solid line: model. Symbols: observed rates estimated from the catalog.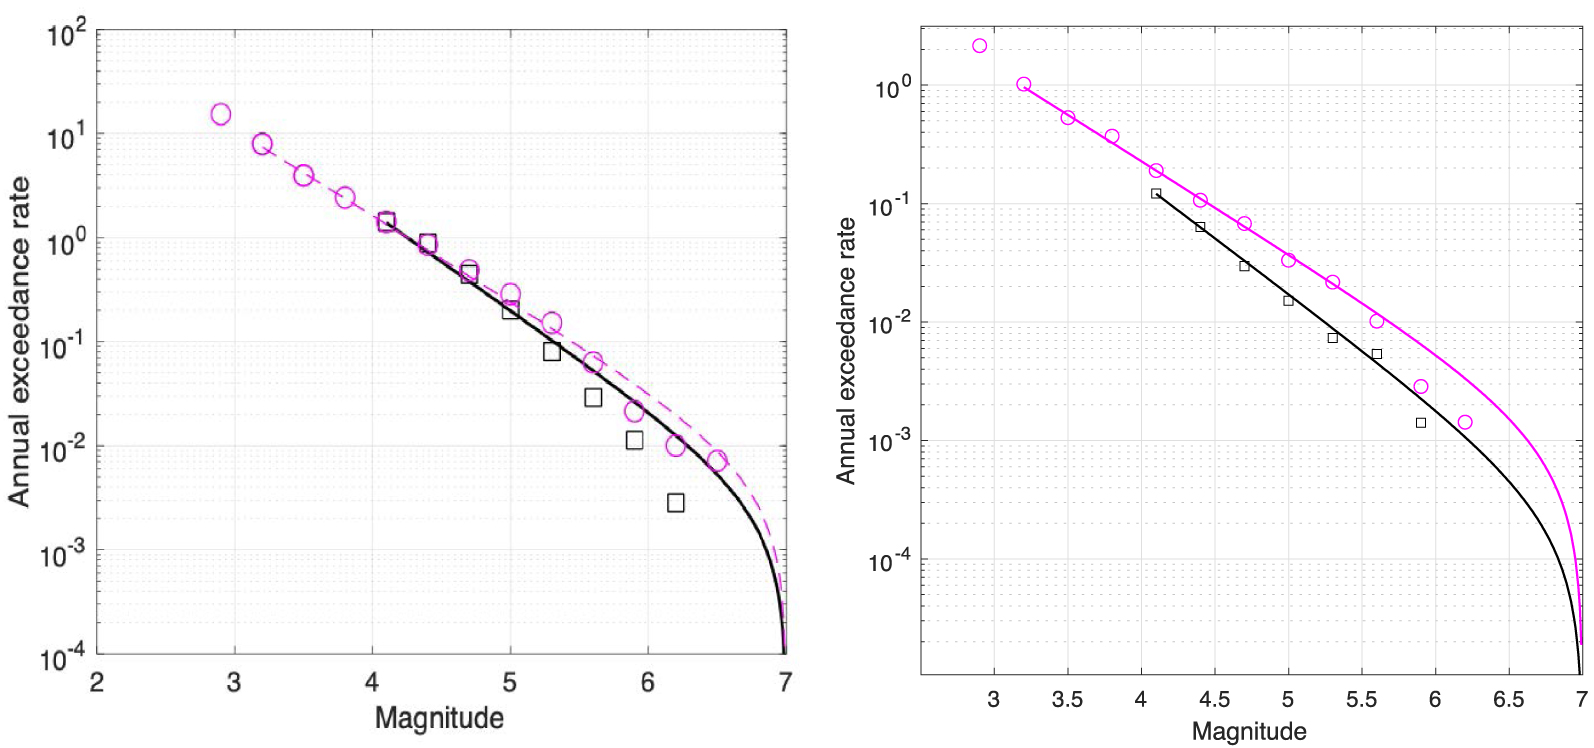
Methods rely on distribution of the number of events in time and the assumption that earthquakes follow a stationary Poisson process. For a given magnitude interval, all methods aim to detect the most recent period characterized by a constant seismic rate. The linear method consists of plotting the cumulative number of events with respect to time and is most widely used [Beauval and Scotti 2004, Clément et al. 2004, Martin et al. 2017, Drouet et al. 2020, Beauval et al. 2020; see Figure 3]. Some authors also apply the Stepp [1972] or the Albarello et al. [2001] methods. Regardless of the method used to evaluate time windows of completeness, the results have large uncertainties. All methods have the same limits: (1) determination of the time window of completeness is extremely uncertain for upper magnitude range intervals with too few events; (2) for lower magnitude intervals, seismic rates can fluctuate for reasons that are not natural, due to modifications in the determination of the magnitude along the years or due to the application of magnitude conversion equations.
One way to circumvent these issues is to apply methods that are not dependent on earthquake data. For the historical part of the catalog, completeness can be estimated by, “looking outside the datasets; that is, investigating the way historical records have been produced, preserved and retrieved”, Stucchi et al. [2004]. For time periods in which no earthquakes were reported, historians propose assessing whether historical sources reported other events (either natural or political) or no events at all [see Stucchi et al. 2004] during those periods. For the instrumental part of the catalog, completeness can be evaluated based on seismologic network capacities (e.g., estimation of station earthquake detection probabilities [e.g., Schorlemmer and Woessner 2008]).
Among the 12 selected publications, Martin et al. [2017] and Drouet et al. [2020] consider uncertainty of the determination of time windows of completeness. For each magnitude interval, Drouet et al. [2020] define a best estimate, as well as lower and upper bounds. Evaluated uncertainty can reach one century for the largest magnitudes’ interval. This uncertainty is accounted for through generation of a set of synthetic earthquake catalogs. Hazard levels that result from logic tree sampling thus integrate this uncertainty.
3.4.3. Mmax values
Maximum magnitude (Mmax) characterizes the largest earthquake that can occur in a source zone. In France, Mmax has received more attention than other parameters and decisions in building source models. This is because of the possible connection with the séisme maximal de sécurité (SMS) earthquake concept that is used in deterministic seismic hazard studies in the nuclear practice (Règle Fondamentale de Sûreté, RFS 2001-01).
An Mmax value is required to bound the GR recurrence models. Choosing Mmax thus defines the range of magnitudes that will contribute to the estimation of hazard levels. It is well known that the contribution of the upper magnitude range increases for increasing spectral periods and increasing return periods. Beauval and Scotti [2004] quantified the impact of Mmax on hazard at a series of sites in France. In their hazard study, the choice of Mmax 7.0 rather than 6.5 leads to an increase of hazard levels at 1 Hz around 10%–15% at a 100-year return period (0%–5% at PGA), and around 20%–30% at a 100,000-year return period (10%–15% at PGA).
Determining Mmax leads to huge uncertainties. The only agreed-on principle regarding Mmax is that it cannot be lower than the largest observed earthquake in the source zone. Otherwise, how much Mmax should depart from the maximum observed magnitude varies strongly among experts. For example, in two models published in 2004, Clément et al. [2004] define a minimum bound for Mmax of 7.0 throughout France, whereas Marin et al. [2004] defines Mmax based on maximum observed magnitudes and attribute values of 4.0 in the Rhine–Saône Sill source zone, 4.9 in the Paris basin, and 6.1 in the External Alps zone. More recently, Beauval et al. [2020] applied a minimum–maximum magnitude equal to 6.5 throughout France on the basis that earthquake catalogs are not long enough to represent seismic potential and on the basis that examples in other regions of the world with comparable tectonic characteristics have proven this level of magnitude can occur anywhere, even with very low occurrence probabilities.
Most authors consider the uncertainty on the maximum magnitude. Secanell et al. [2008] and Clément et al. [2004] define an uncertainty interval for Mmax that is explored with Monte Carlo sampling in the recurrence modeling process (uniform probability density distribution). Martin et al. [2017] and Drouet et al. [2020] also explore a probability density function (pdf) for Mmax, but with a probability decreasing from the minimum bound to the maximum bound. For example, Drouet et al. [2020] define a range for Mmax of 6.3–7.1 in the Rhine Graben, with a probability associated to 7.1, that is, 18 times lower than the probability associated with 6.3. They apply what is called the EPRI approach [Johnston et al. 1994] in order to establish these pdfs for the source zones. This method is commonly considered to be a compromise, as currently there is no “satisfying answer to the Mmax problem” [Wiemer et al. [2016]; page 49, application of the EPRI approach in Switzerland]. The method proposes combining prior global information with local data. Decisions are required, that control the final Mmax pdfs: (1) the extension of the sampled region to establish the prior distribution for Mmax—the original proposition by Johnston et al. [1994] was to consider global data; Martin et al. [2017] and Drouet et al. [2020] consider more restricted geographic areas in Europe—and (2) the size of the zone considered to define the likelihood function for Mmax. Depending on these decisions, substantially different Mmax distributions can be obtained for a given source zone.
There is no ideal method to determine Mmax that eliminates debate and delivers the true maximum magnitude value. A solution to handle these uncertainties would be to quantify the impact on hazard of a range of Mmax values in every hazard study and clearly identify the spectral and return periods for which Mmax matters. There would be an irreducible uncertainty associated with the hazard estimate that is related to the difficulty of constraining this parameter.
3.5. Fault models
To account for faults in a seismic hazard study, a minimum level of information regarding its 3D geometry and amount of deformation accumulating on the fault is required. This level of detail is not available for most faults in France, and only four publications explicitly consider a fault model (see Supplementary Table 2). Three of these [i.e., Marin et al. 2004, Clément et al. 2004, Martin et al. 2017] focus on the Provence area, including faults such as the Middle Durance and Trévaresse faults. The fourth publication [i.e., Chartier et al. 2017a] studies the Upper Rhine Graben; fault parameters are from the fault database published by Jomard et al. [2017].
In the early publications by Marin et al. [2004] and Clément et al. [2004], earthquake rates on the faults are inferred from the GR frequency–magnitude distribution established at the level of the source zone (hosting the faults). Clément et al. [2004] also propose a model in which earthquake recurrence relies on slip rate estimates. Using slip rates to infer earthquake occurrences on faults is now standard practice. Chartier et al. [2017a] and Martin et al. [2017] define a range for the slip rate to account for the huge uncertainty. In these publications, as is done in many studies worldwide [e.g., Woessner et al. 2015], the maximum magnitude for events in the background is set to the minimum magnitude of events that occur on faults [around MW 5.9–6.0, except for Marin et al. 2004, in which the maximum magnitude in the background is set to 5.1]. The full slip rate is considered to estimate the seismic moment rate to be released in earthquakes (i.e., no aseismic deformation).
Chartier et al. [2017a] is the only publication that explores the uncertainties related to the different parameters required to build the fault model in depth. They quantify the impact on hazard of (1) different assumptions on which fault accommodates deformation, (2) the uncertainty on the dip and extension of the fault plane at depth, (3) the uncertainty on the slip rate, and (4) the uncertainty on the earthquake recurrence model (GR or characteristic). In the Upper Rhine Graben, they demonstrate that the uncertainty on the slip rate controls hazard levels (an uncertainty of 0.04–0.1 mm/year leads to 40% variability of the hazard at a 10,000-year return period for a site located 7 km from the fault).
Different models are used in the literature to distribute the seismic moment rate estimated over a magnitude range; the GR exponential and the characteristic model are the most well known. Clément et al. [2004] and Chartier et al. [2017a] test use of the GR model. All four of the previously mentioned publications test use of the characteristic model, but they use different definitions and implementations. Clément et al. [2004] and Chartier et al. [2017a] apply the Wesnousky [1986] definition—one earthquake that breaks the whole fault releases all the deformation. Martin et al. [2017] uses the Youngs and Coppersmith [1985] model, which is a combination of a GR model in the moderate magnitude range and a uniform distribution over the upper magnitude range (centered on Mmax).
Action Transverse Sismicité (ATS) of RESIF is working on identification and characterization of active faults. The Failles actives working group (FACT) is currently carrying out studies in different regions. As a result of this effort, the first fault database, which was published by Jomard et al. [2017] and does not cover all of France, will be completed in the short term. Their findings are key for establishing future seismogenic source models for the country and contributing to the development of more realistic fault models in the best-characterized regions. Depending on the level of details obtained, segmentation might be relaxed for some faults in the future, and fault connectivity may be accounted for [e.g., Chartier et al. 2017b, Valentini et al. 2020].
3.6. Ground-motion models used
All selected studies deliver hazard in terms of ground motions, with the exception of the early PSHA study by Bottard and Ferrieux [1992], which applies equations that predict the attenuation of macroseismic intensities with distance and deliver a hazard map in intensity. France is a low-to-moderate seismicity region, and, even at present, despite the RAP-RESIF instrumentation program that was launched in the mid-1990s, there are still very few recordings available for the magnitude and distance ranges that control seismic hazard at return periods of interest. A ground-motion model must be established on an extended dataset to be valid and cover broad magnitude and distance ranges to obtain a reliable estimate of median ground-motion levels and associated variability. Ground-motion databases are thus constituted of gathering recordings from large spatial areas. PSHA studies by Dominique and André [2000], Clément et al. [2004], and Secanell et al. [2008] use the pan-European and Middle East models of Ambraseys [1995] and Ambraseys et al. [1996]. At that time, European models did not include French recordings. Similarly, the Berge-Thierry et al. [2003] model is established from a European dataset combined with a few records from the western United States in the upper magnitude range and is used in Clément et al. [2004], Beauval and Scotti [2004], and Beauval et al. [2006b]. This model remains as the authoritative ground-motion model in the French Fundamental Safety Rule (RFS 2001-01). The Berge-Thierry et al. and Ambraseys’ models are defined in terms of surface MS magnitude and are valid for earthquakes with magnitudes ⩾4. However, these models should not be used nowadays due to limitations of the database, including: (1) the lack of data from large magnitudes at close distances and from small magnitudes at large distances, (2) ground-motion variability was underestimated, and (3) instrumented sites were very poorly characterized and the site classes used were too simplistic.
Marin et al. [2004] and Secanell et al. [2008] favor the use of local data to establish a ground-motion model in ML (LDG magnitude). Marin et al. [2004] predicts ground motions with an in-house model that relies only on French data (14 earthquakes with 2.6 ⩽ ML ⩽ 5.6; horizontal PGAs inferred from vertical velocimeters). One advantage is that the definition of magnitude in the ground-motion model is consistent with the magnitude of the earthquake catalog. Possible drawbacks include a potential underestimation of ground-motion variability (i.e., restricted number of earthquakes) and use of poorly constrained amplitudes outside dataset validity limits. In a project focused on the Pyrenees, Secanell et al. [2008] use the Tapia et al. [2007] ground-motion equation, which is based on a western Mediterranean dataset that includes nine events in the Pyrenees. The model is combined with the Ambraseys [1995] and Ambraseys et al. [1996] equations for magnitudes ⩾ ML 5.0.
In the most recent studies, all selected ground-motion models are in terms of moment magnitude. They rely on different databases and functional forms and are selected to populate a logic tree aimed at covering the epistemic uncertainty in the area of interest. One way to select the model is to quantify its ability to predict the available local data [e.g., Delavaud et al. 2012]. Beauval et al. [2012] compared the predictions of a set of models available at the time with amplitudes from low-magnitude ground motions recorded in France by the RAP-RESIF network. Although models best adapted to this dataset were identified, the study showed that extrapolating results to moderate-to-large magnitude ground motions is not straightforward.
In PSHA studies published since 2017, at least one model has been selected from the next generation attenuation (NGA) projects based on global data and data from the western United States [e.g., the model of Boore and Atkinson 2008 in Chartier et al. 2017a, or the model of Abrahamson et al. 2014 in Drouet et al. 2020]. Some studies select a model established by the European and Middle East RESORCE database [Akkar et al. 2014b] [e.g., Akkar et al. 2014a in Martin et al. 2017, Bindi et al. 2014 in Beauval et al. 2020]. Most studies also include a global model enriched with Japanese data, [i.e., Cauzzi and Faccioli 2008 in Chartier et al. 2017a, Cauzzi et al. 2015 in Drouet et al. 2020]. The exact list of models used in each study is indicated in Supplementary Table 1. The authors choose a minimum magnitude for hazard calculations that is larger or equal to the magnitude validity limit of these models [e.g., Mw 5.0 in Chartier et al. 2017a; Mw 4.5 in Martin et al. 2017, Drouet et al. 2020, and Beauval et al. 2020].
Martin et al. [2017] and Drouet et al. [2020] are the first hazard studies to use ground-motion models in Mw that use French recordings and are specifically established for the French context: (1) the Ameri [2014] model, calibrated on a European database, including French low-magnitude recordings, and (2) the Drouet and Cotton [2015] stochastic model parameterized with low-magnitude events from the Alps. Both PSHA studies attribute a weight of 50% to these French models. Use of these existing, small-to-moderate magnitude events to tune ground-motion models developed from broad datasets [e.g., Kotha et al. 2020] will be optimized by ongoing efforts to (1) build a ground-motion database with controlled metadata [Traversa et al. 2020] and (2) to characterize recording stations with reliable and quantitative site metadata [Hollender et al. 2018].
3.7. Exploring and understanding uncertainties
Seismic hazard studies aim to forecast the occurrence rates of future ground motions by combining earthquake occurrence probabilities with their capacity to exceed given ground-motion levels. This goal is ambitious, and there are uncertainties at every step [see, e.g., Beauval 2020, for a review]. Early PSHA studies in France [i.e., Bottard and Ferrieux 1992, Dominique and André 2000] acknowledged these difficulties, but they did not implement a strategy to track uncertainties and propagate them with the final results. In subsequent studies, uncertainties are accounted for by sampling logic trees that combine a source model logic tree and a ground-motion model logic tree. The ground-motion logic tree consists of a selection of equations, with the aim of covering epistemic uncertainty in ground-motion predictions in the area of interest [see, e.g., Delavaud et al. 2012; epistemic indicates uncertainties related to the knowledge limit]. There are fewer guidelines for building the source model logic tree, and its structure varies between studies. Some uncertainties (e.g., uncertainty on earthquake recurrence parameters) are routinely accounted for, but others (e.g., uncertainties related to building the earthquake catalog) are considered by only a few authors and are ignored in many studies. The uncertainty issue has been treated differently in the publications selected here.
In 2004, two studies delivered information on which parameters control hazard estimates in France. Beauval and Scotti [2004] quantify the impact of source model uncertainties on hazard and run Monte Carlo simulations to understand the level at which uncertainties on earthquake magnitudes and locations may impact earthquake recurrence models and hazard levels. They show that the magnitude-intensity correlation chosen to build the earthquake catalog may impact hazard levels up to 30%. They also demonstrate how the minimum magnitude used in hazard calculations may impact hazard levels for short return periods and quantify the increasing impact of the Mmax chosen with increasing return periods. Clément et al. [2004] is the first peer-reviewed publication that presents PSHA results for France that includes a logic tree.1 They obtain a distribution for the hazard at a given return period that represents uncertainties on the source and ground-motion models. Their objective is to identify the controlling parameters and understand where contributions come from in terms of magnitude and distance, depending on the recurrence model assumed for diffuse seismicity and faults.
Martin et al. [2017] and Drouet et al. [2020] set up a logic tree to derive mean and percentile hazard estimates. Their objective is to evaluate hazard levels that can be compared with current French regulations, and they follow commonly accepted standards [e.g., Woessner et al. 2015] that consider both area and smoothed seismicity models. They also explore the uncertainties on earthquake magnitudes, completeness time windows, seismogenic source models, recurrence parameters, and maximum magnitudes. Like most hazard studies, they use only one earthquake catalog (i.e., FCAT). The source model logic tree is combined with a set of ground-motion prediction equations. They compare their results with acceleration distributions obtained in other studies [e.g., the Martin et al. 2002, study used to establish the actual French regulation, or ESHM13 results Woessner et al. 2015].
Beauval et al. [2020] aims to perform an analysis quantifying the impact of decisions made while building a source model on final hazard levels. Their work is performed in the framework of the new European Seismic Hazard Model [ESHM20, Danciu et al. 2021], in which an earthquake catalog and a seismogenic source model had to be selected for France. Results are derived for sites located in six areas of France where earthquake recurrence models are best constrained. They show that, depending on which earthquake catalog is used to model earthquake recurrence [FCAT, Manchuel et al. 2018, or SHEEC, Woessner et al. 2015], hazard levels may vary up to 50%. Choice of earthquake catalog and which minimum magnitude is used for recurrence modeling may also significantly impact recurrence parameters and associated hazard levels. The authors show that the source model can generate a variability on the final hazard level that is as high as the variability from the uncertainty on ground-motion predictions.
3.8. Hazard levels obtained
In the last 30 years, a number of hazard studies have delivered hazard levels for some sites, some regions, and sometimes at the scale of mainland France (see Supplementary Table 1). We select nine sites in France to show the evolution of hazard levels in terms of PGA at a 475-year return period (Figures 4 and 5). Four sites are located within the highest seismicity zone of the actual French zonation (Z4; Lourdes, Nice, Briançon, Grenoble). Four other sites are located in the immediate lower zone, called “moderate seismicity” (Z3; Nantes, Clermont-Ferrand, Strasbourg, Le Teil). The last site, Rambervillers, is located in the “weak seismicity” zone (Z2). Both Rambervillers and Le Teil were struck by an earthquake with magnitude MW close to 5.0 in 2003 and 2019, respectively. Early studies [e.g., Dominique and André 2000] provide only one value that is based on one calculation (i.e., best estimate). Most studies rely on a logic tree and provide a distribution for PGA. The metrics chosen vary by study, as indicated in Figure 4. For example, Secanell et al. [2008] provides the 15th and 85th percentiles of the distribution obtained, whereas Martin et al. [2002] provides the 25th and 75th percentiles. We also include results from the European projects [in magenta; GSHAP, Grünthal et al. 1999; SHARE, Woessner et al. 2015; ESHM20, Danciu et al. 2021], as well as hazard levels obtained in the hazard calculations by Martin et al. [2002].
Evolution of PGA values on rock at the 475-year return period, as a function of year, for five cities in France. The corresponding list of publications is in Supplementary Table 1. Points are used when only a best estimate hazard value was calculated [GSHAP 1999; Dominique and André 2000]. Bars indicate distribution percentiles. These percentiles vary by study: 15th and 85th in Secanell et al. [2008], Drouet et al. [2020], and Woessner et al. [2015]; 16th and 84th in Martin et al. [2017], Beauval et al. [2020], and Danciu et al. [2021]; and 25th and 75th for Martin et al. [2002]. Results of European projects are in magenta, hazard values from FUGRO/GEOTER are in blue, and hazard values from Dominique and André [2000], Beauval et al. [2006b], and Beauval et al. [2020] are in black. It was not possible to access numeric files for Marin et al. [2004], in gray]; the bar does not correspond to given percentiles, it is the range inferred from their best estimate hazard map (Figure 14 in their paper); in addition, their PGA values include the effect of geologic conditions (factor of 1.6 [soft rock] or 2.2 [firm soil], see their paper).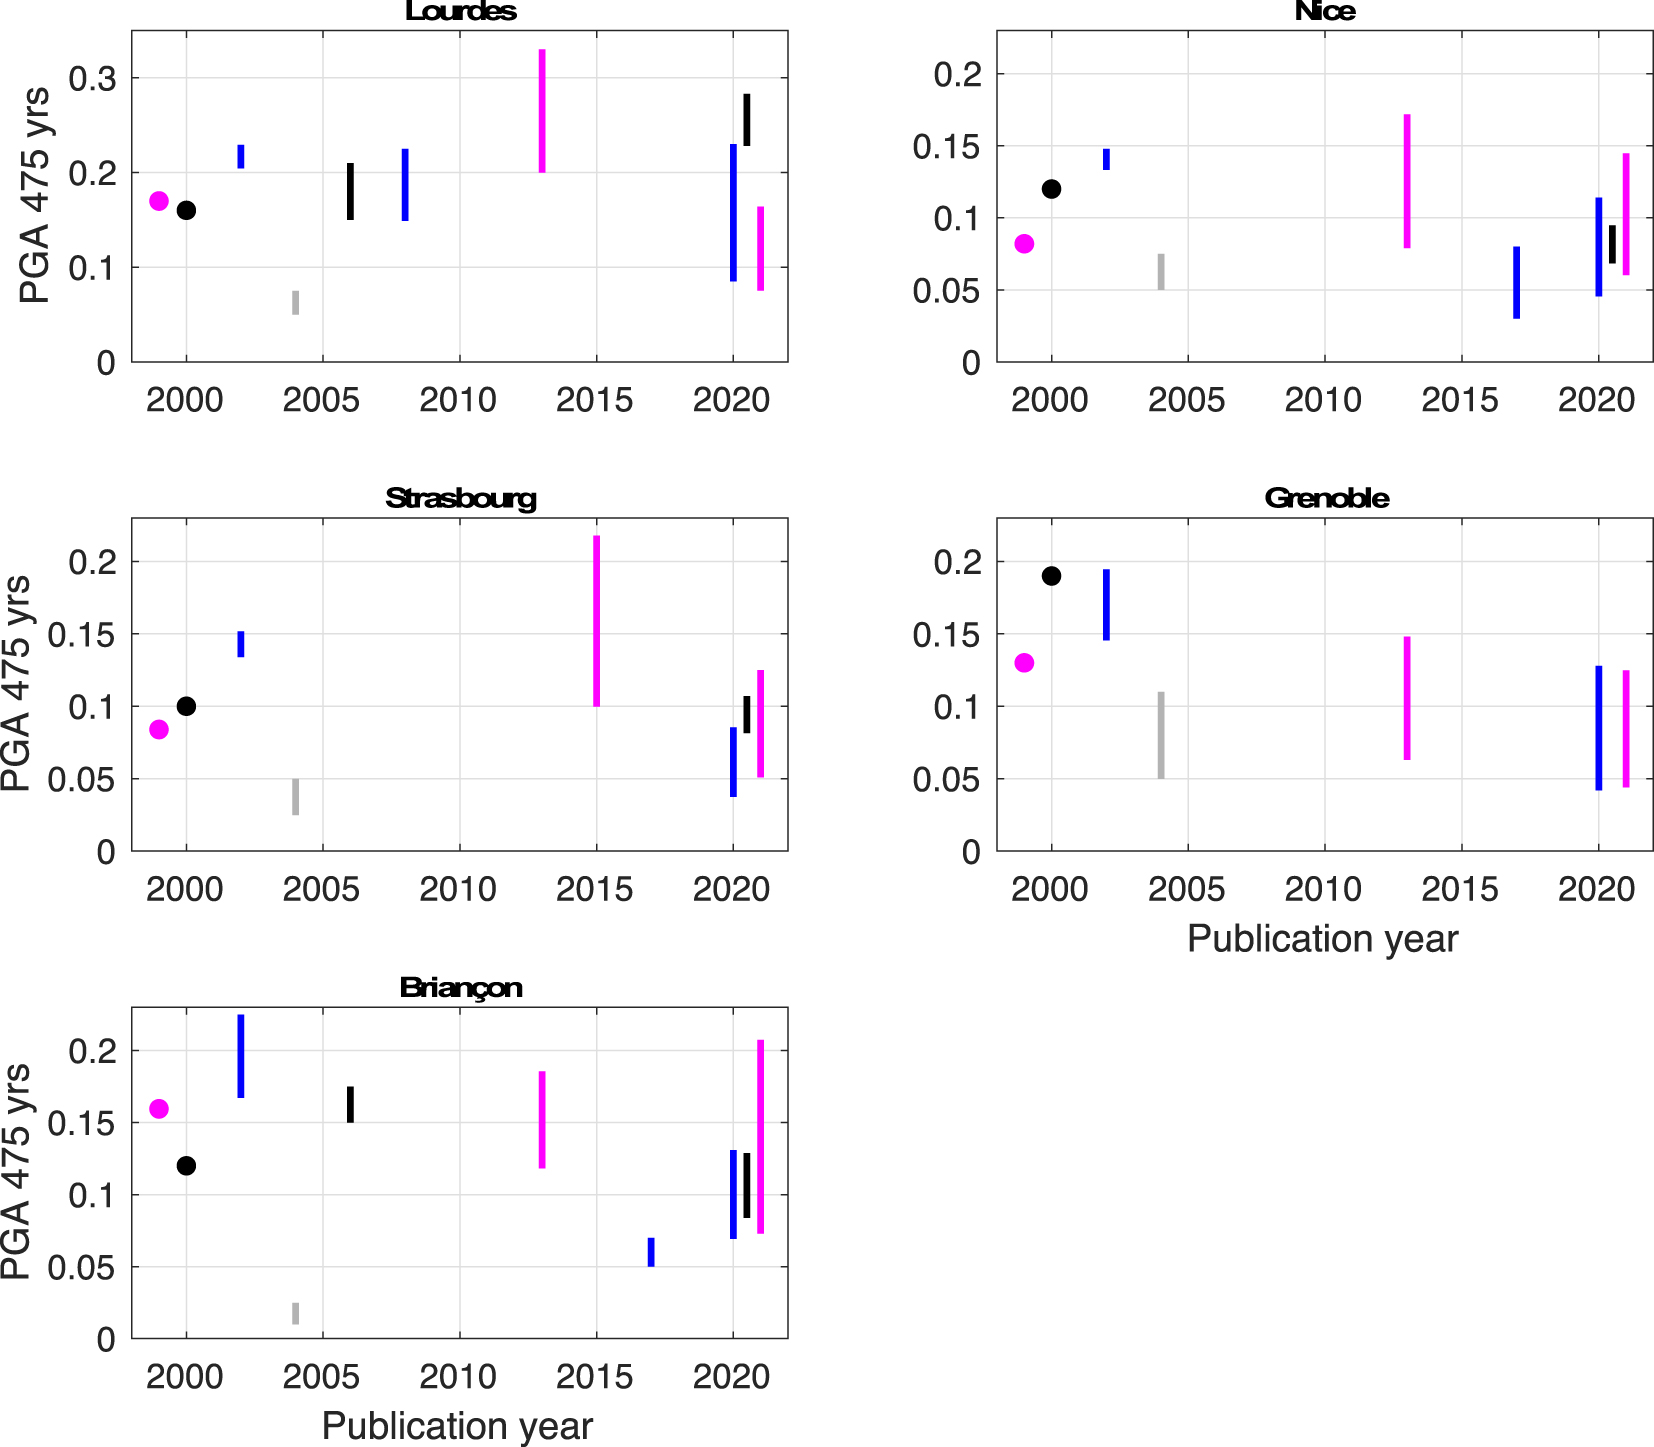
Evolution of PGA values on rock at the 475-year return period, as a function of year, for four additional cities in France. See Figure 4 legend.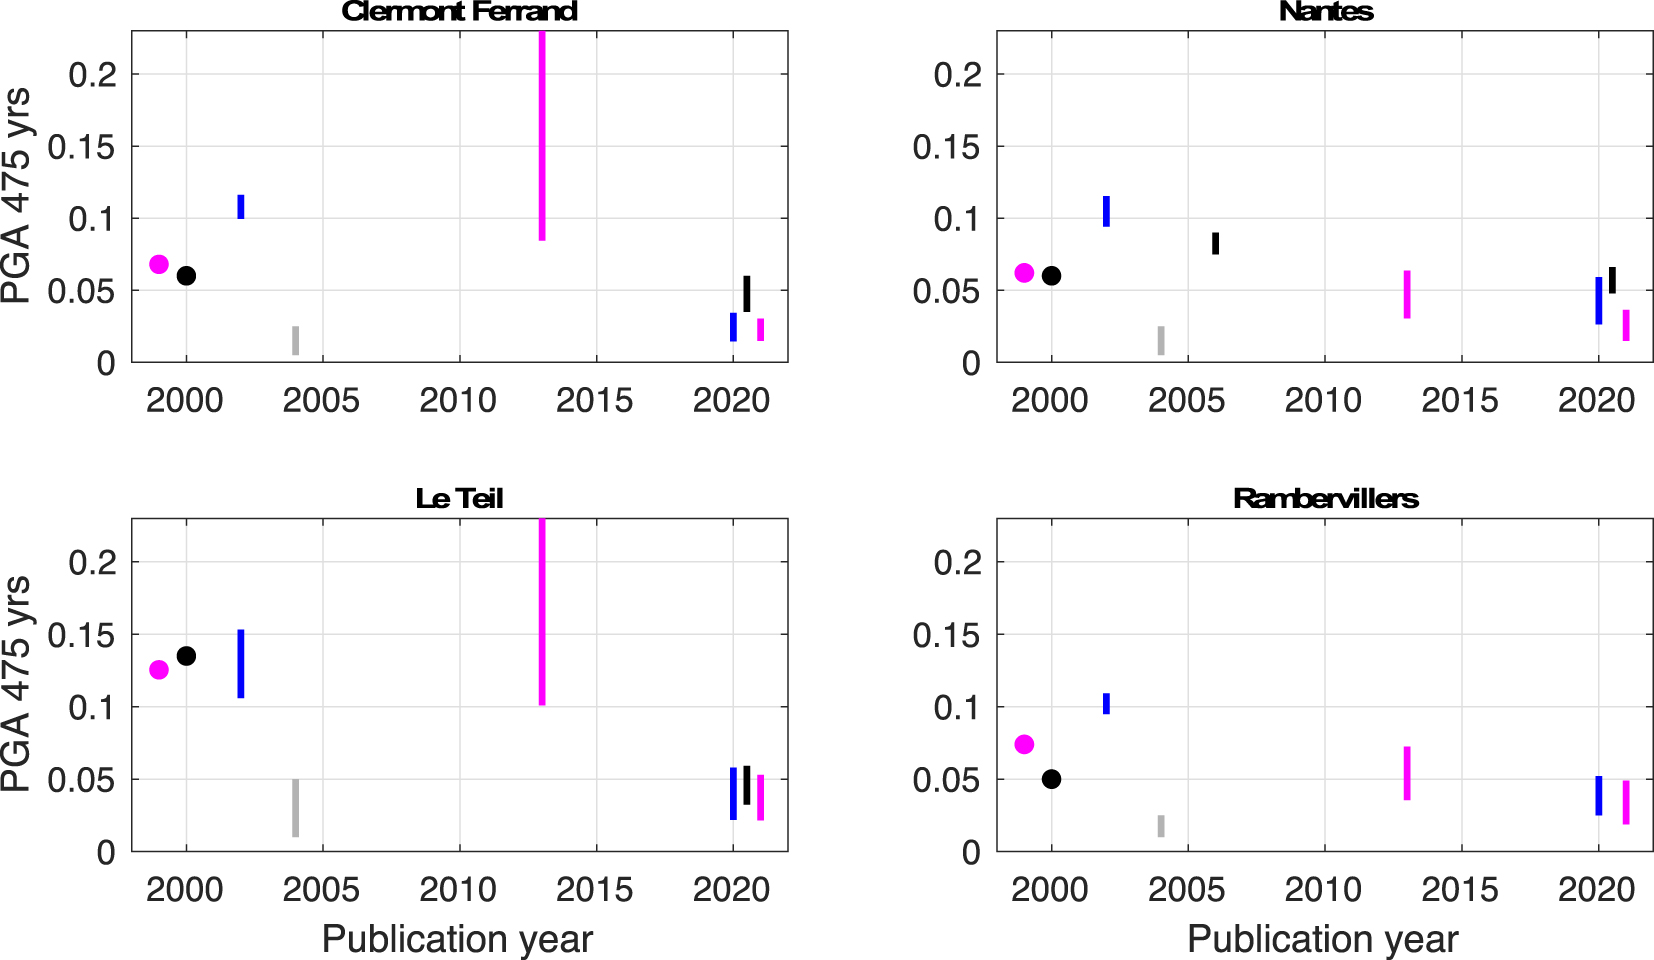
These plots show the inherent variability of hazard results, which are due to the high level of uncertainties associated with such calculations, as well as the evolution of knowledge related to the increase of data and improvement of models. Besides, these plots show that hazard levels obtained in the late 1990s [Dominique and André 2000; GSHAP] often fall within the range of the 2020 studies. It is also worth noting that the latest studies [Drouet et al. 2020, Beauval et al. 2020, ESHM20 by Danciu et al. 2021] provide hazard distributions with a significant overlap. In Nice, the 2020 studies cover the interval 0.05–0.14 g, with an overlap over the interval 0.07–0.095 g (PGA at a 475-year return period). In Strasbourg, the 2020 studies cover the range of 0.04–0.12 g. In Briançon, the common range between the 2020 studies is 0.08–0.13 g. Nonetheless, in Lourdes and Nantes, results based on Beauval et al. [2020] indicate larger levels than in Drouet et al. [2020] or ESHM20. In Le Teil, which is located in an area where the earthquake recurrence model is extremely poorly constrained, the interval is 0.02–0.05 g; this consistency between 2020 calculations is surprising. Estimation of hazard in areas where earthquake recurrence models are poorly constrained have large uncertainties, and it would be expected that epistemic uncertainties are larger in low seismicity regions.
The plots also highlight two studies that are rather conservative according to present knowledge. The Martin et al. [2002] study usually provides levels larger than other studies, except for ESHM13. The most conservative hazard calculations are clearly associated with the ESHM13 model. In five out of nine cities, ESHM13 provides the largest hazard levels and the largest variability. Although the Marin et al. [2004] hazard estimates include the amplification effects of local geology, this study provides the lowest hazard estimates for at least seven out of the nine cities. This is partially because variability on ground-motion prediction was not accounted for.
The 475-year return period is the common return period among the papers considered. It is restrictive to compare the results of hazard studies at a unique return period. Comparison should also include longer return periods (as well as for other spectral periods), and the conclusions might be different.
None of the 2020 studies [Drouet et al. 2020, Beauval et al. 2020, ESHM20] exhaustively include epistemic uncertainty on the source model. It is difficult to achieve exhaustivity; however, for a given return period, the distribution of acceleration values should represent all uncertainties encountered while building the source model: alternate earthquake catalogs, alternate seismogenic source models (including faults where possible), uncertainties on earthquake locations and magnitudes, uncertainties on the declustering step and on the completeness periods, uncertainties on Mmax bounding the recurrence models and on the shape of the earthquake recurrence model close to Mmax [see, e.g., Marinière et al. 2021]. Ideally, the final acceleration distribution should be larger in low seismicity regions compared with seismicity regions that are more active, as forecast capability is much lower.
4. Seismic hazard evaluation in regulatory studies
4.1. Nationwide studies and official zonings: from historical intensities to PSHA
The technique employed to establish a seismic hazard map for a national zonation map has evolved from gross identification of earthquake prone areas to quantification of the ground shaking hazard (Section 2.2, Figures 6 and 7). The aim is to delineate areas where application of seismic rules is either recommended or mandatory. The tools have largely evolved with the increase of available data, as is detailed below for the three generations of the zonation map listed in Table 1.
First official seismic zonation map for mainland France, PS69 [Rothé 1967]. Map courtesy of BRGM.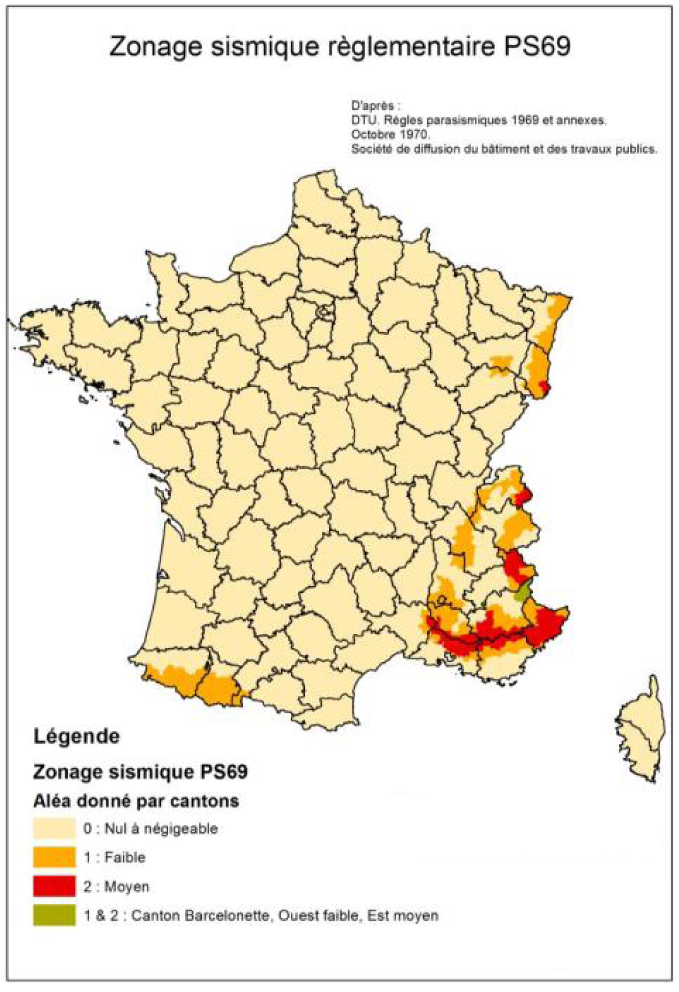
Second and third generations of official seismic zonation maps for mainland France. Left: PS92 [Despeyroux and Godefroy 1986]; right: EC8-2010 [Bard and Lebrun 2004]. Reference PGA on rock in m/s2.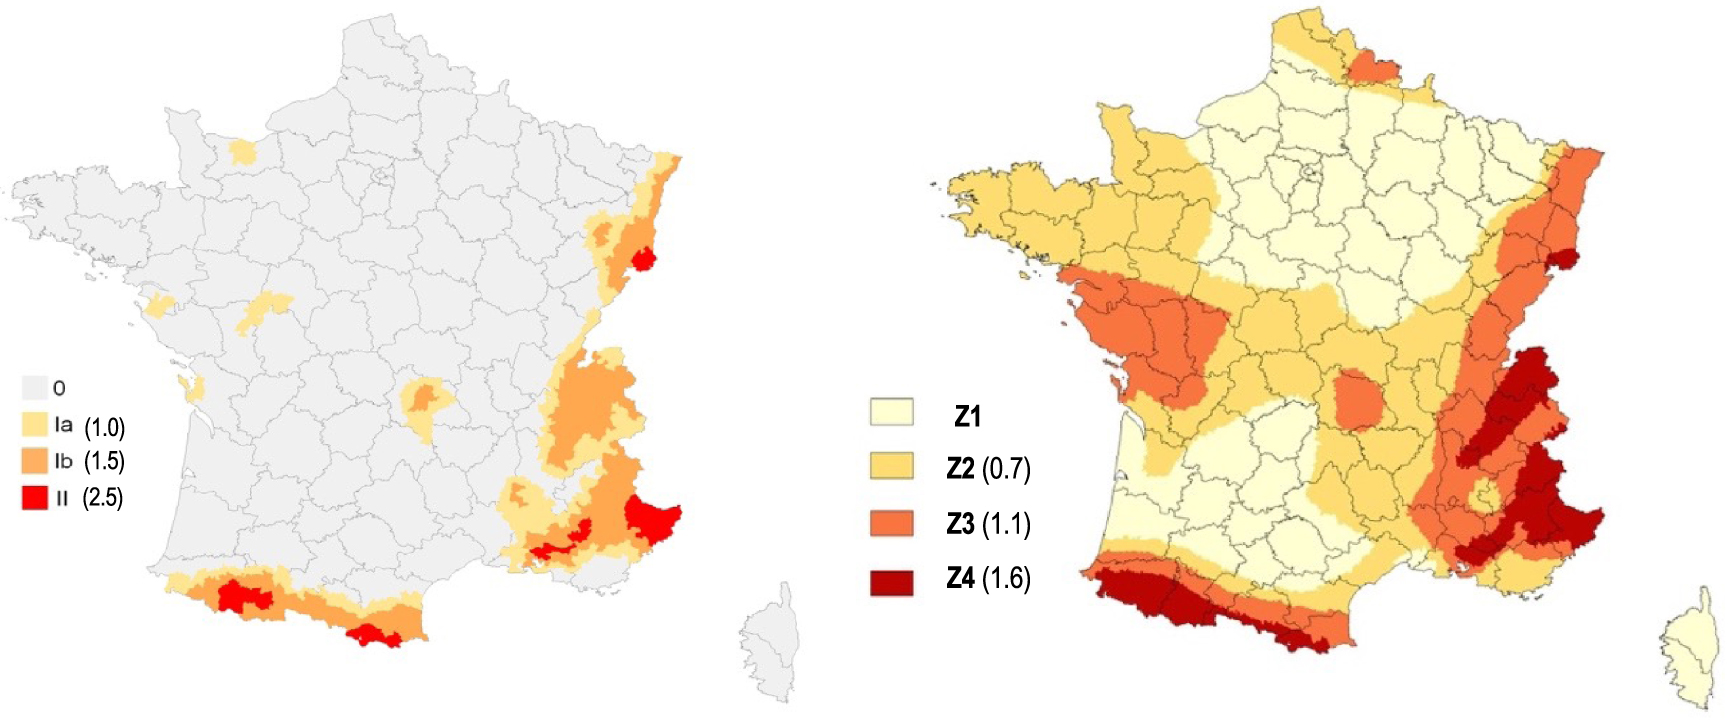
4.1.1. Zonation for the PS69 French Standard (DTU P06-003, 1972)
The first official zoning map of France was established based on a map of probable maximum intensity. J. P. Rothé, Director of the Bureau Central Sismologique Français (BCSF) in Strasbourg, analyzed the distribution of epicentral intensities from 1861 to 1960, combined with the historical catalog published by Perrey [1844] and the BCSF archives, to produce a map of maximum observed intensity in France from 1021 to 1960 [Rothé 1967]. This map, characterized by a leopard skin aspect, was interpreted into a smoothed map of probable maximum intensity with three levels (VI, VII, VIII–X) using additional seismotectonic knowledge. A committee was then formed to delineate the zonation used for the application of PS69 DTU (displayed in Figure 6). The exact procedure used to establish zonation from the maximum probable intensity map has not been fully documented. This official zonation subdivides France into three zones that fit the administrative district (canton) contours: negligible (0), weak (1), and moderate seismicity (2). This zonation emphasizes seismicity in the eastern part of France, from Alsace to Provence and Côte d’Azur (zones 1 and 2). The moderate seismicity zones (2) correspond to locations of destructive historical events (e.g., Basel 1356 in southern Alsace, Chamonix in 1905, Lambesc in 1909, Manosque in 1708, hinterland of Nice in 1564 and 1617, and the Ligure event in 1887). The remaining regions, except for central-western Pyrenees (i.e., the Arette-Bagnères area), were considered to be in zone 0 with negligible seismicity despite noticeable seismicity in the area from Massif Central to the Atlantic Ocean. The reasoning behind this is not well-documented, but Rothé [1967] briefly mentions the long recurrence times of significant events and the very old age of the orogenic episodes in this area.
4.1.2. Zonation for the PS92 French Standard [PS92 1995]
The next zonation update was performed by BRGM [Despeyroux and Godefroy 1986; Figure 7 left] and benefitted from drastic improvements in historical seismicity knowledge provided by the nuclear program. This update followed a well-documented methodology to establish a four-zone zonation map (0, negligible; Ia and Ib, weak seismicity; II, moderate seismicity). The approach followed was partly statistical. A catalog of macroseismic epicenters (I0) was built from the SIRENE historical database and complemented with epicenters ⩽100 km from the borders. Considering a relatively coarse (20 km × 20 km) grid covering France, observed intensities in each cell were predicted using an intensity prediction equation. More precisely, four relationships were applied, depending on the location of the earthquake (northwest, northeast, southwest, and southeast France), to account for regional differences in intensity attenuation. Different tests were performed to understand how the uncertainties on inputs may impact zoning. Cells where the maximum “observed” intensity results were lower than VIII were assigned to zone 0. The other cells were classified in zones I or II, depending on the maximum observed intensity and the mean return period for intensity levels VII and VIII (see Table 2). Distinctions between zones Ia and Ib are obtained by adding seismotectonic information. Smoothing is then performed according to seismotectonic information, and transition zones are added when needed (no abrupt jump from, e.g., zone 0–zone II). Based on this physical zoning, administrative zoning was derived with every district associated with one of the four zones. The last step consisted of assigning design spectra to each zone for the newly written building code. The Murphy and O’brien [1977] intensity–peak acceleration relationship was used, with reference intensities of VII−, VII+, and VIII for zones Ia, Ib, and II, respectively. This leads to the values given in Table 2.
Criteria for the 1986 zonation, classification of each spatial cell (cell size: 20 × 20 km2)
| Zone | Criteria | Reference design level | ||||||
|---|---|---|---|---|---|---|---|---|
| Maximum observed intensity | T | T | Seismotectonic domain (smoothing) | Intensity | Peak rock acceleration (aN) | |||
| 0 | <VIII | — | — | — | ||||
| Ia | VIII | AND | >75 years | AND | >200–250 years | Imax⩽ VIII, weak plio-quaternary deformation | VII− | 0.10 g |
| Ib | ⩾VIII and <IX | VII+ | 0.15 g | |||||
| II | ⩾IX | OR | ⩽75 years | OR | ⩽200–250 years | VIII | 0.25 g | |
Mean return period of intensity VII.
£Mean return period of intensity VIII.
4.1.3. Zonation for the European standard [NF EN 1998-1 2005]
This zonation update marked an important methodological step. For the first time, the probabilistic approach was directly applied to estimate exceedance probabilities for various ground-motion levels. The new zonation map resulted from a two-step procedure. First, a seismic hazard study was performed in 2001 to 2002 by Geoter (now FUGRO) within a constrained framework (e.g., short deadlines, imposed ground-motion models). There are many publicly available reports documenting this hazard study [e.g. Martin et al. 2002]. Second, this seismic hazard map was translated into a zonation map with four discrete zones on the mainland territory (Figure 7 right) to help account for biases induced by constrained framework (e.g., strict terms and conditions, choices imposed by the scientific committee) and short deadlines. Although there is no official administrative report documenting the second step, the methodology is outlined in the 2004 Groupe d’Etudes et de Propositions pour la Prévention du Risque Sismique final report [Bard and Lebrun 2004], which was later summarized in Bard [2011] for teaching purposes.
The seismic hazard study used two alternate seismogenic source models: the original EPAS model with 52 area sources [Autran et al. 1998; see Section 3.3] and an aggregated version with 25 sources. A smoothed seismicity model was also derived from the earthquake catalog, with 20% weight in the final logic tree. The earthquake catalog merged a historical part based on the SisFrance macroseismic database with the instrumental LDG catalog. In the historical period, the magnitudes ML were estimated from epicentral intensities using the equation from Levret et al. [1996]. The solutions for 140 earthquakes from Levret et al. [1996] were included. This national catalog was completed with relevant cross-border events from neighboring countries. Ground motion was directly and quantitatively estimated using two ground-motion prediction equations [Ambraseys et al. 1996, and Berge-Thierry et al. 2003; see Section 3.6]. Both equations were defined in terms of surface magnitude (MS). One major decision was to consider the magnitude of the earthquake catalog (ML) as a surrogate for MS, which was a conservative assumption. A logic tree was established to account for epistemic uncertainties (alternative seismogenic source models; alternative ground-motion models). Monte Carlo sampling was applied to account for uncertainties on earthquake recurrence parameters, including Mmax, as well as on depths.
Translation into an official discrete zonation map was then performed according to the following criteria (also summarized in Table 3):
- Goal was to have a limited number of zones in mainland France (no more than 4).
- Zone limits were to be directly related to the seismic hazard map and based on pga thresholds ai that exhibit a geometric sequence (ai+1 = r ⋅ ai).
- Threshold for zone 2 should include all historical events with epicentral intensities of VII and above.
- Threshold for zone 3 should include all historical events with epicentral intensities above VIII.
The resulting “optimal” pga475 thresholds were found to be 0.7, 1.05, and 1.6 m/s2, but the resulting map was slightly manually modified to account for some peculiarities, as documented in Bard and Lebrun [2004]. For instance, in western France, zone 2 was extended southward to include the Bordeaux area because of the 1759 event with intensities larger than VII, and zone 3 was slightly extended westward to include the Oléron island because of the 1972 event. In southeastern France, zone 4 was extended along the middle Durance area, including the Lambesc area, and around Nice for consistency with previous 1986 zonation, in which they were included in the highest (mainland) seismicity zone. Regarding hazard values to be applied in each zone, the committee considered that the seismic hazard study was based on conservative assumptions due to very short time constraints of the seismic hazard study; therefore, the lower bound (rather than the upper bound) of the pga interval was retained as the reference design values to be used with the EC8 building code.
Criteria for the 2004 zonation
| Zone | Maximum historical intensity | PGA_475 (m/s2) | Additional | Reference design value ag£ |
|---|---|---|---|---|
| Z1 | <VII | <0.07 | Manual modifications to adjust to some historical events | — |
| Z2 | ⩾VII | ∈[0.07,1.05[ | 0.7 m/s2 | |
| Z3 | ⩾VIII | ∈[1.05,1.6[ | 1.1 m/s2 | |
| Z4 | ⩾VIII | ⩾1.6 | 1.6 m/s2 |
PGA_475 = peak ground acceleration on rock site from the Martin et al. [2002] hazard study for a return period of 475 years.
£Reference peak ground acceleration to be considered for the design of common buildings on rock sites [anchoring or 0-period acceleration of response spectra; Bard and Lebrun 2004, Arrêté du 22 octobre 2010].
4.1.4. Evolution of official maps
The three generations of official maps are displayed in Figures 6 and 7. The meaning of the different zones changes from one generation to another, but it is clear that the extent of the areas concerned with at least partial application of seismic construction rules increases from one map to the other. Although the higher seismicity zones remain generally the same on the eastern and southern borders, including Provence, the weak and moderate seismicity zones expand westward. The latest map (EC8, proposed in 2004 and officialized in 2010, see Table 1), however, may be strongly biased for western France by assuming equivalence between surface magnitude MS and local LDG magnitude ML. It is now well known and documented that LDG local magnitudes are overestimated in this part of France [see, e.g., Laurendeau et al. 2019, Sira et al. 2016]. Associated hazard values can be compared only when regulatory seismic loading is explicitly related to seismic shaking (i.e., only for the 1985-PS92 and 2004-EC8 maps); however, even in that case, comparisons are not straightforward because the associated spectral shapes vary significantly with code generation and site class.
The comparison of hazard levels indicated in Figures 4, 5, 7 right (present zonation map), and Tables 2 and 3, suggests several issues that should be discussed and encourage moving as quickly as possible to an update of the present zonation:
- Comparing hazard estimates by Martin et al. [2002] with the three recent studies [i.e., Drouet et al. 2020, Beauval et al. 2020, Danciu et al. 2021], we observe that the hazard levels delivered by Martin et al. [2002] are within the hazard estimated by the 2020 studies only in the case of Lourdes and Briançon (zone Z4; 1.6 m/s2). All other cities are either slightly or significantly above the recent PSHA studies; zone Z3 (1.1 m/s2) in Strasbourg, Clermont-Ferrand, Nantes, and Le Teil; zone Z2 (0.7 m/s2) in Rambervillers. For these cities, a clear decreasing trend can be observed when comparing results from 2002 with the three recent studies. One explanation for this decreasing trend might be improvements in strong-motion databases and the resulting ground-motion models, with increasing data from weak to moderate events, predicting lower ground motions for moderate events that control hazard at the 475-year return period. Another explanation might be related to the improved consistency of the magnitude in ground-motion databases and earthquake catalogs: Martin et al. [2002] had to assume equivalency between magnitudes ML and MS.
- Estimation of uncertainties, especially in weak and moderate seismicity areas (zones Z3 and Z2; cities in Figure 5). Considering all studies, we observe that overlap between fractile ranges is low, which emphasizes the difficulties of a reliable estimation of the uncertainty range for areas with infrequent events. A great deal of work has been performed over the last decades on the analysis of ground motion uncertainty (epistemic and aleatory). Similar efforts should be undertaken to better grasp the uncertainties on various components of the seismic source model, especially in areas with few earthquake data (see Sections 3.2–3.5).
4.2. Site-specific regulatory hazard studies for design purpose
Increasing site-specific hazard studies are being performed in France because safety analysis is now mandatory for nuclear facilities, Seveso-type facilities (since May 1993, with a major update in February 2018), and dams (since August 2018). Although the historic approach for French nuclear facilities is deterministic (without consideration of the uncertainty on the ground-motion model), there was a move toward PSHA for complementary safety analysis of core installations after the Fukushima Dai-Chi accident (2011 Tohoku earthquake). For dams, where the practice was for a long time inspired by the nuclear practice, the deterministic approach was largely dominant until recommendations were issued in 2014 [Loudière et al. 2014] that opened the door to PSHA, depending on the dam operator’s choice. For Seveso-type Installation Classée pour l’Environnements (ICPE), a decree in February 2018 allowed facility operators to perform site-specific hazard studies. Mention in this decree of a return period (up to 3000 years for existing and 5000 years for new facilities) de facto implies a probabilistic approach, as detailed in AFPS CT44 [AFPS 2020]. The French practice of site-specific hazard studies is thus slowly evolving from purely deterministic to a mixture of probabilistic and deterministic. Most of the work done in these site-specific studies is summarized in reports that are not publicly available; therefore, it is not possible to analyze the results and perform an informative comparison of deterministic and probabilistic approaches in mainland France.
For dams and chemical plants, the default hazard level in the absence of any site-specific study is provided via extrapolation of the present official seismic zonation map (EC8; Figure 7 right) to longer return periods. Such extrapolations are done under the assumption of a power law dependence for the hazard curve relating annual exceedance rate 𝜆 (or the inverse, the return period RP) to design level DL:
5. Concluding remarks
To shape the future of seismic hazard assessment in France, it is important to acknowledge and recognize past achievements. The aim of this article is to provide an overview of the different seismic zonings that were enforced in the French regulation over the years and to provide a summary on the probabilistic seismic hazard studies achieved in France since the mid-1990s.
Since 1967, when the first official seismic zoning in France (deterministic) was developed, different French institutions have addressed the assessment of seismic hazard for the mainland territory. In the 1960s, BCSF produced an intensity map used to establish official zoning. In the mid-1980s, the second official zoning relied on intensity occurrence statistics provided by BRGM [Despeyroux and Godefroy 1986]. At the same time, the first probabilistic hazard calculations were developed at CEA [e.g., Goula 1980]. In the 1990s, BRGM performed probabilistic seismic hazard calculations for France based on the seismogenic source model produced by the EPAS working group. Current official French zoning relies on hazard computations from Geoter [Martin et al. 2002]. Over time, PSHA studies have been performed at IRSN, CEA, and EDF for regulatory purposes and research. The academic world had little involvement in PSHA, but this is changing. Thanks to the various actions in RESIF, estimation of probabilistic seismic hazard in France will integrate the vision of the academic community in the future.
PSHA estimates have varied among studies along the years. Datasets constantly grow, input models improve, and present levels are more accurate than previous decades; however, the uncertainties are still large, as the estimation of earthquake occurrence probabilities and associated ground motions remain particularly challenging in a low-to-moderate country like France. The best way to move forward is to be transparent on the uncertainties and to include in the process the researchers working on the fields that feed the input models (e.g., geologists, paleoseismologists, geodesists, statistical seismologists, etc. …).
There is no academic or public institution officially in charge of leading PSHA in France (such as INGV in Italy or ETH in Switzerland), so there is presently no authoritative institution in charge of delivering seismic hazard estimates, nor authoritative datasets (e.g., earthquake catalogs, seismogenic source models, fault models) ready for SHA. In the future, the RESIF consortium might endorse this responsibility. Furthermore, new datasets should be incorporated in the inputs necessary for hazard assessment, such as the strain rates estimated from GPS measurements, with ongoing research to understand how they can be used to constrain earthquake recurrence models.
Attempts to perform testing on PSHA forecasts are increasing, and the next seismic hazard model should also be delivered for shorter than usual return periods. Future analyses are required to understand whether those source models usually developed for PSHA are valid for forecasting hazard at very short return periods. Time-dependent components might be required so that testing on short observation time windows is meaningful. While building future seismic hazard models, their use for risk estimates should also probably be considered. This implies both to provide hazard results for a wide range of return periods and to incorporate site effects in a simplified but innovative way, including, for example, what has been done for ESRM20 [European Seismic Risk Model 2020; Crowley et al. 2021].
The periodicity of zonation updates in France is slow (about every two decades), which is significantly slower than in most neighboring European countries and is not in line with the rapid knowledge advances in many Earth science fields. As the Martin et al. [2002] PSHA study is already two decades old, it is time for the next update. Considering the mean delay between achievement of hazard studies and their official endorsement (at least five years, see Table 1), technical studies should start as soon as possible. Preparation with a larger involvement of the academic community will hopefully allow improved acceptability and reduce delays.
Conflicts of interest
Authors have no conflict of interest to declare.
Acknowledgments
The constitution of Figures 4 and 5 was made possible by a number of authors who kindly sent us numeric files in order to include the exact, original PGA values and ranges (Pascal Dominique, Agathe Roullé, Ramon Secanell, Stéphane Drouet). We thank them warmly. We are also grateful to Christophe Martin, two anonymous reviewers, and the editor Frédéric Masson for thorough and detailed reviews.
1The study by Martin et al. [2002], which is the basis of the official seismic zonation map of the French territory, is also based on a PSHA study that includes a logic tree.