

1 Introduction
Forecasting and reducing the impacts of global climate change is a considerable challenge (Qin, 2007). Climate change may result in variation in glacier accumulation and melting volumes, and variation in the snow line and the heaving motion of glaciers may result in a decrease in glacier area and shape. Indeed, the terminal ends of many glaciers have extended or narrowed. In recent decades, Chinese glaciers have been shrinking rapidly (Ding et al., 2006; Li and Cheng, 2008; Yao et al., 2004; Xiao et al., 2007). Glacier melting or accumulation is related to several climatic factors such as the regional background climate, air temperature, and precipitation. For typical Asian inland glaciers, studies have indicated that a 1 °C increase in air temperature can cause glacier equilibrium lines to rise by 52∼152 m altitude, whereas a 100 mm increase in annual precipitation can lower them by 9∼85 m (Zhang et al., 1998). However, in the West of China, changes in air temperature appear to have a more significant impact than changes in precipitation (Li et al., 2003; Liu et al., 1999). Shi and Liu (2000) comprehensively studied the response of Chinese glaciers to global warming in the 21st century and predicted that the rate of reduction in glacier area and volume will be between 30% and 70%. Xie et al. (2006) predicted that for temperature increases of 0.01 K a−1, 0.03 K a−1, and 0.05 K a−1 until the end of the 21st century, the area of Chinese glaciers will be reduced by 14%, 40%, and 60%, respectively.
Xinjiang province has one of the largest concentrations of continental glaciers in China. There are 18,499 glaciers with a total area of 25,342 km2 and the ice reserve is 2696 km3, which account for approximately 48.23% of the total glacier reserves in China. The Tianshan mountain range contains 9081 glaciers, which account for 19.61% of the total number in China (Li et al., 2010). Glaciers not only play a crucial role in the provision of water supplies, because of Xinjiang's continental arid location, but are also a very important resource for industrial and agriculture development.
Under the influence of climate change and increased human activity, Xinjiang's water resources, based on glacier snowmelt, are considered to be insecure. Seasonal variation in runoff from glacier snowmelt has increased due to increases in temperature in the region. This has led to a variable supply of water and has reduced the stability and reproducibility of water circulation systems in the arid region of Xinjiang. As the frequency and strength of extreme climate/hydrology events have increased so has the uncertainty of water supplies. Although forecasts of the extent of climate change still contain a large degree of uncertainty, significant influences on the ecology and environment are considered likely in many countries. China is faced with complex economic and social problems regarding sustainable development in the country, as well as significant scientific and technology challenges. In the present study, we analyzed the features of climate change in the previous 50 years based on historical and current measurement data, and then used climate models to predict variation in climate and the influence of snowmelt for the next 50 years in Xinjiang. Our results provide information for water resource planning and the administrative departments involved in this task.
2 Overview of the study area
Xinjiang is located in the center of the continents of the Eurasian land mass, on the northwestern border of China, situated between 73°40′–96°23′E and 34°25′–49°10′N. It has a length of 2200 km from east to west and extends 1650 km at its widest from north to south (Hu, 2004). It is an arid region with a typical desert ecology. The geography of Xinjiang is dominated by two basins, which are located between three mountain ranges. The Altai Mountains are located in northern Xinjiang. The Kunlun Mountains are located in southern Xinjiang and include the two branches of the Kaci Kunlun and Altun Mountains. The Tianshan Mountains are symbolic of Xinjiang and cross the central region from the Tarim Basin in the south to the Dzungaria Basin in the north. Xinjiang is effectively divided into two parts by the Tianshan Mountains, with the south region termed the southern area and the north region termed the northern area. The large glaciers distributed in the Ttianshan Mountains are a unique characteristic of Xinjiang. Ice reserves occupy 2.58 hundred million m3, which represents a solid water reservoir for the Xinjiang region (Bolch, 2007; Liu, 1995).
3 Data and methods
3.1 Historical observation data
We selected 49 meteorological stations in Xinjiang (Fig. 1), including 18 stations in the North, 22 stations in the South, and 9 stations in the Tianshan Mountains. Monthly and annual average temperature and rainfall data were collected for the period 1961 to 2010, including some data from the national weather information center (http://www.nmic.gov.cn/). The study region was divided into three areas (northern area, southern area, and the Tianshan Mountains) in accordance with the geography and climatic characteristics of Xinjiang.
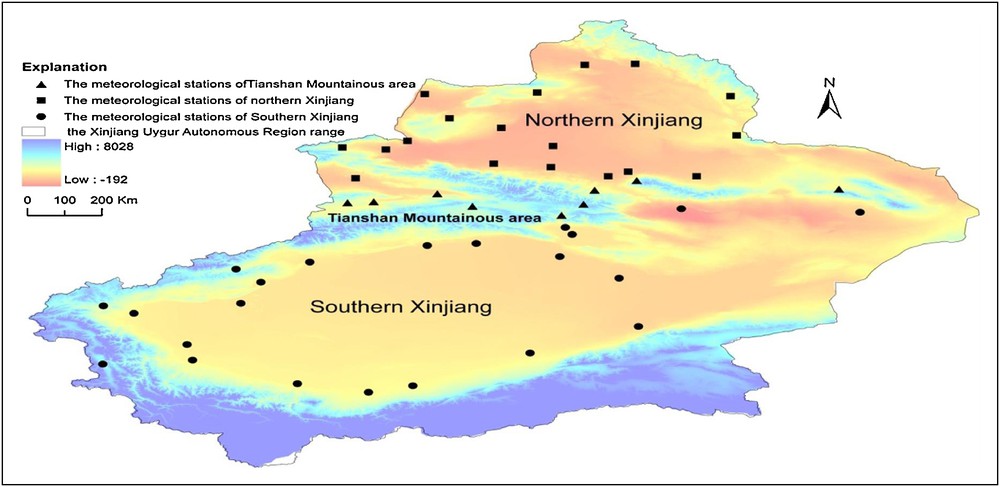
Meteorological stations. Distribution plan in the study area.
3.2 Predicted data for climate scenarios
Three climate scenarios were taken from the “Special Report on Emissions Scenarios” issued by the Intergovernmental Panel on Climatic Change (IPCC):
- • the A1B scenario: economic development is occurring rapidly, the global population will reach a peak in the middle period of the 21st century, high emissions of greenhouse gases will be experienced, all resources are maintained in balance;
- • the A2 scenario: the global population will continue to increase, significant but localized per capita economic growth will occur alongside technological changes, globalization is not obvious;
- • the B1 scenario: the global population will peak in the middle period of the 21st century, the economic structure does not transform information transfer, a low emission scenario but with economic, societal and environmental sustainability problems on the global scale.
For predictions, we used data from the World Climate Research Programme (WCRP) coupled model (phase 3) and multi-mode precipitation and average temperature values. We referred to period grid point data (Table 1) for Xinjiang data (105 stations).
Meteorological observation data source.
| Data name | Air temperature data stations number | Precipitation data stations number |
| Xinjiang meteorological data | 49 | 98 |
| Air temperature and precipitation data in Central Asia area | 74 | 102 |
| Global historical data | 14 | 14 |
| China meteorological share data | 8 | 8 |
| Total | 201 | 222 |
Data on Qinhai province (6 stations) and Gansu province (2 stations) were provided by the China meteorological data sharing network, and temperature (74 stations) and precipitation data (102 stations) for 1879–2003 for central Asia were provided by Williams (2008). Data for Pakistan, Afghanistan, and Mongolia were provided by the Global Historical Climate Network and the Climate Research Unit.
Data were acquired from January 1901 to December 2099 at 71°E–97°E, 35N–52°N with a horizontal resolution of 0.5° × 0.5°. Data were corrected using the Delta method, comparing actual and simulated values of precipitation and air temperature for 1961–2000 to establish precipitation and air temperature predictions for the three climate change scenarios for the period 2011–2050. The correction method was evaluated using the United States National Assessment Center recommend creating methods for future climatic scenarios that can be considered to be output changes of regional climate models.
3.3 Delta method
The Delta method is a simple method for downscaling average monthly temperature (Dey and Kumar, 1983). First, observation periods were counted (1961–1990) and the absolute change in average monthly temperature in the GSM reference period was recorded (20C3M scenario). The absolute change in average monthly temperature and average temperature for many years in the three scenarios (SRES A1B, SRES A2, and RES B1) is the downscaling result of average monthly air temperature. For monthly precipitation downscaling, the rate of variation in precipitation was documented for many years in the GSM reference period. For details, see formulae (1) and (2).
| (1) |
| (2) |
In formulae (1) and (2), t is time (months), i is the average month (scope 1–12), obs is observation data, 20C3M is the 20th century scenario, SRES indicates the three scenarios, and mon is the result after monthly average downscaling.
In simulations of annual average temperature, the Delta method similarity coefficient may be greater than 0.98. When the similarity coefficient is around 0.7 for precipitation in mountainous areas, the mean-square deviation coefficient is less than 5 °C. It may catch the monthly downscaling change law of precipitation but cannot catch extreme values of precipitation. After applying the reference period Delta downscaling method, the 30-year average temperature was equal to the observed data for the 30-year average air temperature. The 30-year annual average rainfall was also equal to the observed data.
4 Results and analysis
4.1 Analysis of the features of climate change in Xinjiang
4.1.1 Changes in air temperature in Xinjiang in the last 50 years
Previous studies have indicated that if the time scale is longer or the spatial range is larger, the influence of air temperature on the glacier is more significant. Precipitation only has an obvious effect on glaciers on short time scales (less than 10 years) and small spatial scales (Gao and Tang, 2000). The analysis of changes in air temperature in Xinjiang in the last 50 years revealed that the Tianshan Mountains and the southern and northern areas all experienced significantly increasing temperatures over time (Fig. 2).
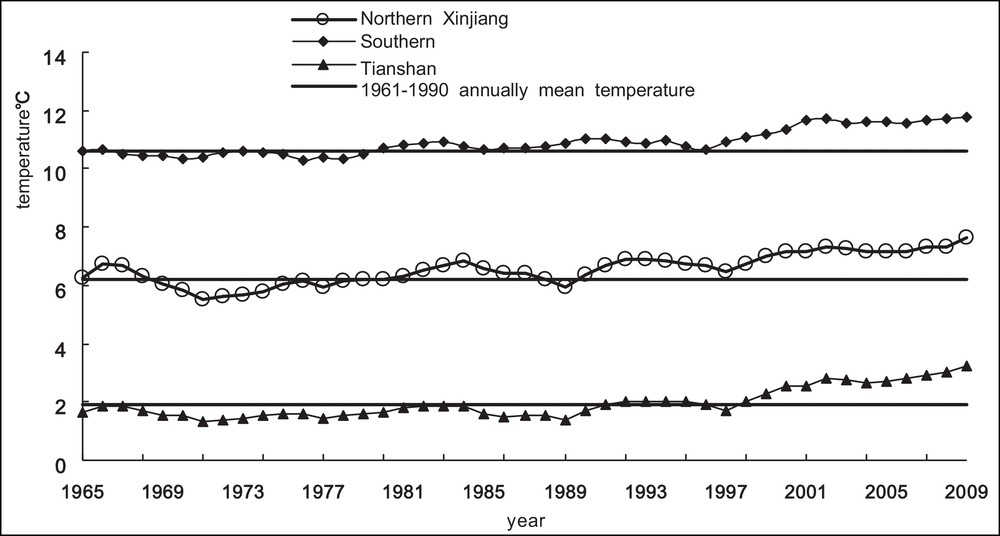
Temperature average variation trend within 5 years during the past 50 years in Xinjiang.
The rate of increase in the three areas was 0.34 °C 10 year−1, 0.3 °C 10 year−1, and 0.32 °C 10 year−1, respectively, and all were significant with a confidence coefficient of α = 0.05; i.e., in the Tianshan Mountains and the southern and northern areas, temperatures rose by 1.7 °C, 1.5 °C, and 1.6 °C, respectively, in the last 50 years. This rate of temperature increase is higher than that for China as a whole over the same period, 0.22 °C 10 year−1 (Liu, 2009). By comparing the average temperature series in the three areas to annual average temperature values for 1961–1990, it can be seen that warming occurred after 1998. In the southern area, it was cooler in the years 1960–1961, 1964, 1966–1978, and 1988–1990; after 1990, the weather became warmer. The rising trend in temperatures was particularly apparent in winter and autumn with the rate of increase in annual average minimum temperature being significantly higher than that of the maximum temperature. The frost-free period has extended and the accumulated temperature has increased.
4.1.2 Variation in precipitation in the past 50 years in Xinjiang
It was clear from the data that levels of precipitation are rising in the region. Analyses of precipitation data for 1960–2010 in the three areas, also considering the average rainfall volume within the past 5 years (Fig. 3), revealed sequences of variation according to the formulae y = 1.53x + 371.92 (Tianshan Mountains), y = 0.3702x + 41.244 (southern area), and y = 1.3846x + 168.61 (northern area). The rate of increase in precipitation in the three areas was 15.3 mm 10 year−1, 3.0 mm 10 year−1, and 13.8 mm 10 year−1 respectively. The average precipitation in the past 20 years has increased by 39.9 mm (Tianshan Mountains), 15.9 mm (southern area), and 37.22 mm (northern area) compared to the previous 30 years (Menne and Williams, 2009).
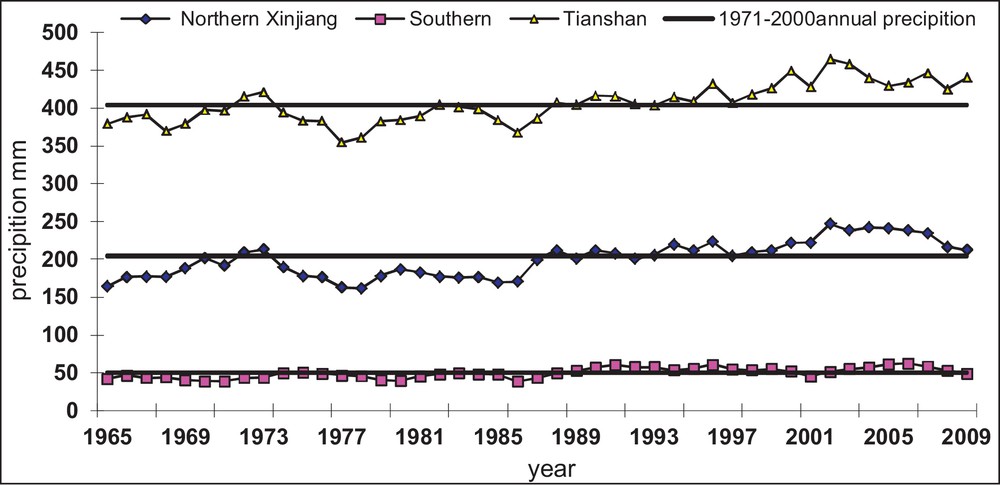
Rainfall volume variation trend during the past 50 years in Xinjiang.
For average rainfall capacity, using the period 1970 to 2000 as a normal standard for comparison, it could be observed that rainfall was above normal during the years 1971–1974, 1989–1992, and after 1998 in the Tianshan Mountains. In the southern area, rainfall was above normal during the years 1971–1975, 1980–1983, and after 1987; and in the northern area, rainfall was above normal during the years 1960–1961, 1969–1972, 1987–1995, and after 1998.
4.1.3 Probable trends in climate variation for the next 50 years in Xinjiang
As explained above, we used the Delta method to establish a precipitation and temperature series for three climate change scenarios for the period 2011–2050 in Xjinjiang. The results are presented in Table 2 and Fig. 4. The average temperature is predicted to continue to increase in Xinjiang under all three scenarios. On the annual scale, average temperatures significantly increased under all three scenarios in all three regions, which is similar to the trend in Chinese national air temperatures. The maximum temperature increase (produced in scenario A1B) is predicted to occur in the Tianshan Mountains, and the minimum (produced in scenario B1) is predicted to occur in the southern area. It should be noted that these forecasts had large uncertainty.
GCMs list. Climate change scenarios for the period 2011–2050 in Xjinjiang.
| Model name | Country | A1B scenario | A2 scenario | B1 scenario |
| bccr_bcm2_0 | Norway | √ | √ | √ |
| cccma_cgcm3_1 | Canada | √ | √ | √ |
| cccma_cgcm3_1_t63 | Canada | √ | ○ | √ |
| cnrm_cm3 | France | √ | √ | √ |
| csiro_mk3_0 | Australia | √ | √ | √ |
| csiro_mk3_5 | Australia | √ | √ | √ |
| gfdl_cm2_0 | USA | √ | √ | √ |
| gfdl_cm2_1 | USA | √ | √ | √ |
| giss_aom | USA | √ | ○ | √ |
| giss_model_e_h | USA | √ | ○ | ○ |
| giss_model_e_r | USA | √ | √ | √ |
| iap_fgoals1_0_g | China | √ | ○ | √ |
| ingv_echam4 | Italy | √ | √ | ○ |
| inmcm3_0 | Russia | √ | √ | √ |
| ipsl_cm4 | France | √ | √ | √ |
| miroc3_2_hires | Japan | √ | ○ | √ |
| miroc3_2_medres | Japan | √ | √ | √ |
| miub_echo_g | Germany | √ | √ | √ |
| mpi_echam5 | Germany | √ | √ | √ |
| mri_cgcm2_3_2a | Japan | √ | √ | √ |
| ncar_ccsm3_0 | USA | √ | √ | √ |
| ncar_pcm1 | USA | √ | √ | √ |
| ukmo_hadcm3 | UK | √ | √ | √ |
| ukmo_hadgem1 | UK | √ | √ | ○ |
| Total | 24 | 19 | 21 |
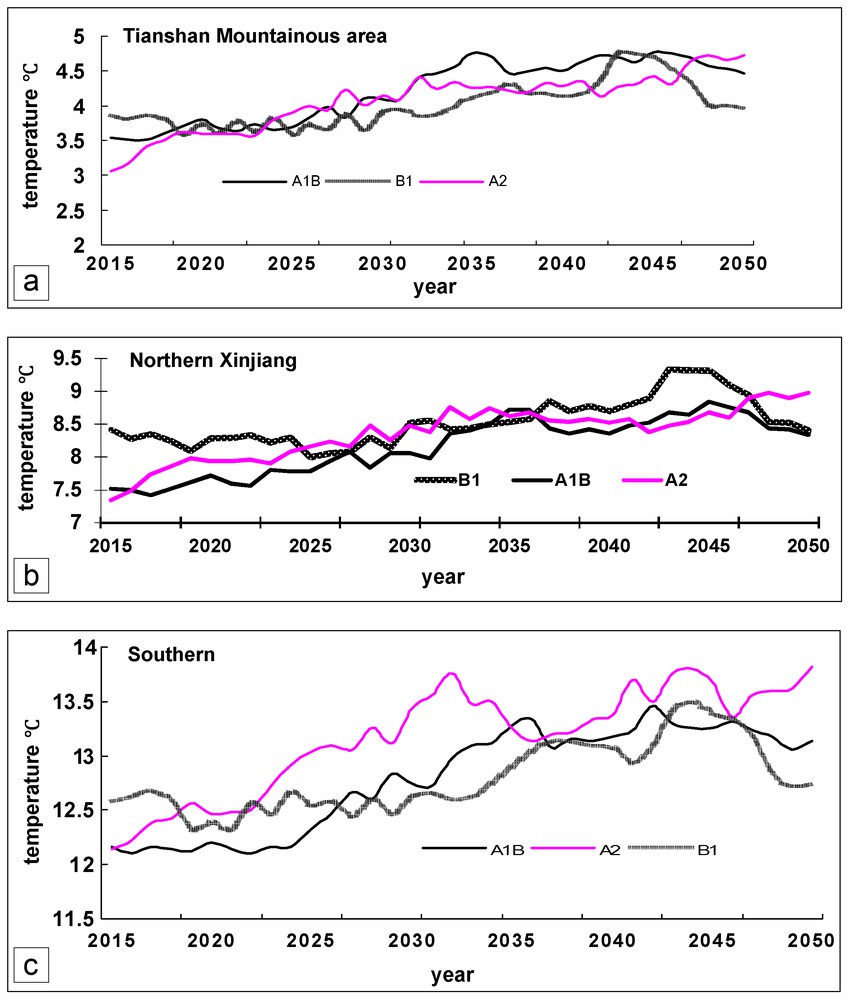
Moving average of temperature within 5 years from 2011 to 2050 years in Xinjiang.
As shown in Table 3 and Fig. 5, under the three scenarios, the range of changes in precipitation is largest for the A1B scenario and smallest for the B1 scenario. Average precipitation in the Tianshan Mountains decreased under all three scenarios, whereas an increase was predicted for the northern and southern areas. Although precipitation is predicted to increase along with increase in air temperature in Xinjiang, the uncertainty of precipitation predictions was not the same under each scenario.
Xinjiang annual variation of temperature in the future.
| Climate scenarios | Period | Tianshan mountainous area | Northern Xinjiang | Southern Xinjiang |
| Temperature (° C) | Basic standard (1961–2000) | 1.6 | 6.2 | 10.6 |
| A1B | 2011–2050 | +2.59 | +2.0 | +1.9 |
| A2 | 2011–2050 | +2.43 | +2.1 | +2.0 |
| B1 | 2011–2050 | +2.38 | +2.3 | +1.86 |
| Precipitation (mm) | Basic standard (1961–2000) | 404 | 200 | 49.5 |
| A1B | 2011–2050 | −29 | +17.34 | +10.98 |
| A2 | 2011–2050 | −4.0 | +9.46 | +24.7 |
| B1 | 2011–2050 | −16 | +1.8 | +13.6 |
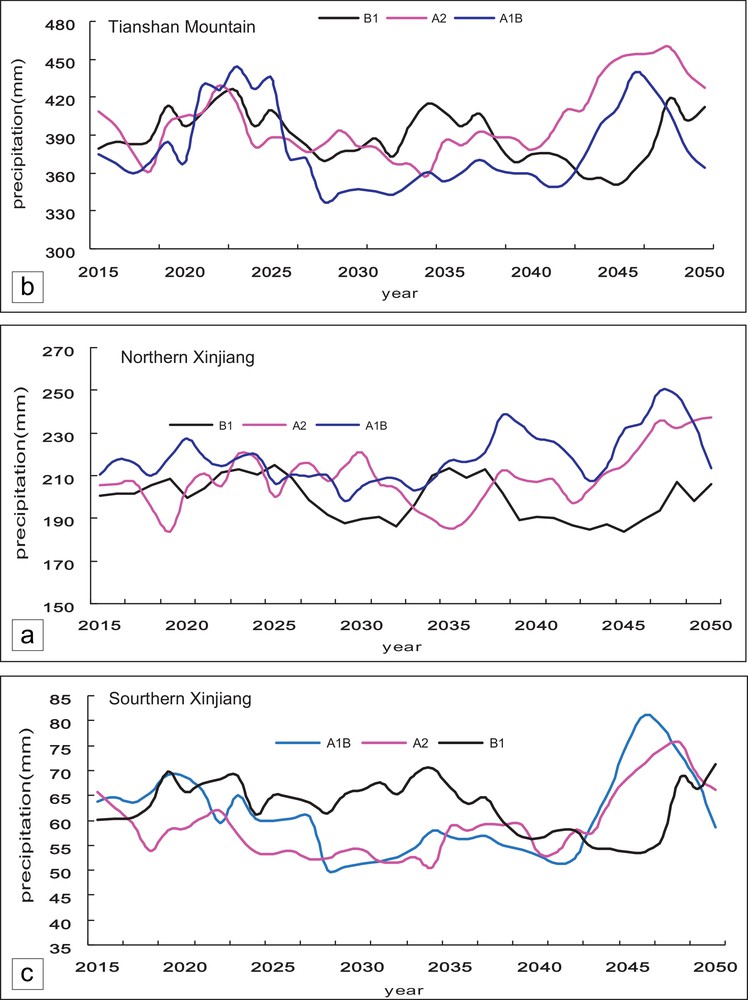
Moving average of precipitation within 5 years from 2011 to 2050 years in Xinjiang.
4.2 Effect of climate change trends on glaciers in Xinjiang
4.2.1 Influence of climate change on glaciers in the past 50 years
In the past 50 years, the average air temperature has increased by 0.2 °C every 10 years in inland China, with the 1990s being the warmest decade of the past millennium. Of the 5000 glaciers in western China, about 82% are shrinking and the total area covered by glaciers has decreased by 4.5% (Liu et al., 2006).
In the period 1960–2000, the mass balance of the Inland River Valley glacier was negative (e.g., the annual mass balance was approximately −150 mm for glaciers in the Pamir and Kunlun mountains watershed and −300 mm for those on the southern slope of the Tianshan Mountains basin). Sensitivity analysis showed that for an annual average temperature change of 1 °C, glacier mass balance changed by about 300 mm, resulting in a 10% increase in river runoff in Tailan. Increases in temperature in winter and summer increased the temperature of ice and reduced the glacier reserves. Short-term increases in temperature in summer typically result in the melting of large numbers of glaciers, and sharp temperature rises may cause a glacial flood (Shen et al., 2003).
Material balance observations for the Urumchi River Source No. 1 glacier indicated that the average material balance value was −94.5 mm year−1 during the period 1959–1985, but had increased to −358.4 mm a−1 during the period 1986–2000, i.e., it was 2.8 times greater than before 1985 (Wang et al., 2011). Runoff related to glacial melting also increased substantially. The average runoff depth of the Urumchi River Source No. 1 glacier was 508.4 mm a−1 during the period 1958–1985 but 936.6 mm a−1 during the period 1986–2001; i.e., it increased by 82.4% compared to the previous period. It is clear that the rapid temperature rises since 1980 have resulted in an increase in glacier runoff volumes.
With a total area of 10,748.10 km2, the Tarim Basin is the most important water resource in Xinjiang. Annual runoff from glacier meltwater is 150 × 108 m3, which is about 40% of the basin's total annual surface runoff volume. In the past 40 years, the glacier material balance has been negative in this area. The glacier drainage annual material balance is about −150 mm in the Pamir and Kunlun mountains and −300 mm on the southern slope of Tianshan, and the Kunlun drainage river is generally stable. However, in 1982/1983, there was an anomalous trend in glacier development. After this date, aggressive glacier melting began to occur with the average value before and after 1983 differing by −250 mm. Glacier melting and flood peak values have all shown increasing trends (Liu et al., 2006).
4.2.2 Future effects of climate change on glacier snowmelt
Before the 21st century, there was a general trend of warming temperatures and declining precipitation in Xinjiang. By the year 2050, our comprehensive predictions indicate that the temperature in Xinjiang will have risen by 2.1 °C at the southern edge of the Junggar Basin on the northern slope of the Tianshan Mountains, and that summer warming is expected to be about 1.3 °C. It was previously predicted that a total area of 807 km2 of glacier and its 21.54 km3 of ice reserves would melt by 2050 (Li et al., 2010). Based on the estimations of the present study, the runoff resulting from the predicted melting of the Urumqi River glacier will peak in the early 21st century, and by the middle of the 21st century most of the glacier will have disappeared (Zhang et al., 2009). The volume of runoff in the early 21st century will increase by 5–10%, and by the middle of the 21st century, it will decrease by 8∼15%. In the Turpan–Hami inland river basin in the East Tianshan Mountains, small glaciers (less than 2 km2) will disappear by 2050. Larger glaciers will still exist after 2050, but shrinkage is predicted to generate an increase in glacial meltwater of 107 m3.
The effect of rainfall on glaciers in Xinjiang was considered up to the year 2050, assuming an increase of 20% 100 year−1, which corresponds to a rate of increase in rainfall volume of 0.02 mm year−1 (20% reduction). This would reduce the area of glaciers by 1.7∼9.4%, equivalent to a reserve volume loss of 2.1∼10.8%. In addition, the equilibrium line would drop by 16∼62 m altitude and runoff volume would increase by 7.1∼18.1%. However, assuming an increase of 30% 100 year−1 (rainfall volumes increasing by 0.03 mm year−1 up to the year 2050), the area of glaciers would increase by 2.3∼13.5%, the reserve volume would increase by 2.1∼10.8%, the equilibrium line would drop by 21∼85 m altitude, and the runoff volume would increase by 10.6∼26.3%. This indicates that the effects of changes in rainfall are different in the southern and northern areas of Xinjiang, being greater in the northern area than in the southern area.
5 Conclusions
In the past 50 years, temperatures have generally increased in the Tianshan Mountains and in the southern and northern areas, most noticeably after 1990. The rate of increase was 0.34 °C 10 year−1, 0.3 °C 10 year−1, and 0.32 °C 10 year−1, respectively (α = 0.05 for all values). In the past 20 years, the temperatures in these areas have increased by 0.9 °C, 0.7 °C, and 1 °C, respectively, compared to the past 30 years. Conditions have become warmer mainly in winter.
In the past 50 years, the rainfall in all three areas has shown an increasing trend. The rate of increase in rainfall in the Tianshan Mountains and in the southern and northern areas was 15.3 mm 10 year−1, 3.0 mm 10 year−1, and 13.8 mm 10 year−1, respectively. In the past 20 years, the volume of rainfall in the three areas increased by 39.9 mm, 37.2 mm, and 15.9 mm, respectively, compared to the previous 30 years.
Under three climate change scenarios, the average temperature for many years significantly increased compared to a standard period in all regions in the period 2011–2050. Precipitation was predicted to decrease in the Tianshan Mountains but to increase in the northern and southern areas; however, there was a degree of uncertainty in this forecast.
A glacier is a solid water reservoir, which supplements continental rivers and provides a water resource. Every year, glacier meltwater volumes account for 22.6% of the total runoff volume in Xinjiang. In the last 50 years, glacier material balances have mainly been negative in this area. The value is about −150 mm in the Pamir and Kaci Kunlun mountains and −300 mm on the southern slope of Tianshan, and the Kunlun drainage river is generally stable. Sensitivity analyses indicated that if the annual temperature were to change by 1 °C, the glacier material balances would change by around 300 mm.
At the beginning of the 21st century, it is likely that the temperature will continue to rise in Xinjiang and glacial ablation will continue to accelerate. The effects of changes in precipitation in the south and north are predicted to be different, with rainfall volumes being more important in the north.
Acknowledgments
This project was supported by the National 973 Key Project of China (2010CB951004) and the National Natural Science Foundation Project of China (41001020). We gratefully acknowledge funding for this research.