

1 Introduction
The genus Dactylis contains only a single species and at least 18 subspecies [1]. Dactylis glomerata L. (orchardgrass or cocksfoot), a long-lived and perennial grass species, has been considered as the fourth most economically significant forage grass in the world based on its high productivity and its disease resistance under varying climatic conditions [2,3]. D. glomerata can be diploid (2n = 2x = 14), tetraploid (2n = 4x = 28), or hexaploid (2n = 6x = 42), and are separated into subspecies by morphological characteristics, geographical distribution, and/or chromosome ploidy [2]. Most populations are diploid [2,4]. Continuous outcrossing by wind pollination, natural selection and adaptation processes has resulted in a wide geographic range and large morphological variability [5]. It has been widely disseminated and become naturalized in many parts of the temperate and subtropical world, including Europe, Asia, North Africa, and the Canary Islands, with remarkable local adaptation and ecotype differentiation [6]. It is suggested that a successful Central Asian diploid progenitor of Dactylis glomerata, similar to today's ssp. altaica, expanded its range to cover a broad region [4] and Chinese ssp. sinensis might evolve from European ssp. aschersoniana which originated from Central Asia, although many aspects of the Dactylis species’ original colonization remain to be elucidated [7]. In particular, orchardgrass occurs indigenously in mountain slopes or light forest shade of Xinjiang and Southwest China. Moreover, hence most of the Chinese orchardgrass varieties were domestic (such as cv. GuLin, BaoXing, and ChuanDong) and developed from wild local ecotypes [8]; these varieties have played an important role in pasture husbandry due to high yield and good adaptability to the local environment.
To better understand the genetic diversity, inter-relatedness and differentiation of wild accessions or populations of the species is a critical step towards appropriate breeding programs developing superior varieties. Previous studies have shown that considerable variation for various agromorphological characters exist among orchardgrass accessions of ecotypes, cytotypes, and subspecies, with a clear relationship between geographical areas and observed diversity [9–13]. However, the morphological characters are not only sensitive to environmental factors, but also require labor intensive evaluation over long periods of time [14,15]. Molecular markers are widely used as efficient tools to investigate genetic variability in orchardgrass germplasm collections including random amplified polymorphic DNA (RAPD) [16,17], inter-simple sequence repeat (ISSR) markers [18], sequence-related amplified polymorphism (SRAP) [19], simple sequence repeat (SSR) [20] and amplified fragment length polymorphism (AFLP) [21]. Among the various marker systems, the AFLP technique is considered as a robust and highly informative DNA fingerprinting method used to assess a large number of markers without prior sequence knowledge [22]. Until now, however, only few efforts using AFLP markers were undertaken to study genetic diversity in wild Chinese orchardgrass accessions [21]. Marker analysis of individual genotypes was considered to be more informative in detecting population genetic structure, but this method is not practical if a large number of populations are to be characterized [23]. In view of its cheapness and effectiveness, bulking strategy has been successfully employed to investigate the genetic variation between accessions or cultivars of allogamous species [20,24,25]. It been suggested that bulks of 20 plants per accession seem sufficient to represent the genetic variation within and between accessions for most forage grass species [26]. Moreover, the non-detection of rare alleles or bands using the pooling approach is compensated by the fact that a larger number of populations can be analyzed with the same amount of effort [27,28].
Many previous studies on the genetic structure and diversity in orchardgrass have been carried out, involving a variety of populations and molecular marker technologies [3,18–21,29], while the common features of the majority of these studies are exclusion of Central Asian germplasm as well as available ecogeographical data of collection sites, and that they could simply reveal genetic relationships and diversity within the tested materials, the internal diversity center of D. glomerata in China remaining unclear. It is widely acknowledged that plant genetic structure is usually resulting from geographical isolation or local adaptation (i.e. environmental factors, including temperature, precipitation and elevation, etc.) [30–34]. In addition, ecogeographically distinct populations can differ in their level of genetic diversity or in the distribution of diversity within and among regions, and this diversity could be used for the in situ conservation of natural populations from genetic erosion and stratification or utilization of larger plant germplasm collections [35].
Since Central Asia has been suggested to be the origin center of orchardgrass and since Southwest China and Xinjiang are the typically native distribution areas of orchardgrass in China, we focused on 41 wild D. glomerata accessions from the above three regions in the present study. The aims of this work are:
- • to assess polymorphic AFLP markers with highly informative value and to characterize the genetic diversity in selected accessions;
- • to investigate genetic relationships among wild accessions and specifically to estimate the extent of variation between and within ecogeographical groups and subgroups;
- • to elucidate the effects of geographical isolation and environmental factors on the genetic diversity and pattern of the population structure.
2 Material and methods
2.1 Plant materials
The plant material was collected from different localities of four Asian countries including China, Kazakhstan, Kyrghyzstan, Tajikistan (Fig. 1). A total of 41 indigenous orchardgrass accessions were considered, which represented three geographical groups, CA (Central Asia, 13), XJC (Xinjiang of China, 10), SWC (Southwest China, 18). The sampling locations and their geographic coordinates are shown in supplementary data, Table S1. The seeds of Chinese accessions were collected from different sites, and other accessions were obtained from the National Plant Germplasm System, USA. Seeds from each locality were germinated directly and maintained at Sichuan Agricultural University, Ya’an, Sichuan. Each accession was represented by a bulk sample. For each accession, chromosome identification was studied in squashed root tips obtained from 3-day-old germinated seedlings. In this study, Carnoy's fluid (3:1 v/v, absolute ethanol and glacial acetic acid) and preheated hydrochloric acid (60 °C, 1 mol/L) were used to fix and hydrolyze the root tips respectively. Then, the root tips were dyed with improved carbol fuchsin and sliced to examine the ploidy of 41 materials by microscopy (supplementary data, Table S1).
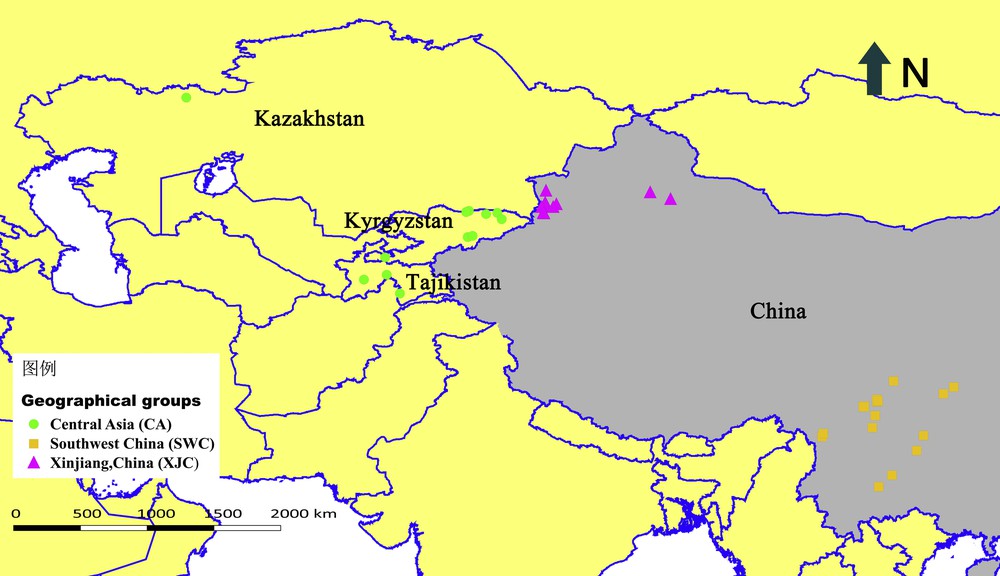
Geographical distribution of the studied Dactylis glomerata accessions in Central Asia, Xinjiang of China and Southwest China based on the localities.
2.2 DNA extraction and AFLP analysis
The bulked samples were generated with an equal amount (50 mg) of the fresh leaf tissues of 20 individuals per accession, and then were subjected to DNA extraction by using a plant DNA extraction kit (Tiangen, Beijing) following the manufacturer's instructions. The DNA concentration was quantified using NanoDrop® ND-1000 Spectrophotometer (NanoDrop Technologies, USA) and diluted to 100 ng·μL−1 for AFLP analysis.
AFLP analysis was performed according to the AFLP® Plant Mapping Protocol (Applied Biosystems, USA) with some minor modifications. The EcoRI selective amplification primers were labeled with 6-FAM fluorescent dye at the 5′ end (supplementary data, Table S2). Briefly, the genomic DNA (200 ng) was digested with two restriction enzymes EcoRI (10 U) and MseI (2 U) to generate small DNA fragments for 2.5 h at 37 °C and then deactivated at 70 °C for 15 min. The EcoRI and MseI barcoded adapter were ligated to digested DNA using 5 U T4 DNA ligase for 2 h at 37 °C. Ligation products of each sample were then diluted 20-fold with TE buffer (20 mM Tris–HCL, 0.1 mM EDTA, pH 8.0) and used as a template for pre-selective amplification with the primer pair EcoRI + 1/MseI + 1. The pre-amplified products were detected by electrophoresis in 1% agarose gel. The PCR products of pre-amplification were diluted 20-fold and used as a template for selective amplification with eight EcoRI + 3/MseI + 3 selective primer combinations, which were chosen from 48 sets screened using four randomly selected samples. The amplified fragments were separated and scored with the ABI 3730xl DNA Analyzer.
2.3 Date acquisition and statistical analysis
Fragment analysis was performed using the Genemarker v2.2.0 (Softgenetics, USA). A panel of scorable fragments was established for each primer combination, and fragments between 50 and 510 bp were scored. AFLP profiles were converted into a combined presence/absence (1/0) matrix using a minimum detection threshold of 300 relative fluorescent units (RFU) to avoid artifacts. Both monomorphic and polymorphic peaks were considered in the matrix. Only visually distinct and reproducible peaks were considered for data analysis. To identify the most informative primer pair combination, the binary data were used to calculate different parameters such as polymorphic information content (PIC), marker index (MI), and resolving power (RP). The PIC for each primer combinations was calculated according to formula: PICi = 2 fi (1 − fi), where PIC is the polymorphic information content of marker i, fi is the frequency of the fragments that were present and 1 − fi is the frequency of the fragments that were absent [36]. PIC was averaged over the fragments for each primer combination. The marker index (MI) was calculated following Powell [37] as: = PIC × EMR, where EMR (effective multiple ratio, EMR = PP ×NPF) is defined as the product of the percent of polymorphic loci (PP) and the number of polymorphic loci (NPF). The resolving power (Rp) of each primer combination was calculated according to Prevost and Wilkinson [38] as: Rp = ∑Ib, where Ib is the fragment informativeness and is calculated as: Ib = 1−[2 × |0.5 − p|], where p is the proportion of the accessions containing the fragment. The probability that the DNA fingerprints of two accessions of orchardgrass will be identical by chance was then estimated as described by Ramakishana et al. [39], the average Dice similarity index for all pairwise comparisons () was done by employing the formula ()n, where
Pairwise Dice genetic dissimilarities (GD = 1–GS) among all possible pairs of accessions were calculated using all scorable AFLP fragments of markers. The distance matrix was then used to construct a cluster using the Unweighted Pair Group Method with Arithmetic (UPGMA) method for analyzing genetic relationships. Principal coordinate analysis (PCoA) was used to study the relatedness within a matrix by converting the genetic distance into eigenvectors and values. All were performed using the NTSYS-pc v 2.10. Bootstrap analysis (1000 replicates) was performed to assess the relative support for different groups and the stability of the dendrogram, using the Free Tree software [40].
To better understand the genetic pattern of wild orchardgrass accessions, the matrix was analyzed using a Bayesian model-based clustering method, as implemented in STRUCTURE v2.3.4 software [41,42]. As suggested by Forsberg et al. [43] for outcrossing species, and applied in another study [3], we analyzed data as haploid, treating heterozygous loci as missing data. Structure simulations were carried out using an admixture model. In order to perform accurate assignments of individuals without overestimating it, the range of K was set from 1 to 15. The model was run for 10 independent simulations for each K applied with a burn-in length of 50,000 and a run length of 100,000 Markov Chain Monte Carlo (MCMC) replicates after burn-in. The choice of the relevant numbers of clusters was guided by calculating ΔK using the method presented in Evanno et al. [44]. To properly evaluate multimodality of the structure output, the 10 repeats for each K from the structure simulations were merged using CLUMPP software [45]. CLUMPP was used with the Greedy Algorithm method and the results were visualized using the Distruct v1.1 software [46]. The same procedure and settings were used for all analyses of genetic structure.
Furthermore, we applied a non-Bayesian partitioning method, which does not assume a Hardy–Weinberg equilibrium, using the program FLOCK 2.0 [47]. This piece of software first pools all genotypes and subsequently divides them into K sub-samples by iterative reallocation so that most similar genotypes will be grouped together. Fifty runs (each with 20 iterations) were conducted from K = 2 to K = 5.
Non-hierarchical analyses of molecular variance (AMOVA) were performed in Arlequin v 3.5 [48] to assess genetic differentiation among groups (Fst), overall and within geographical groups or STRUCTURE-inferred subpopulations. Significance tests of both F-statistics and pairwise Fst values were performed on the basis of 9999 permutations. The exact test for linkage disequilibrium for all marker pairs in each population implemented in the program ARLEQUIN was also applied. GenAlex 6.5 [49] was used to calculate the number of different alleles (Na), number of effective alleles (Ne), Shannon's information index (I) [50], expected heterozygosity (He) and Nei's genetic distance among groups based on geography distribution and STRUCTURE-inferred subpopulations.
The coordinates of the collection site were available. Data on climatic variables (average annual temperature, average annual precipitation) were obtained from DIVA-GIS (http://www.diva-gis.org/) (supplementary data, Fig. S1). These data were obtained to investigate the ecogeographical distribution of the accessions and the relationship between ecogeography and genetic variation. The geographic distance matrix was calculated using Geographic Distance Matrix Generator v1.2.3. The Mantel test was performed to evaluate the correlation between the genetic distance (GD = 1–GS) and geographic distance matrix using Isolation by Distance (IBD) software v1.53 [51]. Significance in the isolation by distance relationship was tested statistically with 999 random permutations. For elevation and climate data (average annual temperature and average annual precipitation), we used NTSYS to calculate the average and standardized distance and then calculated the relationship with genetic distance though GenAlex 6.5.
3 Results
3.1 Test for linkage disequilibrium
The linkage disequilibrium for all marker pairs was tested in the three geographical populations. The percentage of linked loci in significant linkage disequilibrium (P < 0.01) per polymorphic locus was 2.92% (XJC Group), 13.06% (SWC Group) and 15.15% (CA Group), with an average of 10.38%, suggesting independence, viz., good coverage of the genome of most AFLP markers.
3.2 AFLP polymorphism and genetic variation
The eight primer combinations that were deployed to analyze the 41 wild orchardgrass accessions produced 543 reproducible bands with strong signal. The total number of amplified fragments (TNF) per primer ranged from 72 (E42M85) to 64 (E85M57 and E86M57) with an average 68 fragments per primer (Table 1). Out of 543 amplified fragments, 531(97.7%) were polymorphic (NPF) at the level P = 0.05, 71 (13%) were unique (NUF) and 125 (23%) were rare (NRF). The average number of polymorphic fragments for a primer was 66, with maximum value was 72 for E42M85 and the minimum one was 60 for E86M57. The primer combination E86M57 produced the least number of unique fragments (4) and rare fragments (9), while most of them were generated by E42M85, 15 and 23, respectively.
Marker parameters calculated for each AFLP primer pair used with D. glomerata.
| Primer code | TNF | NPF | PP (%) | PIC | MI | RP | NUF | NRF | PI |
| E42M55 | 71 | 70 | 98.59 | 0.2292 | 15.82 | 22.63 | 12 | 21 | 4.56 × 10⁻⁶ |
| E42M57 | 69 | 68 | 98.55 | 0.2792 | 18.71 | 27.61 | 7 | 17 | 3.67 × 10⁻⁷ |
| E42M85 | 72 | 72 | 100.00 | 0.2255 | 16.24 | 22.39 | 15 | 23 | 4.85 × 10⁻⁶ |
| E85M55 | 65 | 62 | 95.39 | 0.2595 | 15.35 | 24.20 | 7 | 12 | 6.00 × 10⁻⁶ |
| E85M57 | 64 | 63 | 98.44 | 0.2716 | 16.84 | 34.76 | 8 | 13 | 6.96 × 10⁻⁶ |
| E85M85 | 71 | 70 | 98.59 | 0.2390 | 16.49 | 23.42 | 9 | 14 | 2.75 × 10⁻⁵ |
| E86M57 | 64 | 60 | 93.75 | 0.2427 | 13.65 | 20.98 | 4 | 9 | 3.60 × 10⁻⁵ |
| E86M85 | 67 | 66 | 98.51 | 0.2707 | 17.61 | 26.20 | 9 | 16 | 2.22 × 10⁻⁵ |
| Total | 543 | 531 | – | – | – | – | 71 | 125 | 7.44 × 10−43 |
| Minimum | 64 | 60 | 93.75 | 0.2255 | 13.65 | 20.98 | 4 | 9 | |
| Maximum | 72 | 72 | 100 | 0.2792 | 18.71 | 34.76 | 15 | 23 | |
| Mean | 67.88 | 66.38 | 97.73 | 0.2522 | 16.34 | 25.27 | 8.88 | 15.63 |
Polymorphic information content (PIC), marker index (MI) and resolving power (RP) have been used as three important statistical indicators on estimating discriminatory power when generating an informative AFLP profile. The value of PIC oscillated from 0.2255 (E42M85) to 0.2792 (E42M57) with an average of 0.2522 (Table 1). As the expected maximum PIC value was 0.5 for a bi-allelic locus, about 42% of polymorphic markers (221) had PIC value exceeding 0.30 (supplementary data, Fig. S1) implying that AFLP technique is most suitable for obtaining rapid and precise information about genetic diversity in orchardgrass germplasm due to high marker discriminatory power. MI value ranged from 13.65 for primer E86M57 to 18.71 for primer E42M57 with an average of 16.34. Maximum RP values were 34.76 for primers E85M57, whereas the primers E86M57 showed the lesser values (20.98). All the three statistical indicators showed a positive correlation among each other, but only PIC and RP showed significant correlation r2 = 0.72 (P < 0.05). The whole probability of identical match by chance was found to be 7.44 × 10−43 based on these eight primers, in which E42M57 was top-ranked with respect to informativeness. This suggests that about 7 × 1043 accessions can be precisely identified by using these eight primers under the hypothesis of non-overlapping between the amplified markers.
3.3 Genetic variability and genetic relationships of D. glomerata accessions
All 531 polymorphic loci obtained from eight AFLP primers were used to estimate the Nei–Li (Dice) genetic distance among accessions. The resulting matrix (data not shown) exhibited dissimilarity within the range of 0.1474–0.6201, suggesting rather small degree of genetic variability in this germplasm collection. The maximum value (0.6201) was observed between the accessions PI659885 and D02-109, the minimum coefficient value (0.1474) was observed between D14X-05 and D14X-07 accessions. However, a number of AFLPs that were amplified allowed distinguishing even closely related accessions from each other. The genetic distance-based UPGMA dendrogram (Fig. 2) showed four distinctly major clusters, (at a distance coefficient = 0.418). Clusters I and III comprised most of accessions (78.05%) collected in discrete regions, and had equal number of accessions. Cluster I contains 16 samples including 12 (66.67%) Southwest China and 4 (30.77%) Central Asia accessions. Cluster III was comprised of Xinjiang 10 (100.0%) and Central Asia 6 (46.15%) accessions, but most of grouping nodes had lower bootstrap values. Cluster II contains three Central Asia accessions and two Southwest China accessions. D14-C01, D14-C02, D02-109 and D02-107 from Southwest China comprised Cluster IV, in which D14-C01 and D14-C02 were sampled from Kanding, located in the Tibetan region of the northwestern Sichuan province. As a whole, for clustering result, most of accessions from Central Asia and Southwest China could group together, indicating a closer relationship between them. Although some of Central Asia accessions and all the Xingjiang accessions has been grouped in Cluster III, we can clearly see that most of Central Asia accessions (except PI-659939 and W6-25205) can be separated from Xingjiang accessions in Group III. In terms of UPGMA analyses, accessions like D02-C01, D02-101, D02-107, D02-109 and W6-26252 are genetically potential for crossbreeding purpose due to their clear genetic divergences with other materials and excellent agronomic performance in field test (data not shown).
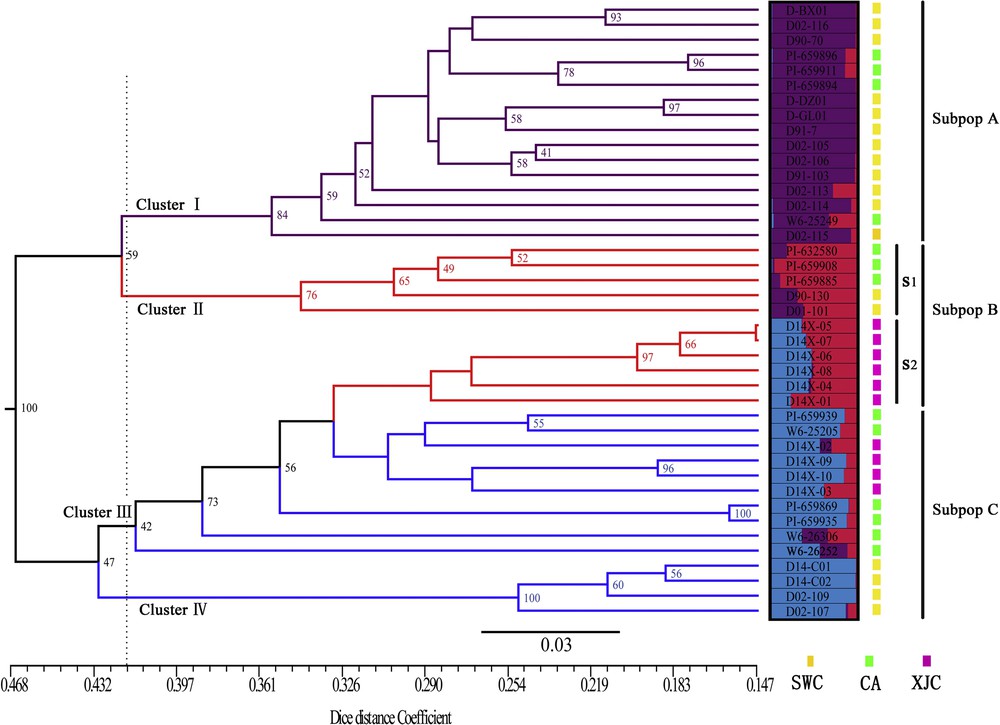
Unweighted Pair Group Method with Arithmetic (UPGMA) tree of 41 accessions of orchardgrass based on Dice coefficient and genetic relationship among orchardgrass using a Bayesian analysis of the population structure at K = 3.
Principle coordinate analysis (PCoA) tallying with the UPGMA dendrogram also showed four clusters (Fig. 3). The first principal axis represents a large 59.82% of variation, the second and third principal axes represent much smaller variations, i.e. 6.99% and 3.9%, respectively. Both UPGMA dendrogram and PCoA failed to resolve clearly most accessions according to their geographic origin except accessions from Xinjiang.
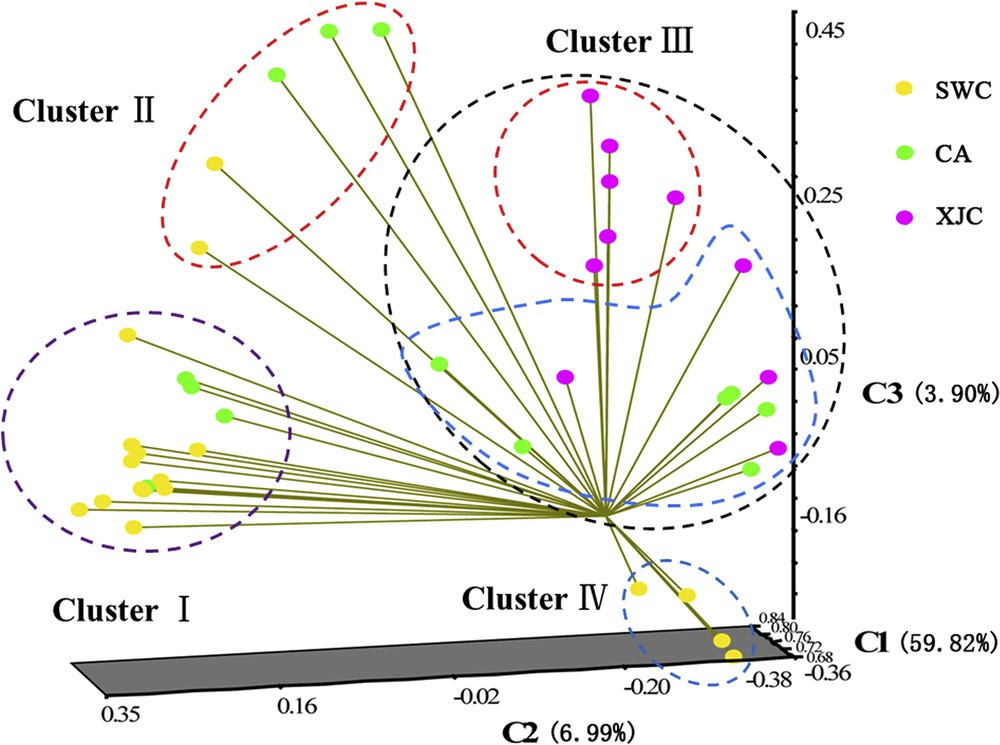
Principal coordinate analysis constructed from amplified fragment length polymorphism (AFLP) markers showing the relationships of the 41 orchardgrass accessions.
The pattern of genetic diversity and population structure of the investigated orchardgrass accessions was further characterized with a Bayesian-based approach. Following the method of Evanno, the ΔK values were plotted against the K numbers of the subgroups [44]. The peak value for the ad hoc quantity with respect to ΔK was observed for K = 3 (supplementary data, Fig. S2), as a result, so K = 3 was considered the best value at which to depict the genetic structure of orchardgrass accessions in West Asia (Fig. 2). As a result, all 41 accessions were assigned to three subpopulations (SPs, Fig. 2), exhibiting a high correspondence with the results of UPGMA clustering and PCoA. In SP A (purple), 16 accessions, SP B (red) 11 accessions, and in SP C (blue) 14 accessions were grouped. SP B could be also divided into two subgroups, S1 and S2, according to their membership composition. Further, accessions under different subpopulations were categorized as pure or admixture, and for categorization purpose accessions with more than 0.80 of membership probability were considered as pure and less than 0.80 as admixture. Using this approach, mixed population ancestry was observed among the three subpopulations (SPs). SP A comprised 14 pure and 2 admixed accessions, SP B included 3 pure and 8 admixtures, SP C consisted of the 4 admixtures and 10 pure samples. The most admixture was observed in SP B. Of the 41 accessions, only 34% (14) showed admixtures. Considering the geographic distribution, the Southwest China Group had maximum pure genotypes (12, 80%), whereas the Xinjiang group had the minimum number of pure genotypes (2, 20%). Furthermore, the Central Asia and Southwest China Group showed admixture with three membership types (Fig. 4). In addition, k = 5 was also plotted to observe the results of population structure, then we found this STRUCTURE pattern can be very consistent with the UPGMA clustering and PCoA analysis (supplementary data, Fig. S3).
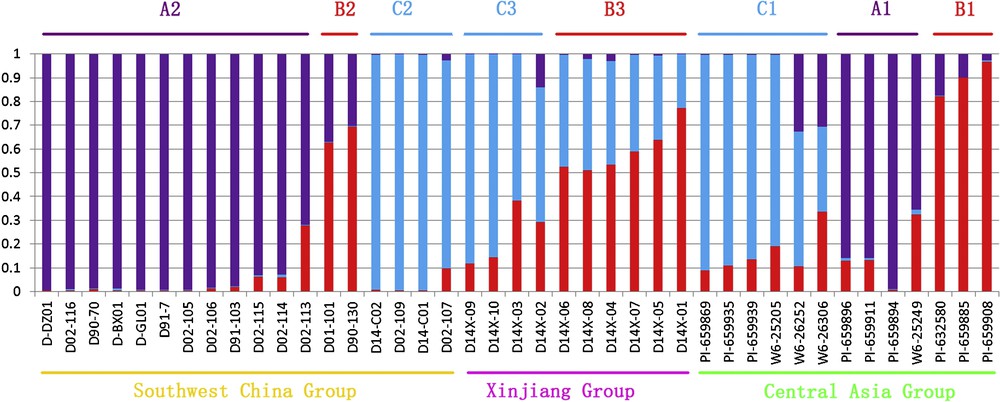
Pattern of genetic relationship among 41 orchardgrass accessions based on STRUCTURE analysis for geographical distribution.
The non-Bayesian approach (FLOCK), however, found a partition into only two genetic clusters as the most likely solution, which can maintain high-resolution power even when most or even all accessions are admixed to various degrees. The result was in agreement with UPGMA and PCoA analysis, in which the first group was matched with Clusters I and II in dendrogram, while another conformed to Clusters III and IV. Hence, all clustering approaches yielded very similar results, i.e. that Southwest China accessions has closer relationship with Central Asia than Xinjiang.
3.4 Genetic divergence in geographic groups
The diversity estimates such as Na and Ne were in ranges of 1.04–1.65 and 1.23–1.33, respectively (Table 2). In the present investigation, it is obvious that the group SWC had the highest intra-group diversity, whereas XJC had the lowest intra-group diversity. The value of I and He showed the maximum for SWC Group (0.33 and 0.21), and the minimum for XJC (0.22 and 0.14). The percentage of polymorphic loci for the geographical groups varied from 46.78% (XJC) to 80.11% (SWC). For overall accessions, the mean value of I and He were found to be 0.34 and 0.21, indicating the existence of relatively low genetic variance.
Different genetic diversity estimates for three geographical groups of orchardgrass.
| Groups | n | Na | Ne | I | He | PP (%) |
| SWC | 18 | 1.65 ± 0.032 | 1.33 ± 0.014 | 0.33 ± 0.010 | 0.21 ± 0.007 | 80.11 |
| XJC | 10 | 1.04 ± 0.041 | 1.23 ± 0.014 | 0.22 ± 0.011 | 0.14 ± 0.008 | 46.78 |
| CA | 13 | 1.49 ± 0.036 | 1.32 ± 0.015 | 0.31 ± 0.011 | 0.20 ± 0.008 | 72.38 |
| Total | 41 | 1.98 ± 0.006 | 1.33 ± 0.014 | 0.34 ± 0.009 | 0.21 ± 0.004 | 100 |
| Mean | 13.7 | 1.39 ± 0.082 | 1.30 ± 0.022 | 0.28 ± 0.006 | 0.18 ± 0.004 | 66.42 |
Non-hierarchical analysis of genetic variability was performed using AMOVA to know the variation among and within three geographical groups. The AMOVA analysis determined that 13.46% of the total genetic variation exists among the groups and 86.54% within groups (Table 3). Fst calculated by Arlequin as an indication of population differentiation was significant (P ≤ 0.001). The total Fst was 0.135 indicated a low level of genetic differentiation between the three geographic groups. Considering that Central Asia was the probable origin place of orchardgrass [4] and consisted by all the three STRUCTURE-inferred memberships in this study, we did a further AMOVA for Central Asia accessions. The AMOVA revealed that a very large proportion of the total variation (69%) of Central Asia accessions could be explained by differences within three subpopulations (A1, B1, C1) (Fig. 4), while only a rather small proportion (31%) resided among subpopulations.
Analysis of molecular variance (AMOVA) for AFLP data of 41 accessions in 3 geographical groups and 13 accessions from Central Asia.
| Source of variation | Degree of freedom | Sum of squares | Variance components | Percentage of variation (%) | Fst | P-value* |
| All 41 accessions | ||||||
| Among groups | 2 | 389.049 | 9.876 | 13.46 | ||
| Within groups | 38 | 2412.451 | 63.485 | 86.54 | 0.135 | ≤ 0.001 |
| 13 accessions from Central Asia | ||||||
| Among subpopulations | 2 | 298.692 | 23.411 | 31.00 | ||
| Within subpopulations | 10 | 521.000 | 52.100 | 69.00 | 0.31 | ≤ 0.001 |
The Nei genetic identity and genetic distance among three groups of orchardgrass have been calculated (Table 4), and the UPGMA dendrogram was visualized through MEGA (supplementary data, Fig. S4). Nei's genetic distance between groups was in the range of 0.038–0.072. Generally, a low genetic distance was observed between the Central Asia Group and the Southwest China Group, which are geographically more distant. The same regularity was presented on the Fst value, which ranged from 0.071 to 0.228 and indicated a different extent of genetic differentiation among three geographic groups (Table 4). SWC and XJC group showed the largest Fst (0.228); otherwise the CA and SWC groups showed the lowest values of Fst (0.071).
Nei's genetic distance and pairwise Fst values among three geographic orchardgrass groups, Fst (above diagonal) and Nei's genetic distance (below diagonal).
| SWC | XJC | CA | |
| SWC | – | 0.228 | 0.071 |
| XJC | 0.072 | – | 0.104 |
| CA | 0.029 | 0.038 | – |
To find out the influencing factors of genetic relationships, we generated the Mantel test between genetic distance and environmental distance due to geographic coordinates, elevation, average annual temperature, and average annual precipitation, respectively. There was a significantly positive correlation between genetic distance and geographical distance for all accessions (r = 0.301; P ≤ 0.001), indicating isolation by distance effects between the accessions studied. On the other hand, the Mantel test of the Xinjiang accessions revealed a significant, positive, and strong correlation (r = 0.449, P < 0.018), while weak correlations were found in the Southwest China Group (r = −0.119, P ≥ 0.817) and Central Asia Group (r = 0.146, P ≥ 0.145). The result of the Mantel test between genetic distance and other three environmental distances (elevation, average annual temperature and average annual precipitation) within each geographical group are showed in Table 5. We found a non-significant correlation between genetic distance and the three environmental distances for three geographical groups, except precipitation distance in Central Asia (r = 0.196, P ≤ 0.05) and Xinjiang of China (r = 0.509, P ≤ 0.001). Within the three groups, Xinjiang accessions showed more influence of the environment on the genetic diversity due to relatively high Mantel r-value (0.331, 0.509 and 0.290).
Mantel test between genetic distance and three environmental distances within three geographical groups.
| Geographical groups | Factors | r | P |
| Southwest China | Elevation | 0.017 | 0.368 |
| Average annual precipitation | −0.098 | 0.230 | |
| Average annual temperature | −0.214 | 0.851 | |
| Central Asia | Elevation | 0.056 | 0.302 |
| Average annual precipitation | 0.196 | 0.048 | |
| Average annual temperature | −0.039 | 0.372 | |
| Xinjiang of China | Elevation | 0.331 | 0.091 |
| Average annual precipitation | 0.509 | 0.007 | |
| Average annual temperature | 0.290 | 0.093 |
3.5 Genetic divergence in STRUCTURE-inferred subpopulations
Analysis of molecular variance (AMOVA) was also performed to study genetic differentiation among three subpopulations (A, B, and C) from the STRUCTURE-clustering pattern and to estimate the percentage of intra- and inter-subpopulation genetic variation (supplementary data, Fig. S3). A significant variation was observed among the STRUCTURE-inferred subpopulations (P ≤ 0.001). The results from AMOVA analysis revealed that 74.77% of the total genetic variation occurred within regions, while 25.23% were attributed among subpops. This analysis also revealed a certain degree of differentiation in allele frequencies (Fst = 0.25) among the three subpops (supplementary data, Fig. S3). In addition, it is essential to carry out a more detailed division of the admixed subpopulations. In the present study, the genetic structure showed SP B was the most mixed, and can be divided into two subgroups (supplementary data, Tables S1 and S2) (Fig. 2). The AMOVA for 11 accessions of SP B also showed that more than half of the molecule variance (66.27%) resided within SP B with a high Fst value (0.338, P ≤ 0.003) (Table 3), so we could definitely establish the two differentiated subgroups (S1, S2) (Fig. 2). As a supplement, we generated the genetic diversity parameters of the three different subpopulations (in terms of A, B, and C). Levels of variation within subpopulations varied, but were generally low. Among the three subpops, SP C had the relatively high Na (1.473 ± 0.037), Ne (1.31 ± 0.014), I (0.30 ± 0.011), He (0.19 ± 0.008) and PPL (71.27%), while SP B showed the lowest Na (1.11 ± 0.040), Ne (1.23 ± 0.014), I (0.22 ± 0.011), He (0.14 ± 0.008) and PPL (51.75%) (supplementary data, Fig. S4). This result revealed that SP C had higher variation than SP A and B, which confirmed the STRUCTURE analysis, in which SP C had most admixed accessions.
4 Discussion
4.1 AFLP and genetic diversity
In order to evaluate genetic diversity of orchardgrass germplasms in different aspects, we used high-throughput AFLP makers combining with a DNA-bulking approach to characterize genetic diversity at the accession level and the group level (based on the geographical group or the genetic background). The results suggest that AFLP markers provide powerful tools to investigate genetic relationships among wild orchardgrass collections. We observed the 97.73% of polymorphism in analyzed germplasm, compared to dominant markers of AFLP 80.50% [21], RAPD 41.20% [17], SRAP 47.24% [29], SCOT 79.55% [52], ISSR 83.18% [18] for different orchardgrass germplasms. In addition, all primer combinations had generated a unique fragment (with an average of 8.88 per primer) indicated that those primers can be used to develop sequence tagged site (STS) markers to identify particular accessions [53]. PIC value has been primarily and most extensively used as measure of discriminatory power or informativeness of markers in most diversity studies [54,55]. MI (marker index) is used to calculate the overall utility of a marker system [37,56], and Rp (resolving power) is used to indicate the discriminatory potential of the primer to distinguish the genotypes or individuals [56,57]. These indexes have been used to compare AFLPs with other molecular markers. Prevost and Wilkinson [38] and Fernandez et al. [33] found a strong and linear relationship between the ability of a primer to distinguish genotypes and the resolving power (Rp), but not with the marker index (MI). In the report of Gupta et al. [58] and Chandrawati et al. [14], they found a strong correlation between MI and Rp (r2 = 0.99, P < 0.005), which indicated that MI could also be used as a reliable attribute to determine the discriminatory power of a primer combination. In contrast, Laurentin and Karlovsky did not find any correlation of PIC, Rp, and MI with sesame genotypes resolved [59]. In the present study, we found a seemingly linear relationship between MI and Rp (r2 = 0.58, P < 0.05). If PIC, Rp, and MI can be used as a reliable attribute to determine the discriminatory power of the primer combinations, E42M57 (PIC 0.28, MI 18.71, RP27.61), E85M57 (PIC 0.2716, MI 16.84, RP 34.76) and E86M85 (PIC 0.2707, MI 17.61, RP 26.20) can be considered as the ideal primer combinations for diversity and evolutionary studies. Considering unique fragment per accession, the primer combination E42M85 could be important for germplasm characterization as it could differentiate 15 accessions though it had low-moderate PIC, MI, and RP indexes.
Overall all accessions, the mean Shannon index (I = 0.34) was lower as compared to Xie et al. (I = 0.52) [60] and Yan et al. (I = 0.538) [3]. This might due to the difference of germplasms or smaller size in amount. Generally, sampling of a greater number of accessions with different origins for outcrossing species might contribute to accurate intra-species diversity evaluation compared with fewer sampling size. In this study, both geographical groups and STRUCTURE-inferred subpops showed lower level of diversity within populations (mean I = 0.28, He = 0.18, and I = 0.26, He = 0.17, respectively), compared with individual plant-based breeding population (I = 0.499, He = 0.343) [13] and natural population (He = 0.53) [35] using SSR markers. This might be due to the use of DNA bulks, which favored the detection of “consensus” fragments (i.e. common alleles or bands) among individuals in each accession [61]. Consequently, lower-frequency or unique alleles present in only a few genotypes may have been diluted to such an extent that they were not amplified efficiently. Some allelic information, therefore, was likely lost as a result of DNA-bulking. It would also be further caused by the natural characteristic that the cross pollination led to lower variability between the populations [35].
4.2 Genetic relationship and population differentiation
Accurate identification and evaluation of the genetic relationships and differentiations of wild orchardgrass accessions are very important for its resource protection, evolution research and cultivar development. The UPGMA and PCoA divided all 41 accessions into four major clusters based on their genetic distance, and both of them can reflect the genetic relationships among the 41 accessions. Most of Southwest China accessions were grouped with Central Asia accessions. All the Xinjiang accessions were grouped together. Distance-based methods are limited and more suited to exploratory data analysis than to fine statistic inference [41]. Hence, a recommended Bayesian approach by STRUCTURE software was adopted to generate three subpopulations to represent different genetic ancestries. Considering all the orchardgrass accessions together, we indicated that there were close phylogenetic relationship between Southwest China and Central Asia accessions, which coincides with UPGMA and PCoA. In addition, by their inferred genome fraction value (> 80%), the STRUCTURE analysis also showed that most of the accessions (65.85%) were categorized as having pure ancestry; this may arise from the limited gene flow among those wild accessions and their independent development under distantly natural stands. However, 80% of Xinjiang accessions had mixed genealogies; this might be due to the certain level of gene flow in local area. The inference can be confirmed by the Mantel test in Xinjiang region, which showed a relatively high correlation (r = 0.4485, P < 0.018) between geographical distance and genetic distance, so that gene flow between different samplings in Xinjiang was possible.
The genetic diversity of populations is a major capacity for the adaptation to various and changing environmental conditions [62]. However, in this study, AMOVA analysis showed that a large proportion of the genetic variation was detected within, rather than between geographical groups, which is in agreement with studies on the germplasm of cross-pollinated grass from different geographical regions [8,21,63,64]. Since most of the analyzed accessions were sampled from distinct sites, the high percentage of observed diversity within ecogeographical groups might be partly due to the probable isolation by distance effects among wild accessions studied with limited transport capabilities of seed or pollen over long distances or geographical barriers (Mt. Tianshan and Altai, Tibet Plateau, Mt. Hengduan, etc.), and then could be assumed that the gene flow may appeared mainly between neighboring accessions within local areas. Spatial environmental variation and thus ecological diversification between habitats is crucial for the maintenance of genetic variability due to evolutionary forces such as divergent selection and local adaptation [62,65]. The current study is among the first to jointly estimate the relative influence of isolation by distance and environmental adaptation on genetic differentiation and population structure of wild orchardgrass. Remarkably, however, we did not detect a clear pattern of isolation by distance for three distantly geographical groups. The Mantel test between genetic distance and geographic distance in our study was weakly correlated (r = 0.301, P < 0.001), therefore only 9% (r2 = 0.09) of the genetic distance could be due to the geographic distance among the accessions. For instance, accession from Southwest China which were in close geographical proximity to each other failed to genetically cluster together in STRUCTURE, FLOCKS, UPGMA, and PCoA analysis, suggesting a non-strict congruence between the geographical distribution of sampled accessions and their genetic relationships. Similar results were also found by Last et al. [35], who detected significant correlations (r = 0.39) between pairwise genetic distances and the corresponding geographical distances among orchardgrass populations from three European regions. Also it was reported that genetic diversity in Chinese germplasm is distinctly related to geographical location [8,21]. Nonetheless, the spatial distribution of genetic diversity cannot be solely explained by a simple isolation by distance model and requires additional factors that influence the observed genetic population structure, such as environmental factors [28]. A few studies also indicate that bioclimatic types and elevation played a key role in the divergence of plant populations [34,66,67]. In the present study, the Mantel test between genetic distance and environmental distance revealed that the three environmental factors elevation, average annual temperature and average annual precipitation are almost not significantly related to the divergence of orchardgrass accessions. However, within Central Asia (CA) and Xinjiang province (XJC), genetic distance and precipitation difference showed significantly positive correlation, so it is inferred further that average annual precipitation is probably one of the main contributors to the genetic structure of orchardgrass in these two sites, which belong to an arid and semi-arid temperate climate zone [68,69]. In addition, the negative and not significant correlation within SWC group might be due to the complex topographic features of the southwest of China, resulting in an imbalance between environmental impact and genetic differentiation. Hence, the data from present investigation suggested that the genetic structure of current accessions from these three regions is not randomly distributed, but is associated with ecogeographical factors.
4.3 Inferences of colonization history
Orchardgrass as a cosmopolitan excellent pasture has a long history of cultivation in China. Molecular studies by Stewart and Ellison have shown that during the interglacial period before the last glaciation, a successful Central Asian diploid progenitor, similar to today's ssp. altaica, expanded its range to cover a broad region [4]. This is in agreement with the present study that Central Asia included all the three STRUCTURE-inferred subpopulations (A1, B1 and C1) (Fig. 4), while Xinjiang group did not have the collections represented by purple. In this study, Bayesian and genetic distance-based approaches showed that Central Asia accessions had closer relationship with Southwest China accessions, while a relatively farther relationship with Xinjiang accessions. When combined with higher diversity index of Southwest China accessions, we support that Southwest China might be the internal diversity center of D. glomerata in China.
Disclosure of interest
The authors declare that they have no competing interest.
Acknowledgements
We are very grateful to Chenglin Zhang, Yan Fan, Kaixin Fu, Wendan Wu for helping writing this paper, Jianbo Zhang for writing assistance, and Xinquan Zhang, Shiqie Bai, Yan Peng, Linkai Huang, Yanhong Yan for proof reading the article. This work was supported by the Earmarked Fund for the Modern Agro-Industry Technology Research System (#CARS-35-05) and National Science and Technology Supporting Project (#2012BAD13B06).