


 CC-BY 4.0
1. Introduction
The northern and eastern slopes of the Monts Dore Massif constitute a particularly complex structural zone. This area lies at or near the intersection of two major tectonic systems of metropolitan France: the South Armorican Shear Zone (SASZ) and the Sillon Houiller Fault (SHF). This geographical position gives the region a key role in understanding the recent tectonic structuring of the Massif Central and the geodynamic evolution of the French territory.
The South Armorican Shear Zone (SASZ) is a wide strike-slip zone inherited from the Variscan orogeny, trending generally NW–SE, with some branches still considered active (Palumbo, 2012). One of its eastern extensions, supported by the Cholet–Poitiers Fault (CPF), appears to continue toward the Southern Border Fault of the Limagne Graben (SBLF), between Issoire and Brioude. This fault then continues eastward toward the Puy-en-Velay Basin, and further toward the Provençal Basin (Figure 1).
Simplified map based on data from the Database of Potentially Active Faults (BDFA, (IRSN, 2020)). Faults are shown in black, without distinction of age or activity. The main locations indicated are: (1) Cholet–Poitiers Fault (CPF), forming one of the eastern branches of the South Armorican Shear Zone (SASZ); (2) the Southern Border Fault of the Limagne Graben (SBLF) between Issoire and Brioude, extending eastward toward Le Puy-en-Velay and the Provençal Basin; (3) the Sillon Houiller Fault (SHF); (4) the Villefranche-de-Rouergue Fault (VRF); (5) the Loire Fault (LF); (6) the Sillon Houiller Fault between Bert and Le Creusot (BLCF) and its eastward continuation; (7) the Limagne Fault along its western border between Issoire and Volvic (WBLF); (8) the Tauves–Aigueperse Fault (TAF); and (o) the study area (red frame), located along the inferred missing fault segment between the CPF and the SBLF.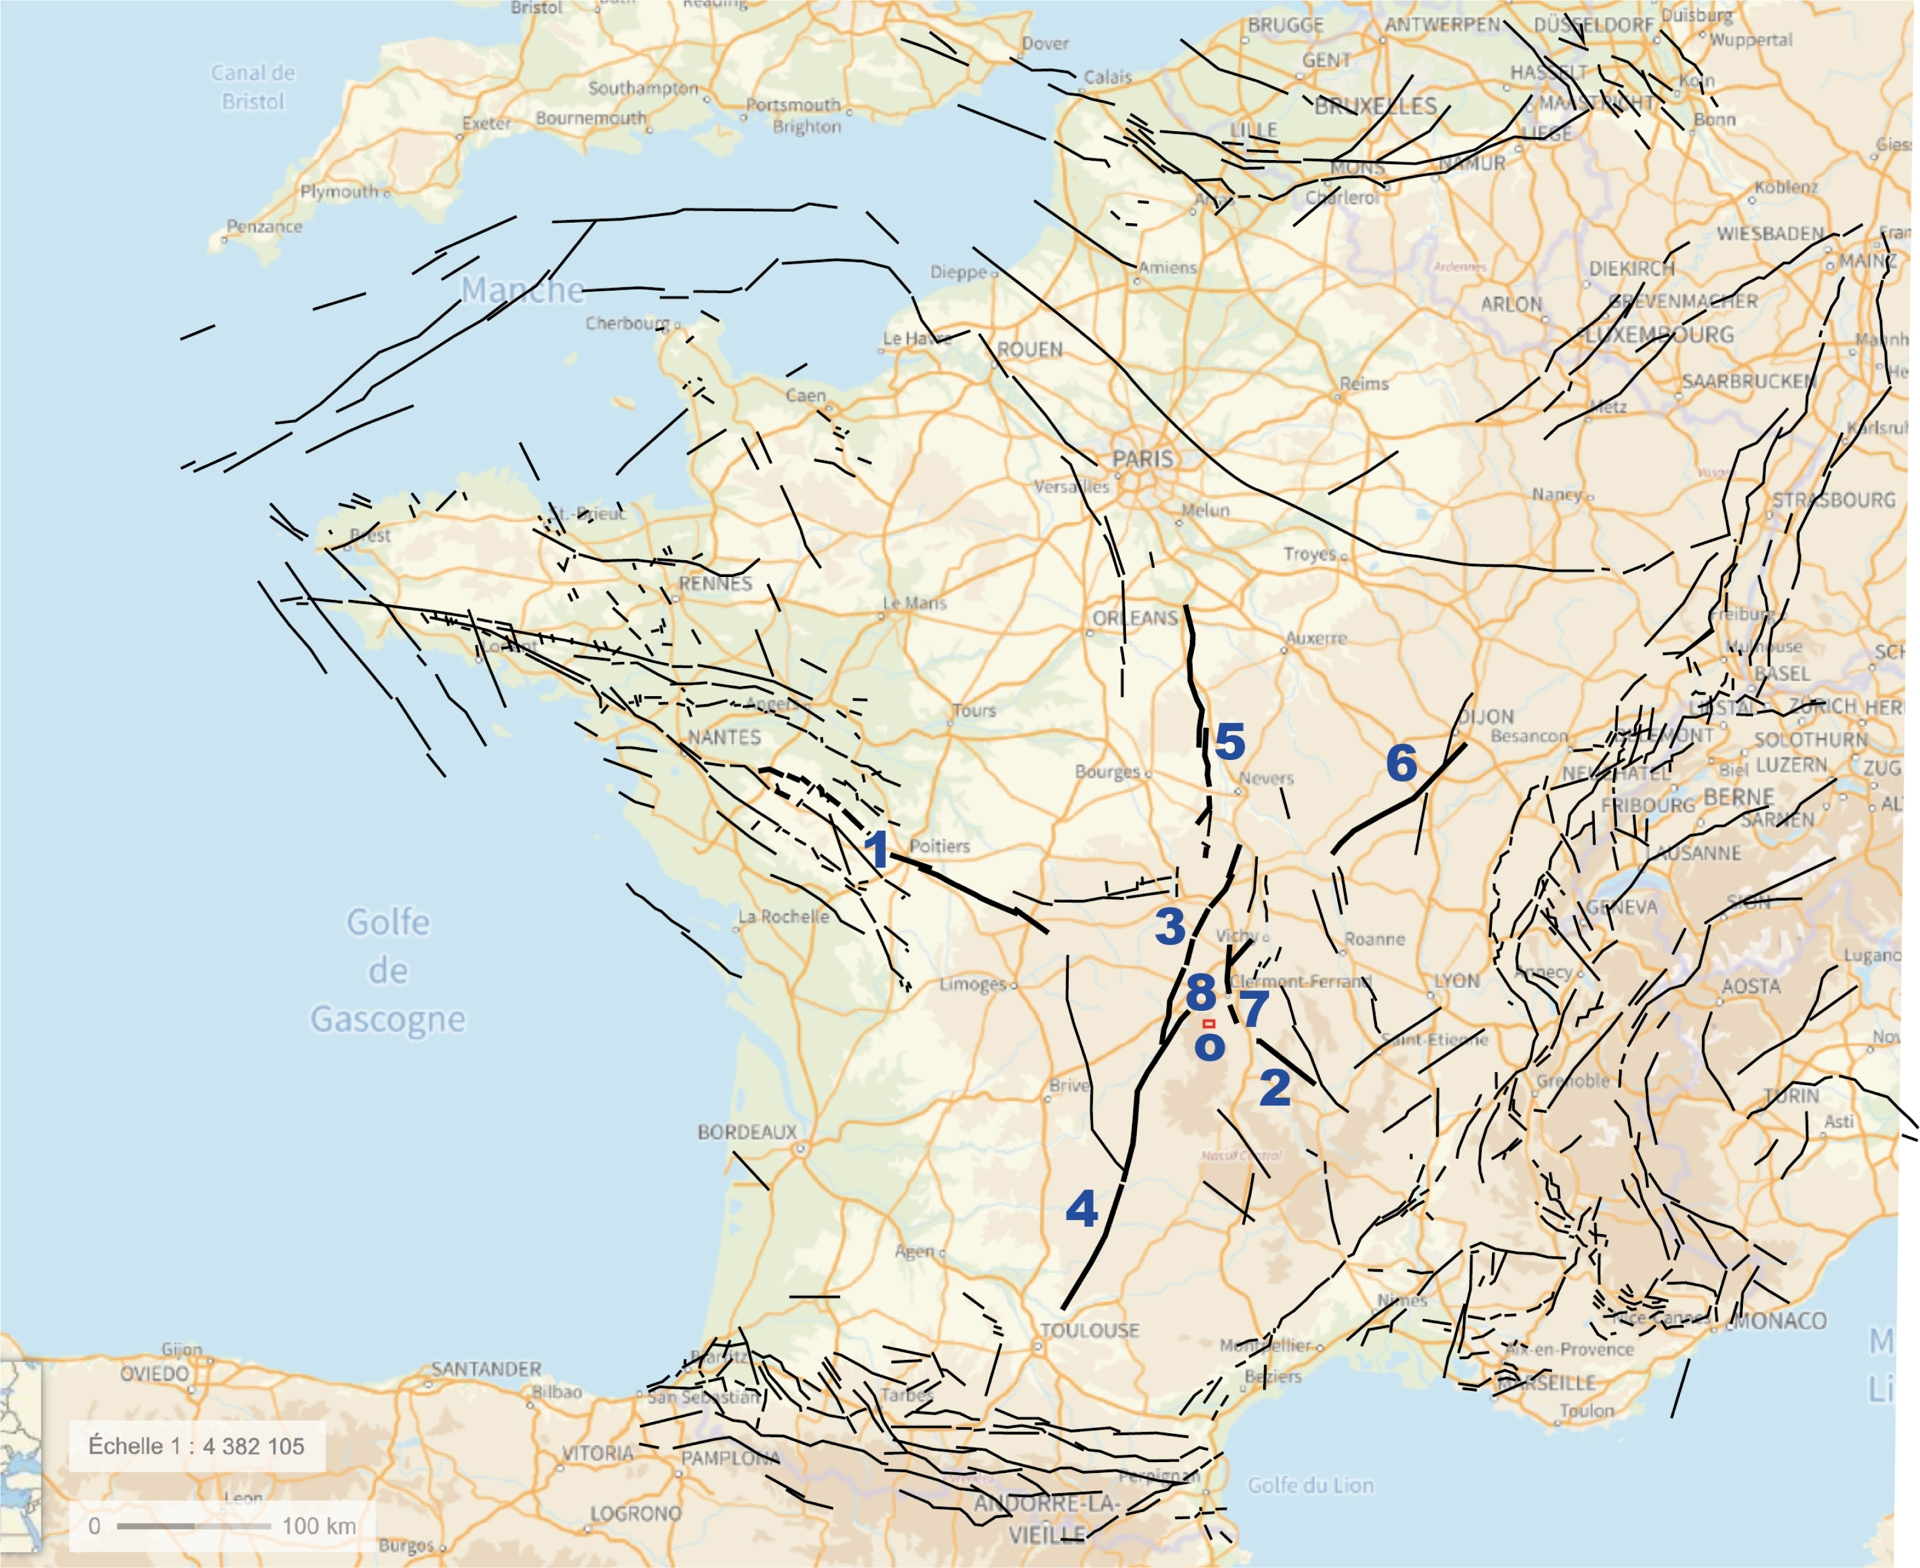
The Sillon Houiller Fault (SHF), on the other hand, follows a N20°E trend and is characterized by an associated network of faults, including the Loire Fault (LF) to the north and the Tauves–Aigueperse Fault (TAF) to the northeast, which continues toward the Bert–Le Creusot Fault (BLCF). Thus, the Sillon Houiller Fault also constitutes a major tectonic structure, forming a vast seismogenic lineament extending from the Villefranche-de-Rouergue Fault (VRF) to the Paris Basin. The interactions between these two major tectonic systems—the South Armorican Shear Zone (SASZ) and the Sillon Houiller Fault (SHF)—remain poorly understood, particularly due to the extensive cover of volcanic formations in the Massif Central.
Nevertheless, this structural context may have played a determining role in the emplacement and evolution of regional volcanism, notably by controlling magma ascent and the location of volcanic edifices. Analyzing this zone of tectonic convergence is therefore essential for refining our understanding of the recent geodynamic history of the Massif Central.
The objective of this article is to highlight the respective influence of the SASZ and the SHF on the present-day structuring of the eastern slope of the Monts Dore. To this end, we present a detailed morphostructural study of an area located between the Col de la Croix-Morand and the town of Murol, around Lake Chambon. This analysis is based on the integration of field observations with data derived from aerial photographs, satellite imagery, and digital elevation models. It leads to a preliminary interpretive model of tectonic structuring in this transitional zone, along with an assessment of associated seismic hazards.
2. Geological context
2.1. Previous work
The study area is located on the eastern slope of the Monts Dore Massif. This zone has been the subject of several significant geological studies, which today allow a better understanding of its main characteristics. Among the notable contributions:
- As early as the late 1950s, Louis Glangeaud proposed a regional geodynamic framework to explain volcanism within the Massif Central, in connection with a network of faults and dykes oriented N0°E, N60°E, and N120°E (Glangeaud and Lemonnier, 1958; Glangeaud, Bobier, et al., 1965).
- Following the oil shocks of the 1970s, research programs were initiated to assess the geothermal potential of the Massif Central. In this context, the exploration work led by Varet, Stieltjes, Gadalia, et al. (1977), Varet, Stieltjes, Gérard, et al. (1980) provided a benchmark synthesis of the state of hydrological and geophysical knowledge of the Monts Dore massif at that time, rightly emphasizing that “a profound lack of understanding of the Tertiary and Quaternary tectonics … at the scale of this massif still remains” (Varet, Stieltjes, Gadalia, et al., 1977).
- Jean-Claude Besson (Besson, 1978) specifically studied the Mont-Dore volcanic formations, providing detailed insights into the stratigraphy and nature of eruptive products.
- In the 1990s, Professor Jean-Jacques Macaire’s team (University of Tours) conducted several in-depth studies of Lake Chambon. These works focused mainly on lacustrine sediments, their volume and depth, as well as sedimentation and erosion rates in the catchment during the Late Glacial and Holocene periods (Macaire, Corcita, et al., 1992; Dupis et al., 1996; Macaire, Bossuet, Choquier, Corcita, de Luca, Dupis, Gay, Mathey, et al., 1997; Gay et al., 1998; Gay-Ovejero and Macaire, 1999).
- Around the same time, the Laboratoire Magmas et Volcans (University of Clermont-Ferrand II) published studies on debris avalanche deposits in the area (Cantagrel and Briot, 1990; Vidal et al., 1996; Bernard et al., 2009).
- More recently, the BRGM released a preliminary harmonized vector version of the geological map for the area (Veyre-Monton sheet), accessible via the InfoTerre platform (Figure 2). The 1:50 000 scale map has not yet been officially published, but a provisional version of its explanatory booklet is available in open access on the BRGM publications website (Chèvremont et al., 2022) at geolfrance.brgm.fr.
Screenshot of the harmonized 1:50 000 geological map extracted from the BRGM Infoterre website (https://infoterre.brgm.fr). A semi-transparent digital elevation model is superimposed. I. Surficial deposits and processes. F: alluvium. FG: fluvioglacial deposits. G: moraines. T: peat bogs. E: volcanic rock scree deposits. C: volcanic rock colluvium. GT: rockfalls and landslides. II. Recent Quaternary volcanism. 𝜷q: leucobasalts (including those of Tartaret). III. Lower to Middle Pleistocene volcanism of the Sancy massif. 𝜟2: Sancy debris-avalanche deposits. Sb: volcanoclastic formations of the Sancy. S: Lower to Middle Pleistocene sancyites of the Sancy massif. 𝝉𝜶2: Lower to Middle Pleistocene trachybasalts and trachyandesites of the Sancy. IV. Upper Pliocene to Lower Pleistocene volcanism of the Monts Dore. 𝜟1: Monts Dore debris-avalanche deposits. 𝜱: phonolites. 𝝉𝜶1: trachyandesites (broad sense). D: mugearites and doréites. O: ordanchites. 𝝉𝜷: Bressouleille trachybasalts. 𝜷o−p: demi-deuil basalts, basalts with olivine or pyroxene phenocrysts. V. Pliocene volcanism of the Dômes Plateau. Sp: scoria and scoriaceous ejecta. 𝜷p: undifferentiated basalts. t-vs: undifferentiated Plio-Quaternary volcanism (tephra and volcano-sedimentary deposits). 𝜷m: Miocene volcanism of the Dômes Plateau (ankaramites and basalts). VI. Oligocene. g1−2: quartz–feldspathic clays and sands. VII. Hercynian basement. 𝜸3: two-mica granite of Chambon-sur-Lac. 𝜸2: St-Nectaire granite. Pg: Upper Gneiss Unit (paraderived migmatites). Lp: Upper Gneiss Unit (leptynitic gneisses). Basement faults are shown in black. (a) Quancouve stream fault (QF); (b) Jassat fault (JF); and (c) Saint-Victor-la-Rivière fault (SVRF). Yellow stars indicate eruptive vents, whose alignments suggest probable magma ascent pathways. Arabic numerals and red circles indicate major landslide areas potentially related to recent seismogenic faults: 1: Dent du Marais landslide; 2: Champsiaux–Berlaire (or Chambon-sur-Lac) landslide; 3: Montagne de la Plate landslides; 4: Jonas landslide; 5: La Borie landslide; 6: Murol landslide. Black arrows indicate the direction of debris-avalanche movement.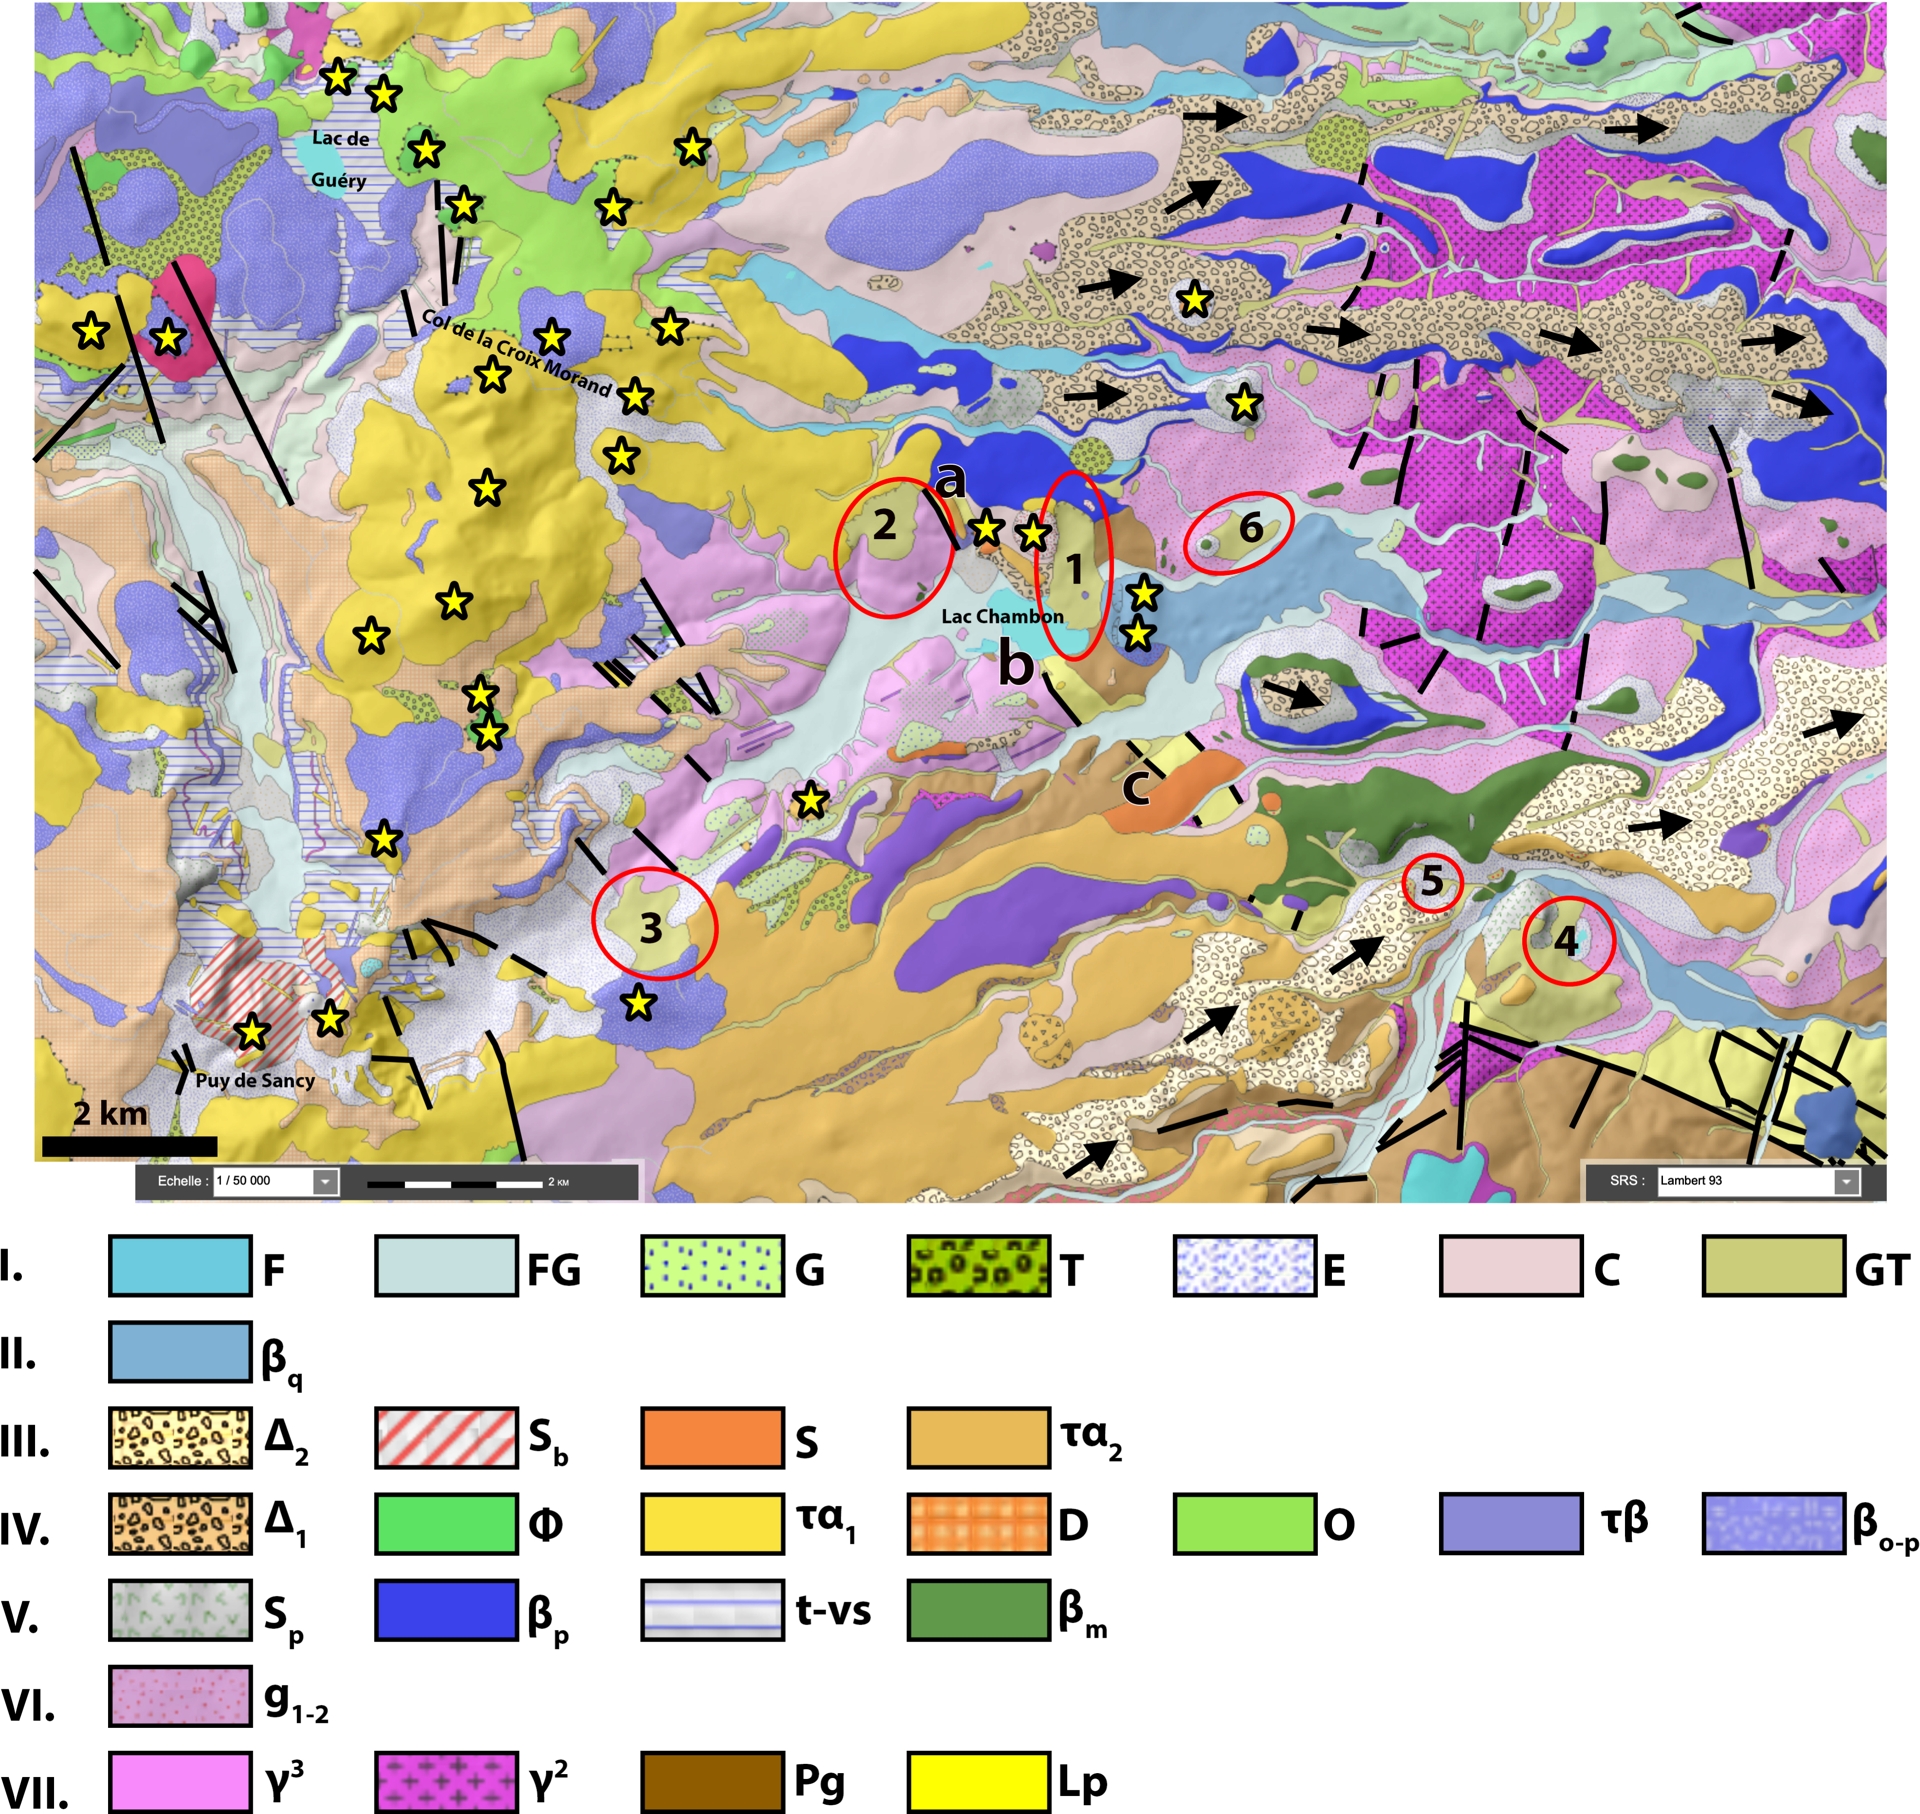
2.2. Geological framework
An initial analysis of the harmonized 1:50 000-scale geological map from the BRGM (ibid.) reveals the superposition of recent volcanic formations over an older granito-metamorphic basement. The main geological units identified in the study area are as follows:
- The two-mica granite of Chambon-sur-Lac constitutes the main plutonic unit of the region. Its precise boundaries remain uncertain, largely obscured by the overlying volcanic formations. It is nevertheless noteworthy that this pluton is cut by several normal faults striking N140–150°E in the area west of Lake Chambon.
- The metamorphic formations of the Upper Gneiss Unit (UGU) appear to the east of the Chambon granite. These are leptynitic gneisses that form the metamorphic country rock of the granite pluton. The contact between these two units is tectonic, marked by the Quancouve stream fault (QF), oriented N150°E. This fault appears to extend along two segments:
- Southward, along the northern flank of the Suc du Coq and near the hamlet of Jassat, where it is referred to as the Jassat Fault (JF).
- Further south, near Saint-Victor-la-Rivière, where it is referred to as the Saint-Victor-la-Rivière Fault (SVRF).
Observation of the geological map (Figure 2) suggests an apparent offset between segments QF, JF, and SVRF, which can be initially interpreted as the result of sinistral strike-slip movement along masked faults oriented N80–90°E. However, this interpretation remains hypothetical as long as the vertical displacement and the dip direction (eastward or westward) of the faults are not better constrained.
- Paragneisses of the Upper Gneiss Unit (UGU) (Pg) are also present south of the Tartaret volcano and in the southeastern corner of Lake Chambon.
- Trachyandesites (𝜏𝛼1), of Upper Pliocene to Lower Pleistocene age, form domes or dome–lava flow complexes, well developed between Puy de la Tache and Puy de l’Angle within the Adventive Massif west of Lake Chambon.
- Trachybasalts (𝜏𝛽) crop out west of Bressouleille, to the northwest of Lake Chambon.
- Undifferentiated basalts (𝛽p) are mapped around Beaune-le-Froid (north of Lake Chambon) and as basement units beneath Puy de Bessolles (east of Lake Chambon and the Tartaret volcano).
- Finally, north of Lake Chambon, debris-avalanche deposits (Δ2), referred to as the Fontenille deposits, are clearly identifiable. These deposits have been dated at approximately 1 Ma (Cantagrel and Briot, 1990; Vidal et al., 1996; Bernard et al., 2009).
The excerpt from the harmonized 1:50 000-scale geological map provides a synthetic representation of surface formations and structures, but it does not allow for a direct inference of the current stress state or ongoing deformation. The studied area, located within the crystalline basement of the Massif Central, is characterized by predominantly brittle deformation at the surface, expressed through dislocations, joints, and faults. These structures influence the organization of the topography, particularly the course of the drainage network, which responds sensitively to fracturing of the basement. In addition, the alignment and distribution of volcanic edifices provide indirect clues about the organization of deeper fault structures within the crust. Thus, morphostructural interpretation can offer complementary insights to those provided by conventional geological data (Hauchard et al., 2002).
2.3. Recent Quaternary geomorphological evolution
The morphostructural evolution of the Lake Chambon area results from a succession of major events, the consideration of which is essential for a proper understanding and interpretation of the geomorphological and seismotectonic data:
- The Chaudefour Valley, the Couze Surains Valley, as well as the downstream part of the Couze Chambon Valley as far as Sapchat, correspond to a former glacial valley exhibiting characteristic glacial landforms, including upstream glacial cirques, U-shaped valleys, and associated till deposits (Varlet, 1976; Goër de Hervé, 1992; Chèvremont et al., 2022).
- Glacial retreat promoted the development of postglacial gravitational deposits, including rockfall deposits, landslides, and debris flows, reflecting a phase of slope destabilization following deglaciation.
- In particular, 1.6 km south of Monneaux lies the large amphitheater of the Montagne de la Plate, developed on the southern flank of the Chaudefour Valley, 5 km upstream from Lake Chambon. This amphitheater was formed by two successive rock-slope failures (Goër de Hervé, 1992), respectively referred to as the “Paléo–Plate” and the “Néo–Plate”. The Néo–Plate landslide gave rise to a former landslide-dammed lake, known as Lake Monneaux, which is thought to have persisted during the period 8500–8000 BP (Macaire, Bossuet, Choquier, Corcita, de Luca, Dupis, Gay, Guenet, et al., 1994).
- The construction of the strombolian volcanic edifice of Tartaret, dated to approximately 12 500–12 600 years BP (Macaire, Corcita, et al., 1992; Vidal et al., 1996; Macaire, Bossuet, Choquier, Corcita, de Luca, Dupis, Gay, Mathey, et al., 1997), led to the formation of a volcanic-dammed lake, referred to as Lake Tartaret. This lake flooded the downstream part of the Chaudefour Valley as well as the present extent of Lake Chambon, before disappearing around 8500 years BP (Macaire, Bossuet, Choquier, Corcita, de Luca, Dupis, Gay, Mathey, et al., 1997) or 9500 years BP (Chapron et al., 2022).
- Lake Chambon formed following the collapse of the Dent du Marais, which occurred around 2600 years BP (Vidal et al., 1996) or around 2730 years BP ± 30 years (Chapron et al., 2022). Following this event, the lake initially reached a much larger extent, corresponding to approximately twice its present-day surface area.
- A second landslide of the Dent du Marais, identified by Chapron et al. (ibid.), is thought to have occurred around A.D. 1250 ± 30 years, contributing to the morphological reorganization of the basin in its northeastern part (Lake Lacassou).
2.4. Neotectonic framework
The site of Chambon-sur-Lac lies at the intersection of multiple tectonic influences:
- to the southwest, the continental collision between the Eurasian plate and the Iberian plate, which generates the Pyrenean mountain range;
- to the south, the push of the African plate toward the European plate in the Mediterranean region;
- to the southeast, the collision between the Eurasian plate and the Apulian plate, which gives rise to the Alpine range and possibly contributes to asthenospheric upwellings responsible for the rifting and volcanism of the Massif Central (Michon, 2000);
- and to the west and northwest, the uplift related to the Icelandic hotspot and the oceanic accretion along the North Atlantic Ridge.
A major synthesis of the stress state, crustal deformation, and seismicity in metropolitan France was published by Mazotti et al. (2020). Figure 1 shows the potential seismogenic faults in metropolitan France in relation to the observed seismicity. While regions such as the Alps, the Pyrenees, Brittany, or the Rhine Graben show seismicity that can be easily linked to regional fault systems, this is not the case for the Massif Central. For instance, it may be tempting to extrapolate one of the branches of the South Armorican Shear Zone southeastward across the Massif Central via the Murol–Brioude–Le Puy fault.
The currently active stress field in France, particularly in the Massif Central, is fairly well known (Figure 3), and some general trends emerge regarding the preferential directions of active faults (Godefroy and Lambert, 1984; Dorel et al., 1995; Chassiot et al., 2016):
Map of the stress state in metropolitan France. Red lines indicate the directions of maximum horizontal stress (Mazotti et al., 2020).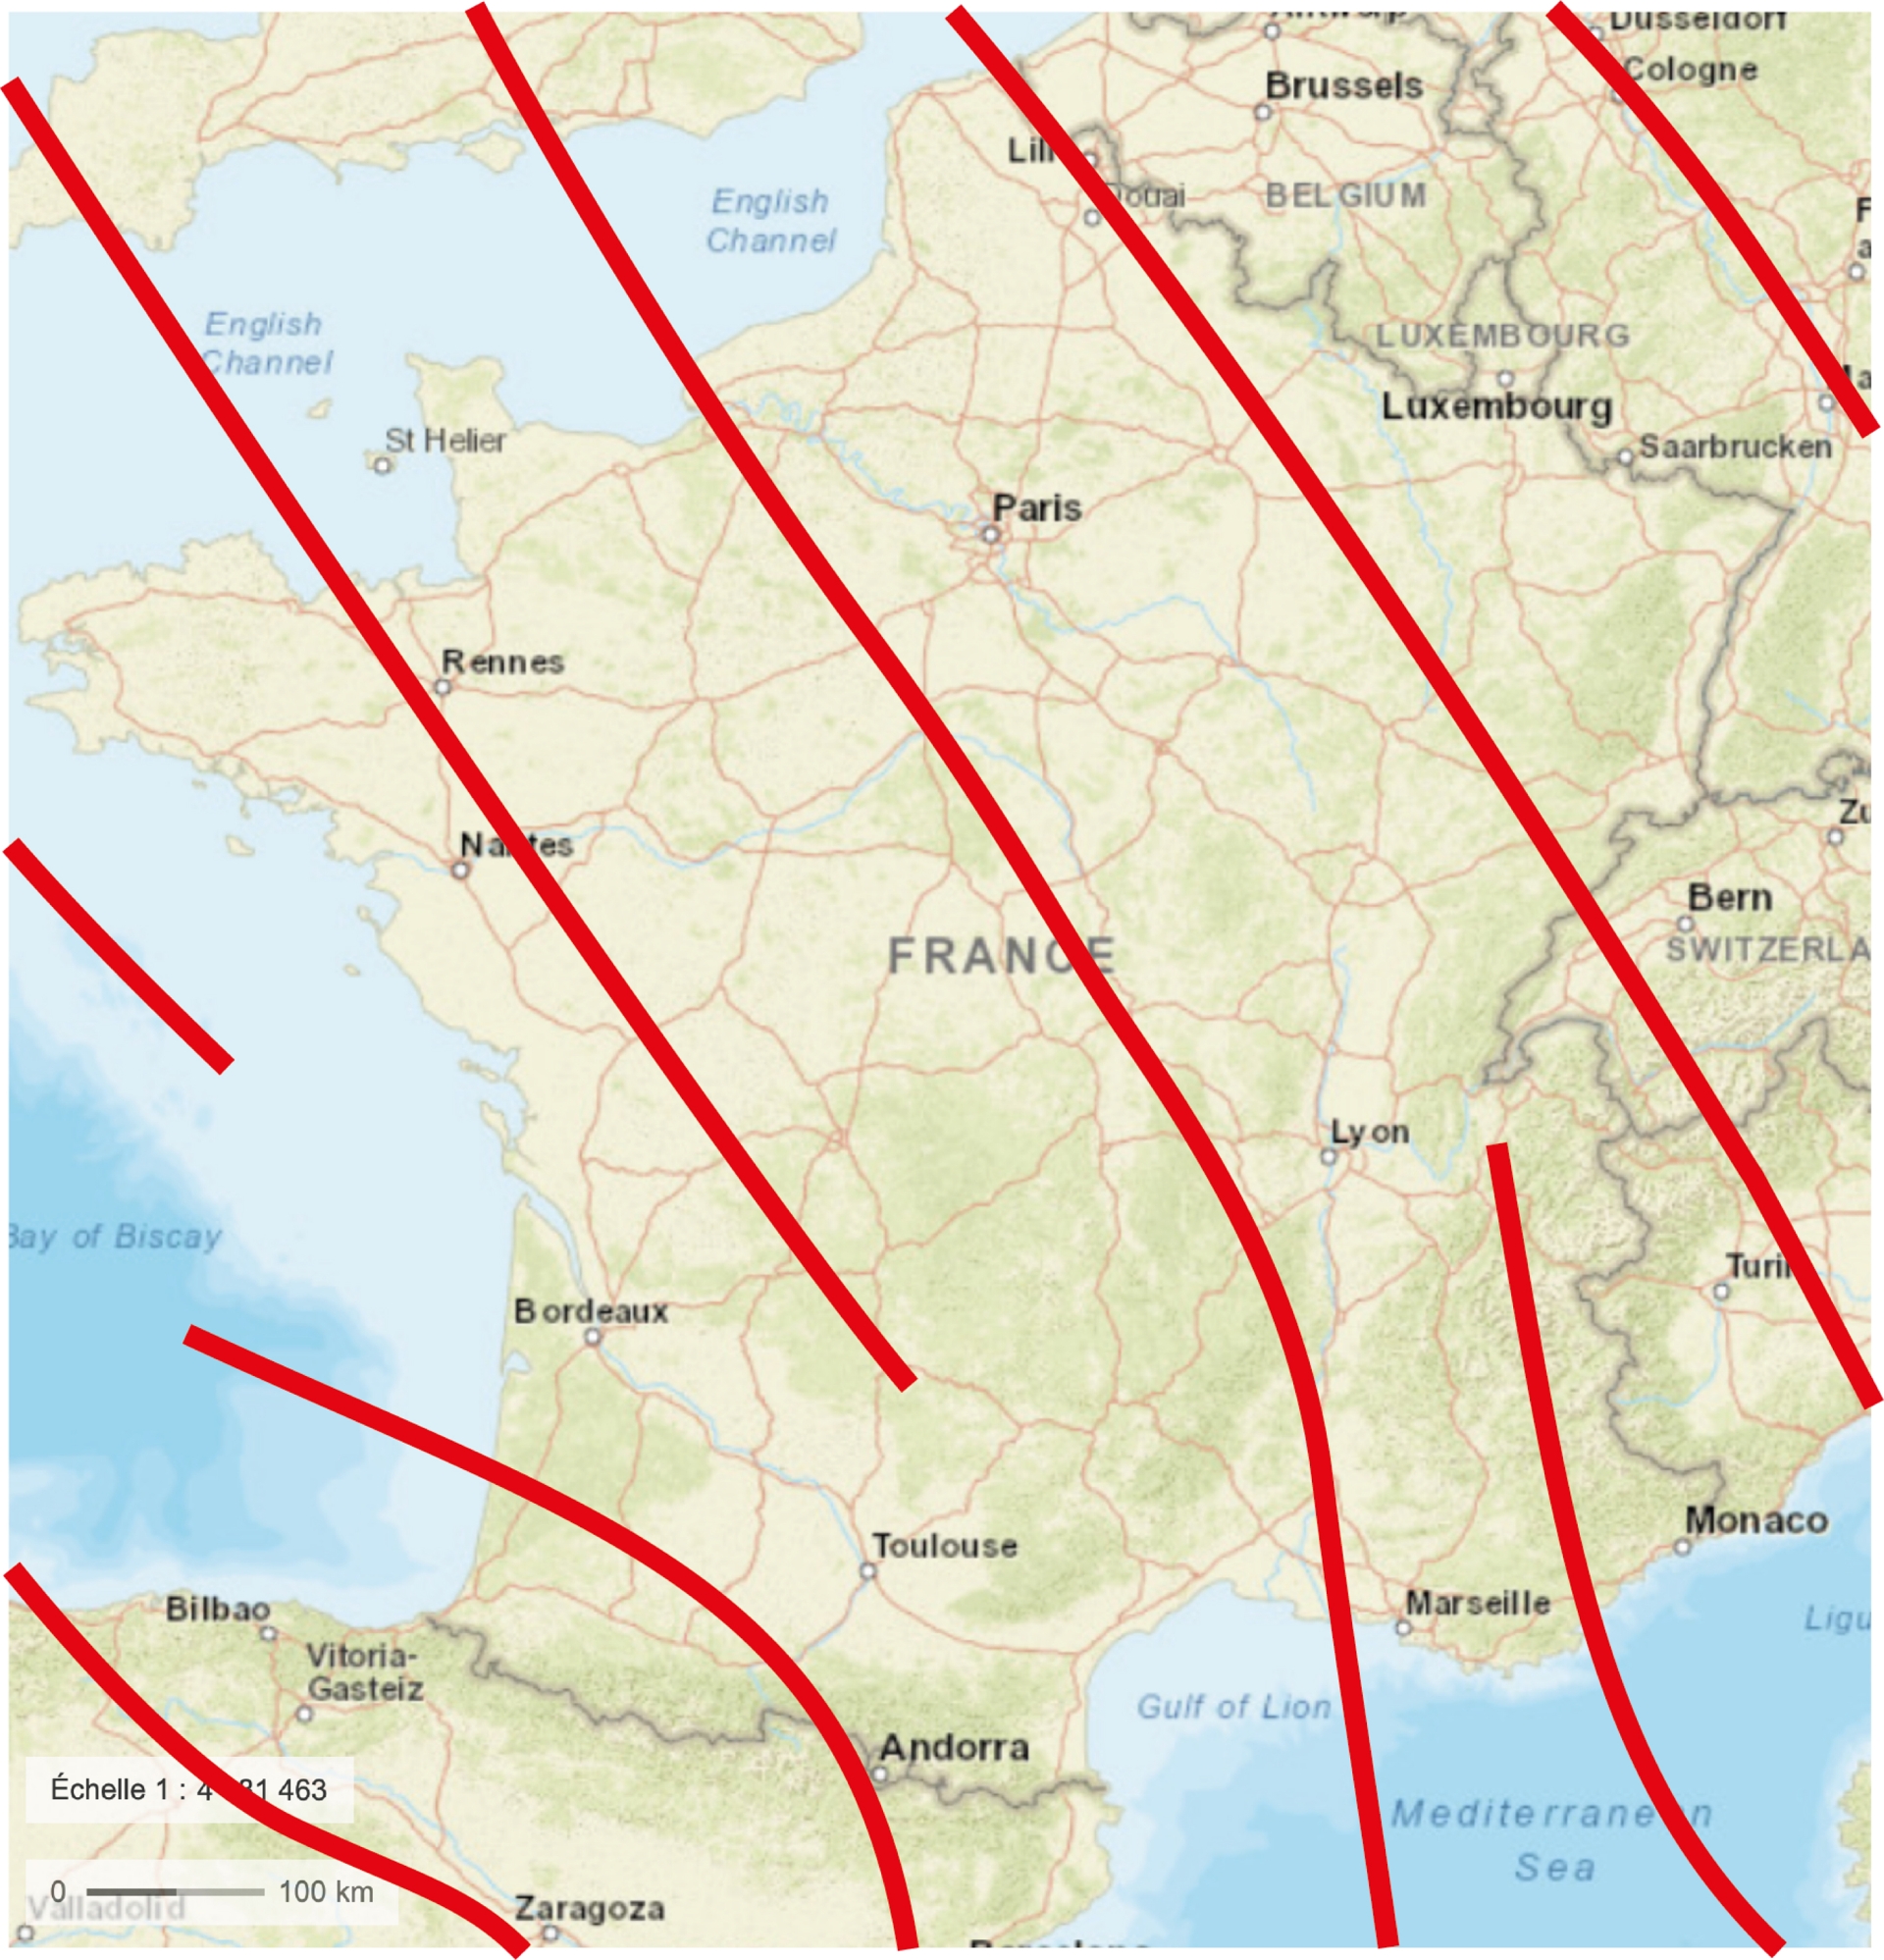
- the north–south trend corresponds to that of the Western Border Limagne Fault (WBLF), which was mainly active during the Oligocene but whose activity continues to the present day. This N–S trend also characterizes the faults that likely facilitated magma ascent within the Monts Dore Massif, in relation to the E–W extension of the massif and the likewise N–S arrangement of the two superposed calderas above former magma chambers.
- the N–S trend is close to that of the Sillon Houiller Fault (SHF), located approximately 25 km west of Chambon-sur-Lac, whose present-day kinematics are interpreted as sinistral strike-slip along a N20°E direction.
- Associated with the Sillon Houiller Fault is the Tauves–Aigueperse Fault (TAF), striking N50°E, of sinistral strike-slip type, and located only about 15 km west of the study area.
- the NW–SE trend extends the major South Armorican Shear Zones (SASZ), which for the most part currently operate as dextral shear zones (Palumbo, 2012).
To date, the structural geology of the area remains poorly documented in detail. The forthcoming explanatory note of the 1:50 000 geological map of the Veyre–Monton sheet (Chèvremont et al., 2022) does not include a chapter specifically devoted to tectonic structures. Only a limited number of faults have been mapped in this sector (Figure 2), and many of them are concealed by volcanic or sedimentary formations.
A more comprehensive compilation of structural data (Figure 4) was carried out using the OGC WFS services provided by the BRGM. When visualized in QGIS, these data reveal a clear predominance of NW–SE–oriented faults, striking between N120°E and N130°E. N–S–trending faults, such as the Western Border Limagne Fault, are less well represented.
Geological map displayed in QGIS over the digital elevation model (DEM) provided by the French National Geographic Institute (IGN). The map covers an area extending from the Monts Dore Massif to Brioude. Black lines represent faults, either ancient or active, catalogued by the WFS service “FR BRGM 1:1M Surface Geologic Faults”, and geological units are provided by the WFS service “FR BRGM 1:1M Surface Geologic Units Age”. The red box outlines the study area addressed in this article. 1: Lake Chambon. 2: Haute–Dordogne caldera. 3: Sancy caldera. 4: Chaîne des Puys. 5: Limagne Graben. 6: Lake Aydat. 7: Lake Pavin. 8: Lake Chauvet. 9: Lake Montcineyre. 10: Lake d’En Haut (La Godivelle). 11: Brioude. SBLF: Southern Border Fault of the Limagne Graben. WBLF: Western Border Fault of the Limagne Graben. SHF: Sillon Houiller Fault. TAF: Tauves–Aigueperse Fault.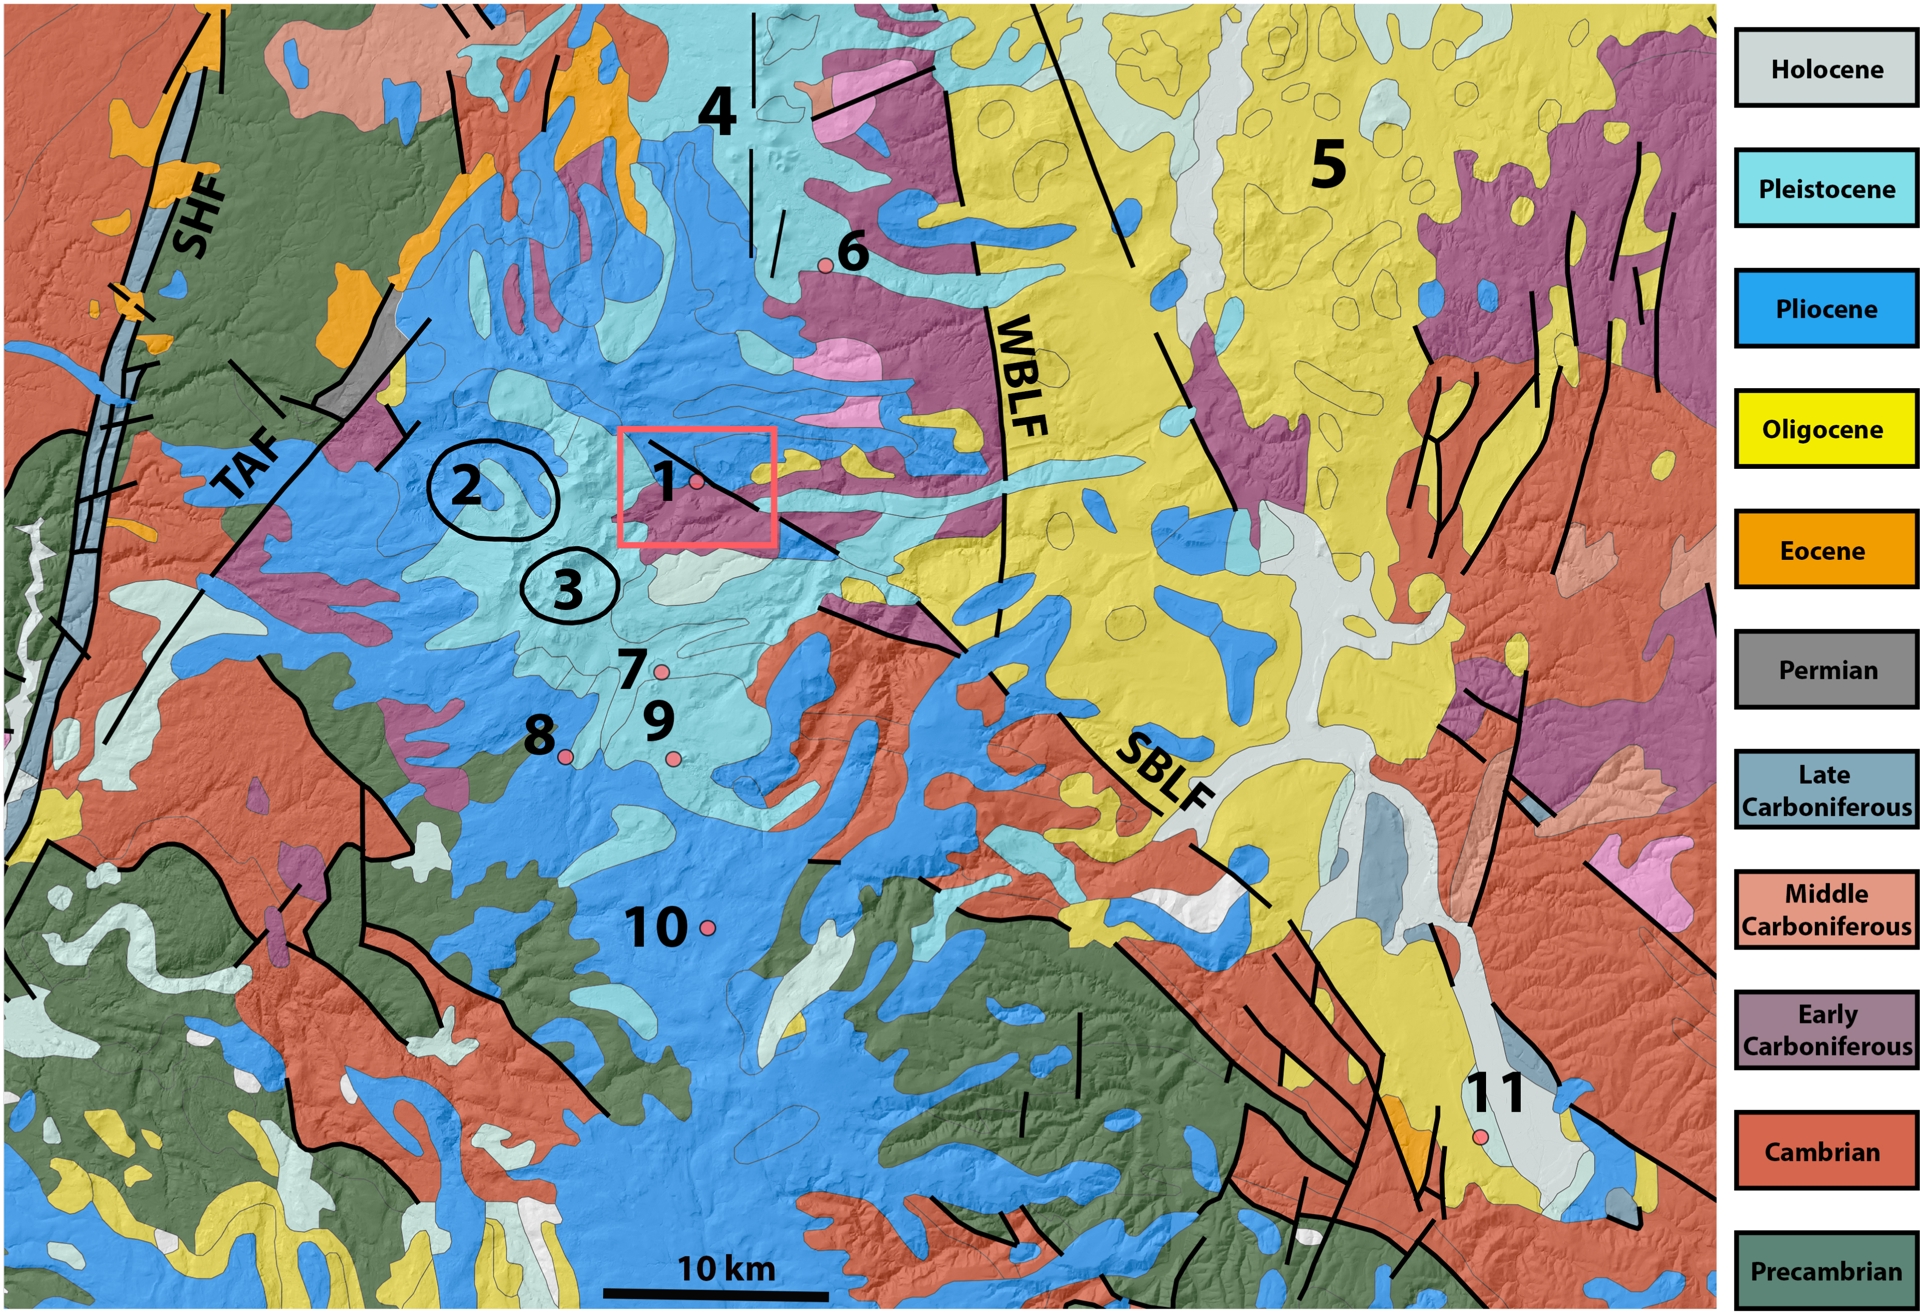
Accordingly, the Chambon-sur-Lac region appears to be part of a NW–SE fault system, with a preferred orientation ranging from N110°E to N130°E, extending between the Monts Dore and Brioude and trending toward Le Puy–en–Velay. This trend is corroborated by the map in Figure 5, which locates the epicenters of several historical earthquakes. These seismic foci clearly align along a NW–SE direction. Epicentral intensities are reported in Table 1, which lists eight earthquakes over a relatively short period of approximately 90 years (from 1833 to 1921), to which a more recent event, occurring in 1980 at the Croix–Morand Pass, can be added.
Map of historical earthquakes since 1833. Epicentral intensity, expressed according to the MSK scale, is represented by the color and size of the symbols (source: BRGM, InfoTerre portal). The shaded bands delineate the main regional seismogenic corridors: a dominant corridor trending N110°E, associated with the Croix–Morand–Murol Fault (CMF) and the southern border fault of the Limagne Graben (SBLF), and a secondary corridor following the Couze Pavin and Couze Chambon Valleys, oriented approximately E–W (N90°E), interpreted as structurally connected to the main seismogenic system. Yellow arrows indicate the sense of relative displacement of the fault blocks along the main dextral strike–slip structures. WBLF corresponds to the western border fault of the Limagne Graben. Fault traces are extracted from the BRGM database “FR BRGM 1:1M Surface Geologic Faults”.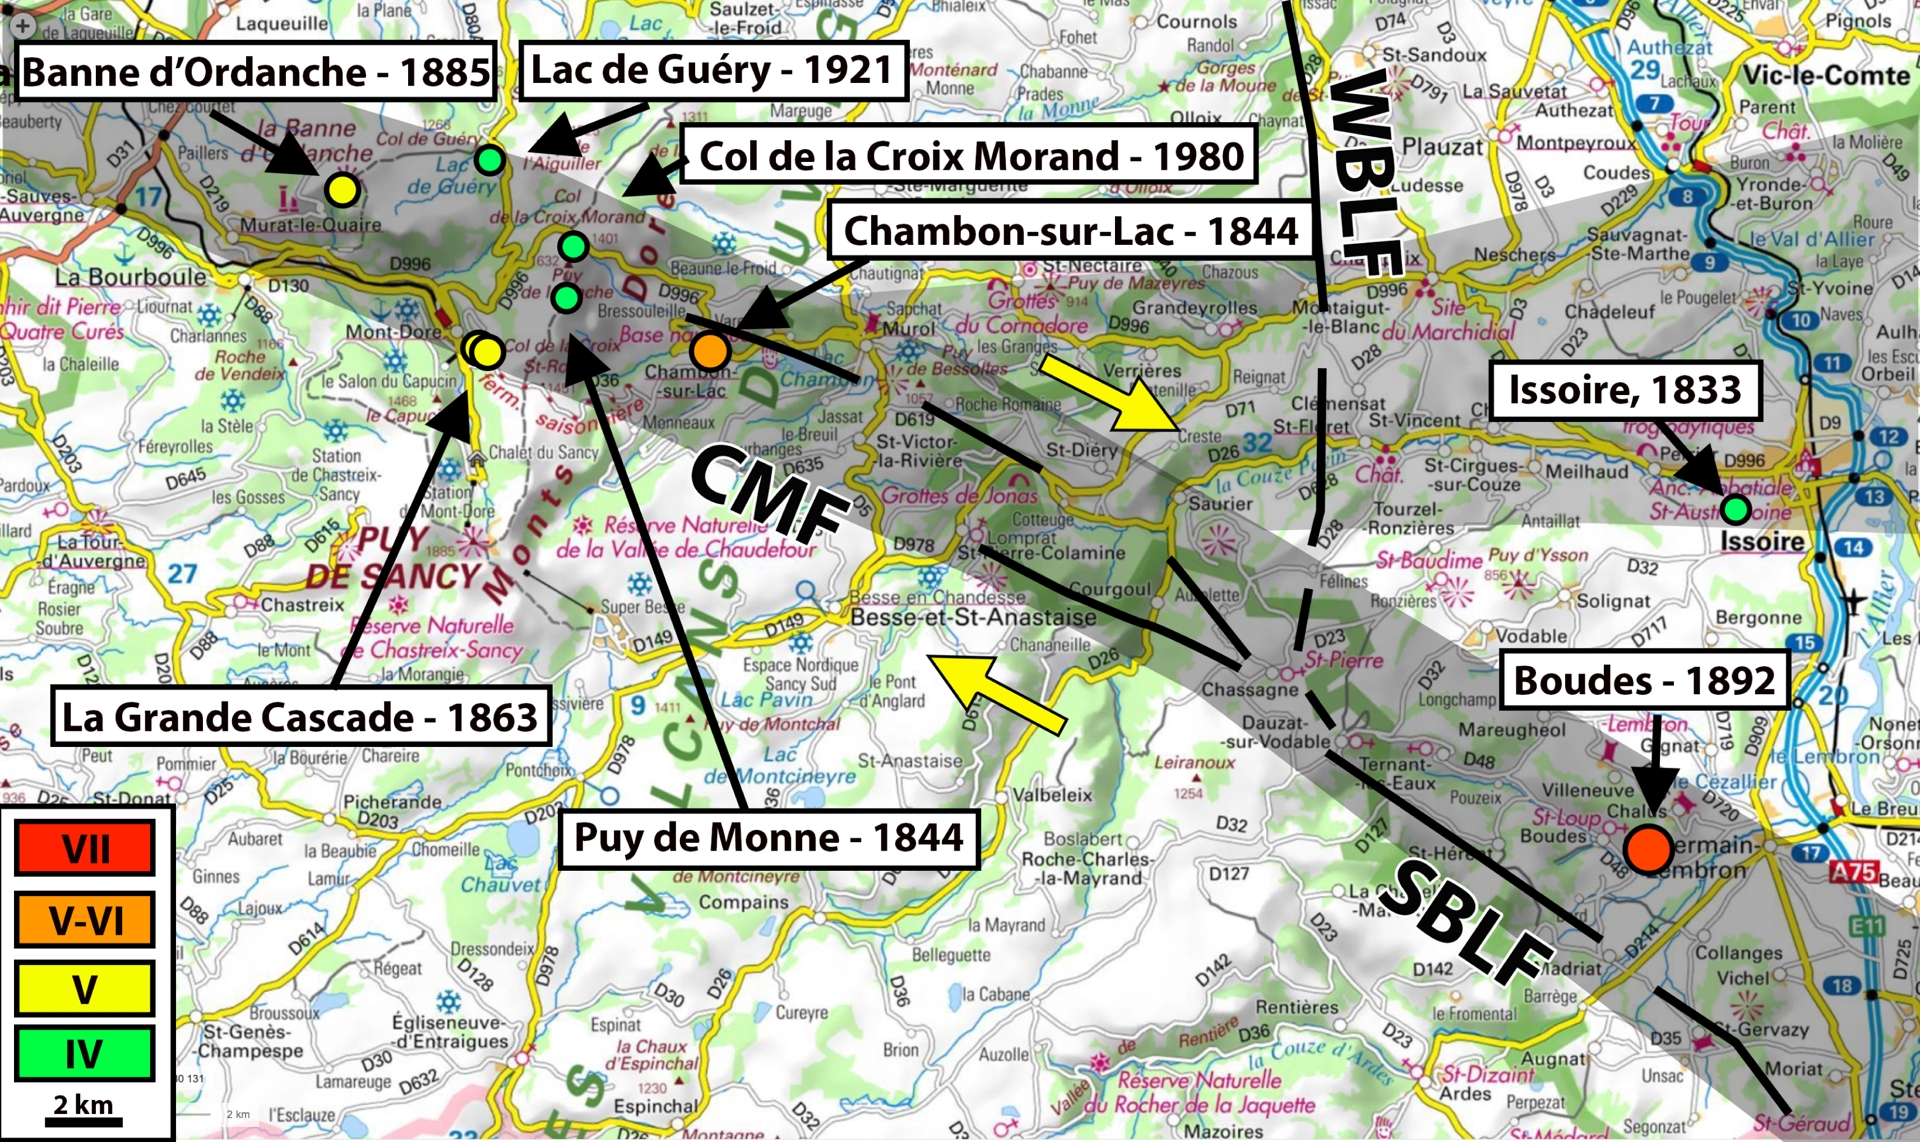
Historical earthquakes in the study area
| Location | Date–time | I |
|---|---|---|
| Issoire | 10/15/1833 | IV |
| (21) | 23:00 | |
| Puy de Monne | 01/01/1844 | IV |
| (6.1) | 10:00 | |
| Chambon-sur-Lac | 01/03/1844 | V–VI |
| 23:00 | ||
| La Grande Cascade | 09/18/1863 | V |
| (8) | 18:20 | |
| La Grande Cascade | 09/18/1863 | V |
| (8) | 19:15 | |
| La Banne d’Ordanche | 10/11/1885 | V |
| (12.5) | 14:06 | |
| Boudes | 08/26/1892 | VII |
| (24) | 10:10 | |
| Lac du Guéry | 05/24/1921 | IV–V |
| (9.2) | 03:52 | |
| Col de la Croix–Morand | 04/01/1980 | IV |
| (6.5) | 01:24 |
I denotes the epicentral intensity (MSK). The number in parentheses indicates the distance in kilometers between the epicenter and Lake Chambon.
In addition to the main NW–SE seismogenic corridor, the Couze Pavin and Couze Chambon valleys may also represent a secondary seismogenic zone, as suggested by the widespread occurrence of rockfalls and landslides along these valleys, although not all can be unequivocally attributed to seismic triggering (Vidal et al., 1996). While fluvial reorganizations were strongly influenced by debris avalanches (Pastre et al., 1997), their recurrence within a structurally controlled corridor suggests that seismic activity may have acted as a long-term preconditioning factor.
This historical seismicity fits within the broader framework of active deformation in the Massif Central, where Quaternary seismites in the Limagne basin record major seismic crises during the Late Boreal and the Middle Ages (Vernet, 2013; Chassiot et al., 2016; Chapron et al., 2022). The high density of mantle-derived CO2 emissions along this seismogenic corridor (Varet, Stieltjes, Gadalia, et al., 1977; Ricci et al., 2024) further supports the presence of a major N110°–130°E crustal fault zone east of the Monts Dore massif.
3. Methodology
3.1. The digital elevation model
The first step of the work consisted in selecting a Digital Elevation Model (DEM) with optimal resolution. For this purpose, open-access data provided by the Centre Régional Auvergne-Rhône-Alpes de l’Information Géographique (CRAIG) were used (CRAIG, 2025).
Initially, the “Puy-de-Dôme” DEM, with a 10-meter resolution, produced by the TopoGeodis company for CRAIG, was selected. This dataset, available in the form of 3978 tiles via the CRAIG platform (ibid.), was assembled using the QGIS software and tools from the GDAL library, including the “gdal_merge” and “gdaldem” commands, following the methodology described in Thiéry (2022).
A raster layer entitled “Shaded Relief of Auvergne,” also available from the CRAIG platform, was used due to its high visual quality (CRAIG, 2025). Although its resolution is officially stated as 10 m per pixel, the fine detail visible in the image suggests a higher effective resolution. Verifications confirmed that this layer was produced from the RGE Alti 3D digital elevation model of the French National Geographic Institute (IGN), which has a resolution of 5 m.
All data were processed using the IGNF LAMB93 coordinate reference system. The geographical accuracy of the DEM was checked by overlaying it with topographic landmarks visible on IGN map backgrounds.
3.2. Lineament identification
In order to interpret tectonic structures from the topography, a mapping of the visible lineaments on the Digital Elevation Model (DEM) was carried out by manually digitizing segments in the Geographic Information System QGIS. This mapping is based on a set of morphostructural criteria that we systematically applied to identify the lineaments:
- traces of present-day valleys, especially when the hydrographic network includes straight segments interrupted by abrupt changes in orientation;
- presence of well-expressed linear escarpments, resulting from differential erosion probably marking a tectonic contact between lithological units of contrasting resistance;
- alignment of volcanic eruptive centers that are close to each other;
- direction of volcanic lava flows, insofar as these generally follow structural valleys often guided by faults;
- presence of dykes recognizable at the surface.
The 527 identified lineaments were vectorized as segments and recorded in a georeferenced GeoPackage layer. The associated attribute table, including metadata and descriptive information, is provided as Supplementary Material.
4. Lineaments
The lineament map is shown in Figure 6.
Map of digitized lineaments (in red) superimposed on the digital elevation model (DEM) of the study area. Colored dots correspond to the epicenters of recent historical earthquakes, as presented in Figure 5. Numbers refer to the locations of the sites listed in Table 5.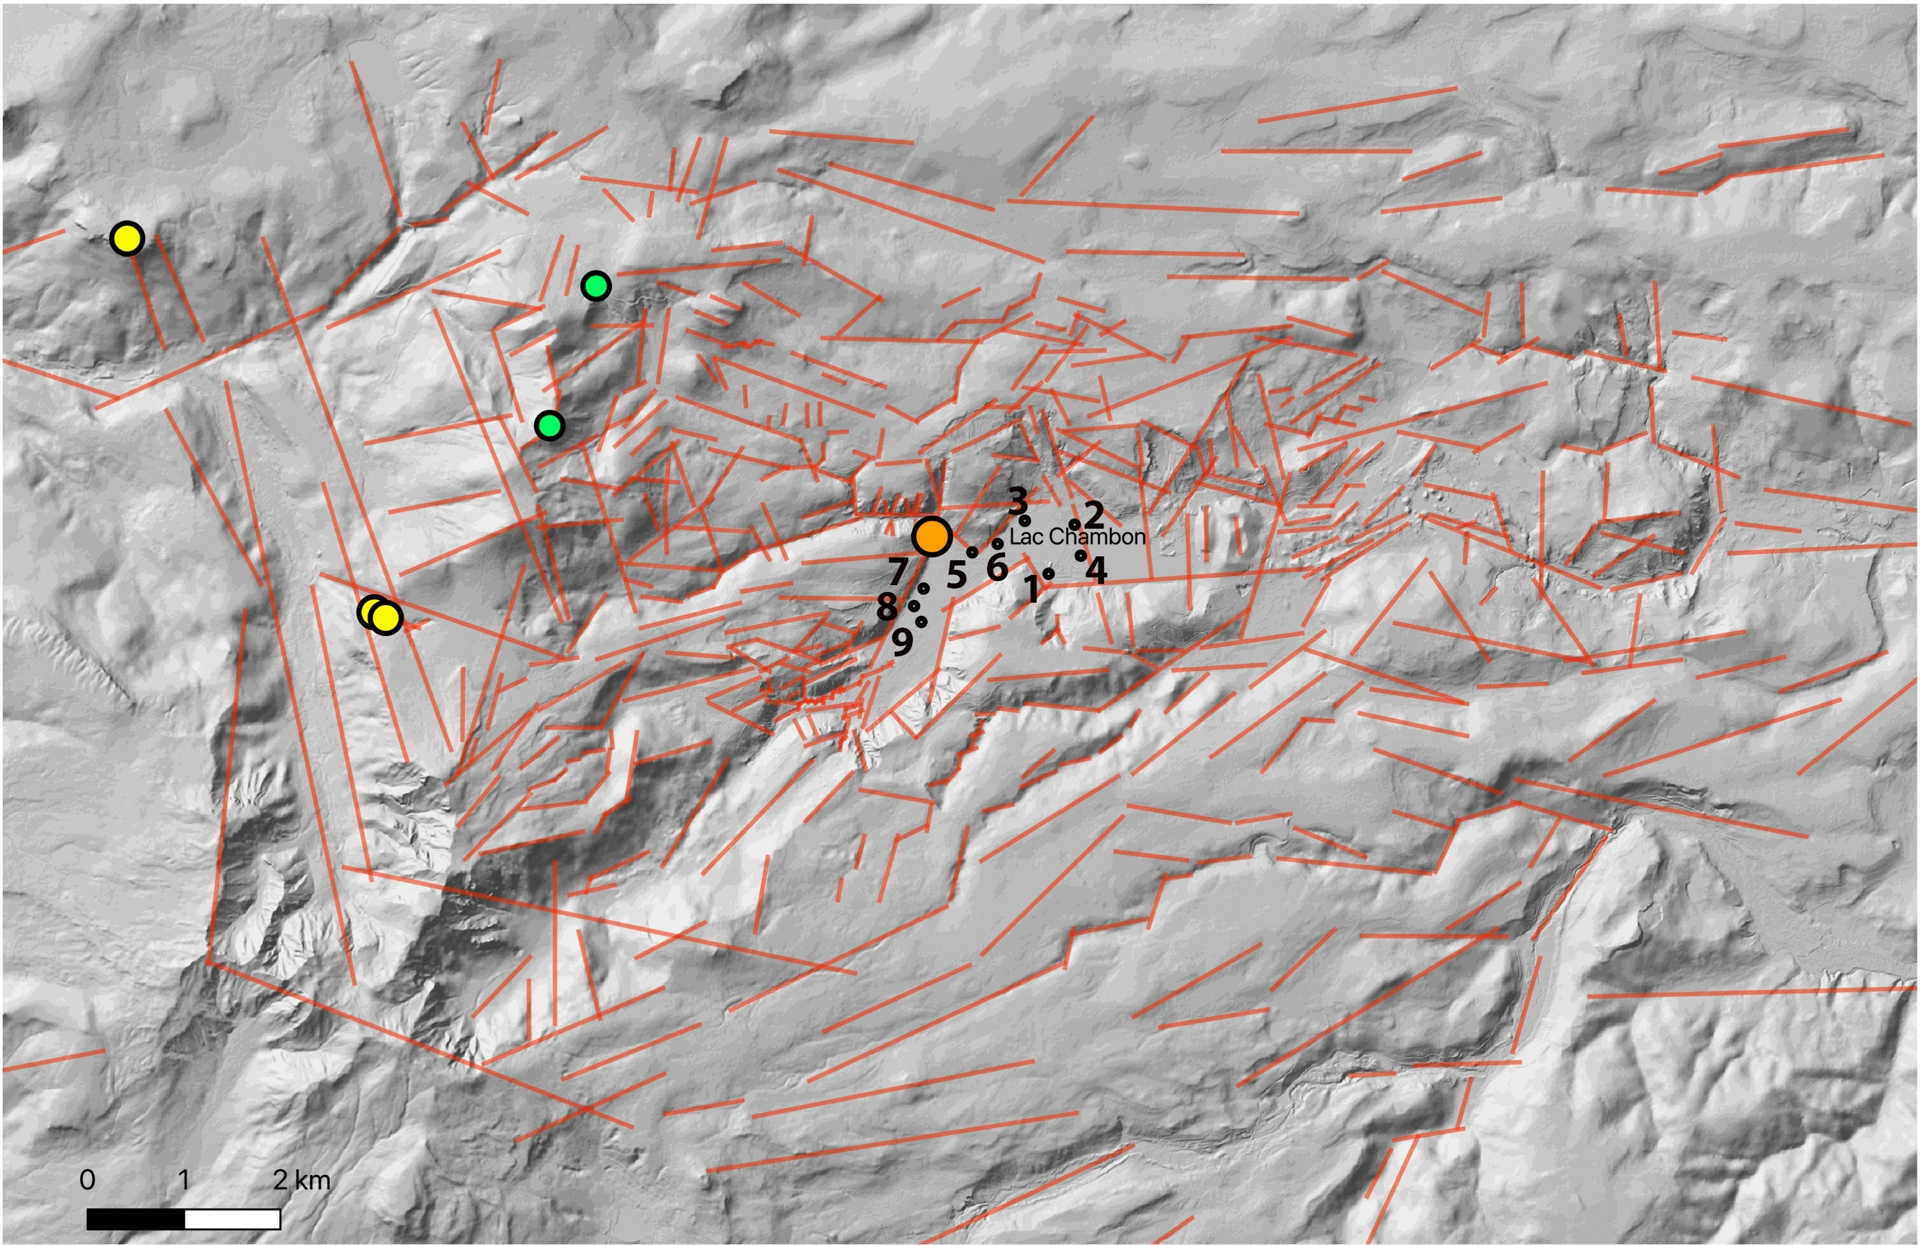
4.1. Data analysis
The Length and Azimuth attributes of the attribute table were subjected to statistical analysis using data processing methods. Only the results concerning the azimuth are presented here; those related to length are available in the Supplementary Material.
The azimuth histogram is shown in Figure 7. The corresponding frequency table is provided in Table 2. Additionally, a rose diagram (Figure 8) was produced using the Line Direction Histogram plugin developed for QGIS by Tveite (2015).
Histogram of the azimuths of lineaments.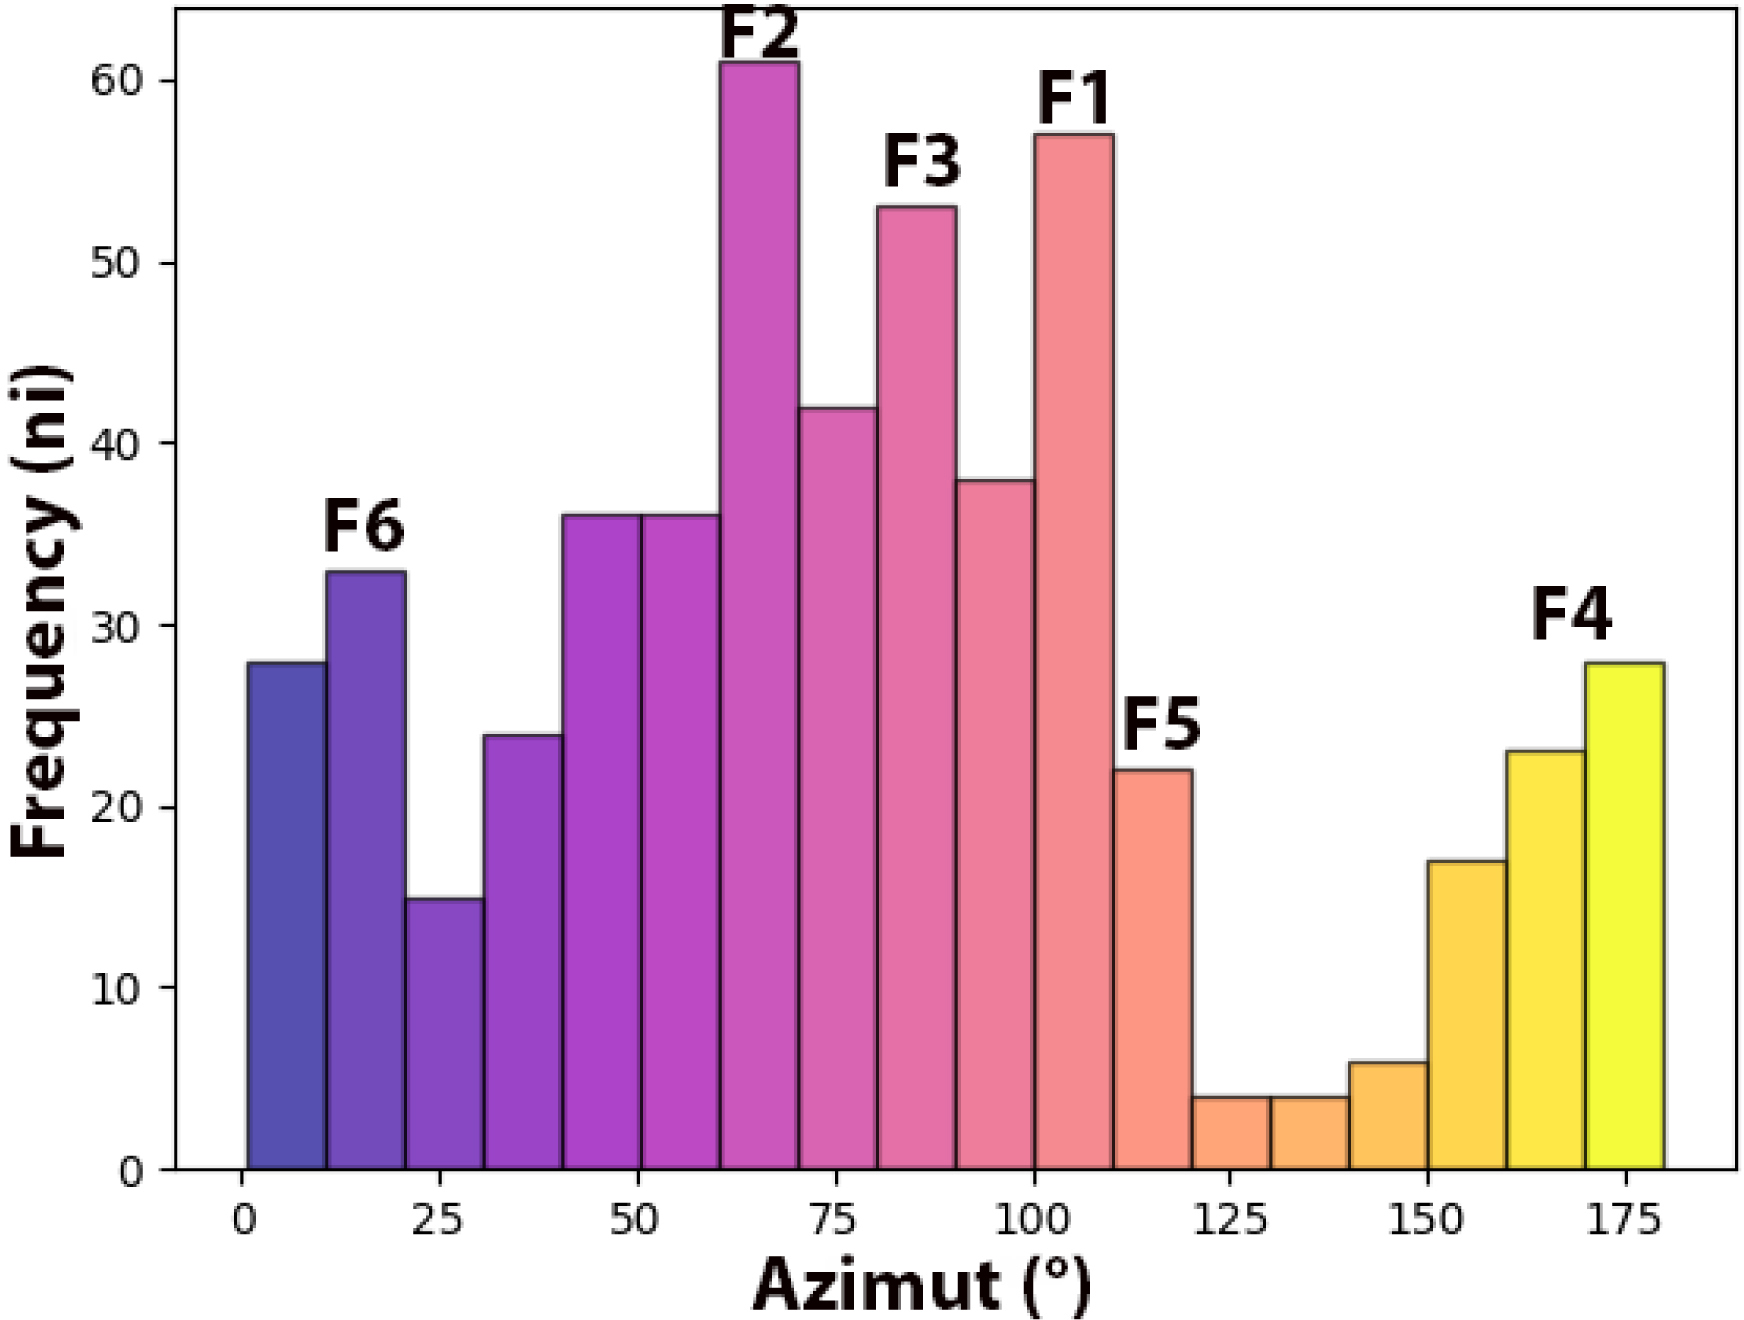
Rose diagram of the directions of lineaments.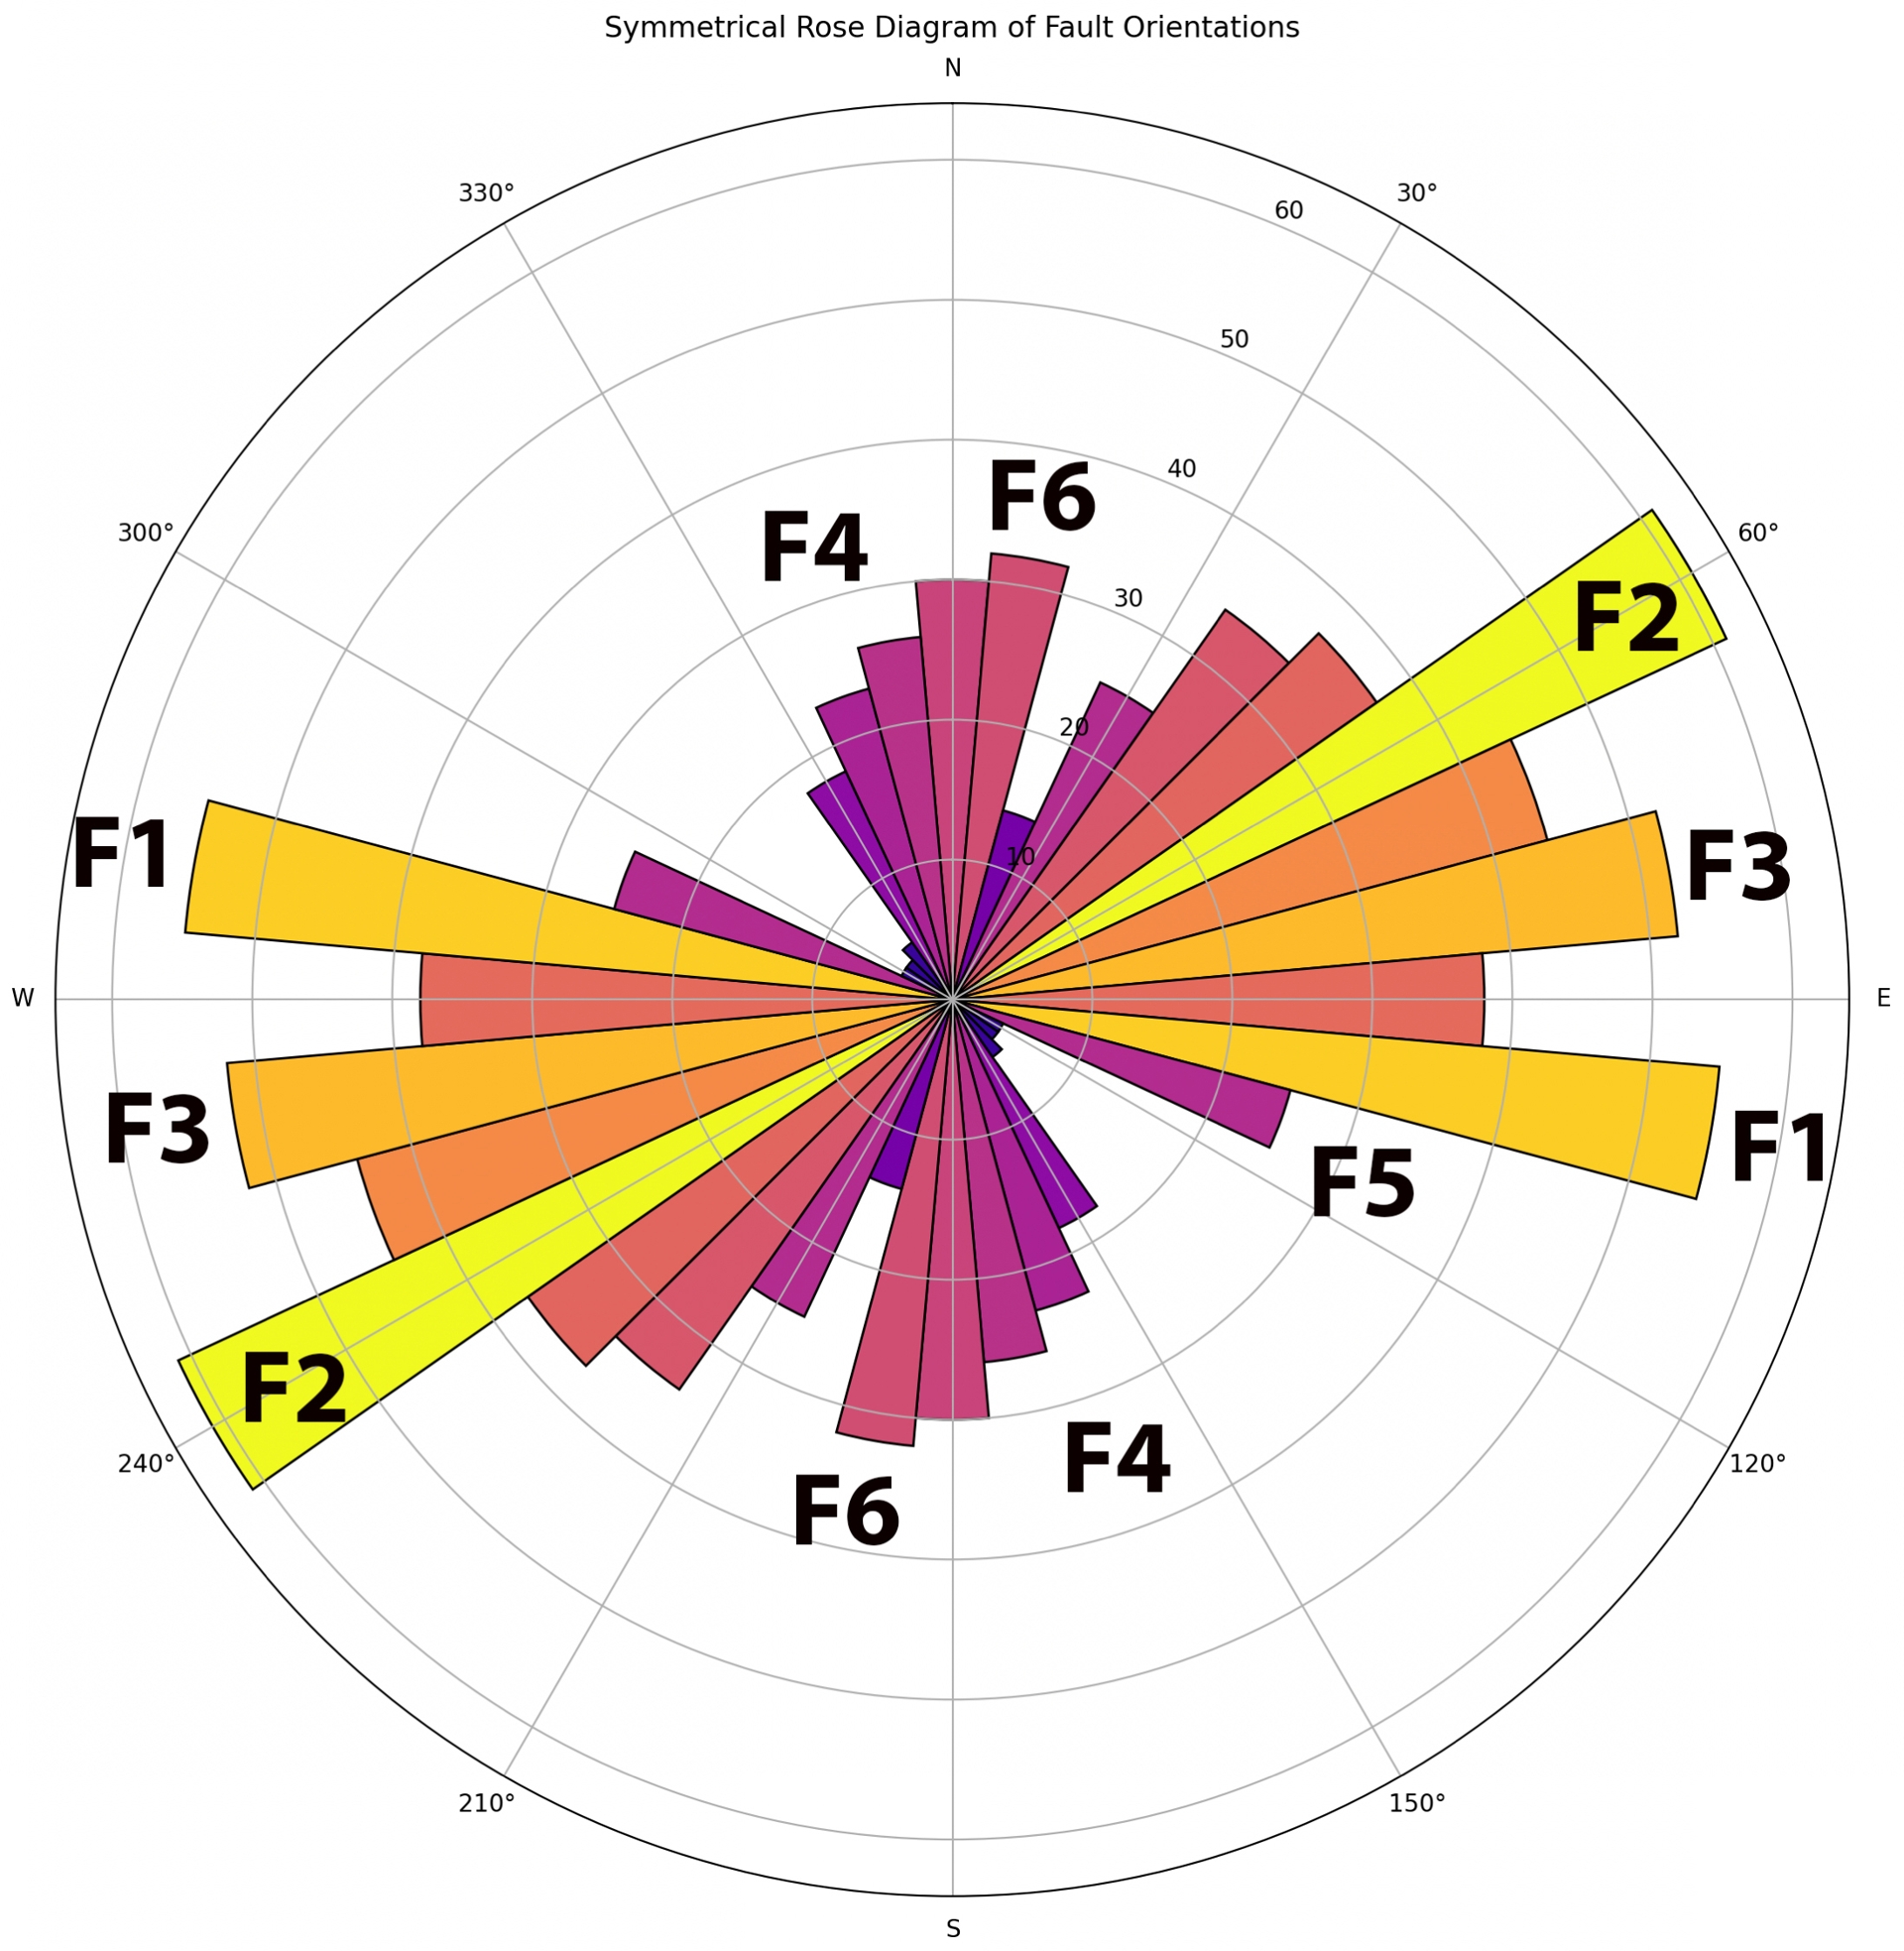
Distribution of azimuths in classes Ai with absolute frequencies ni and relative frequencies fi in %
| A | ni | fi | Family |
|---|---|---|---|
| [0, 10[ | 28 | 5.31 | F6 |
| [10, 20[ | 32 | 6.07 | F6 |
| [20, 30[ | 14 | 2.66 | |
| [30, 40[ | 25 | 4.74 | |
| [40, 50[ | 34 | 6.45 | |
| [50, 60[ | 37 | 7.02 | |
| [60, 70[ | 61 | 11.57 | F2 |
| [70, 80[ | 44 | 8.35 | |
| [80, 90[ | 52 | 9.87 | F3 |
| [90, 100[ | 38 | 7.21 | |
| [100, 110[ | 55 | 10.44 | F1 |
| [110, 120[ | 25 | 4.74 | F5 |
| [120, 130[ | 4 | 0.76 | |
| [130, 140[ | 4 | 0.76 | |
| [140, 150[ | 5 | 0.95 | |
| [150, 160[ | 18 | 3.42 | |
| [160, 170[ | 23 | 4.36 | F4 |
| [170, 180[ | 28 | 5.31 | F4 |
| Total | 527 | 100 |
The analysis of the lineament azimuths is of particular interest, as it provides insight into the orientation of the stress field and the nature of brittle deformation (Figure 8).
Six major fracture directions can be distinguished (Tables 2 and 3). In decreasing order of importance, they are distributed as follows:
Summary of fault families and their interpretation within the Riedel shear model framework, for 𝜎1 = N170°E
| a | b | c |
|---|---|---|
| F1 | 100–110° | Main shear |
| F2 | 60–70° | Inherited faults |
| F3 | 80–90° | P |
| F4 | 170–180° | T |
| F5 | 110–120° | R |
| F6 | 0–20° | R′ |
Column (a): fault family; column (b): orientation (azimuth) in °; column (c): interpretation (Riedel model).
- A direction ranging from N100°E to N110°, corresponding to a WNW–ESE orientation, well illustrated by the axis of the Dordogne Valley between Le Mont-Dore and Saint-Sauves-d’Auvergne. This family of faults is designated as F1.
- A direction from N60°E to N70°E (WSW–ENE), notably represented by the orientation of the upper part of the Couze de Chaudefour. These structures are grouped into family F2.
- A direction close to N80°E to N90°E, i.e., an E–W orientation, corresponding to fault family F3.
- A direction between N160°E and N180°, that is, an almost north–south orientation, illustrated for instance by the fractures bordering the Monts Dore calderas. These faults belong to family F4.
- A direction from N110°E to N120°, which is distinguished from family F1 by its dispersion and geometric relationships with other systems; it constitutes family F5.
- Finally, a direction from N0°E to N20°, corresponding to fault family F6.
4.2. Discussion
The identification and analysis of lineaments may be affected by several sources of bias:
- Non-tectonic origin of lineaments—Some lineaments may result from anthropogenic features (e.g., road cuttings) rather than tectonic structures. However, the impact of this bias is considered negligible. If necessary, it can be reduced by verification using high-resolution aerial imagery.
- Overrepresentation of lineaments well individualized by erosion—Lineaments highlighted by erosion processes may be overrepresented in the database. This situation is particularly plausible on the eastern slope of the Monts Dore, where the west–east oriented slope aligns with volcanic flow directions and gravitational, glacial, and fluvial erosion dynamics.
- Influence of geological substrate on lineament density—The apparent density of lineaments may vary according to outcropping lithologies. Volcanic flows may mask underlying basement structures, whereas granitic formations provide excellent tracers of brittle deformation. This bias is however mitigated by the fact that volcanic flows themselves are often guided by pre-existing tectonic structures in the basement.
- Lack of weighting by lineament length—In the statistical processing, each lineament is taken into account with equal weight regardless of its length. A more rigorous approach would be to weight the data according to lineament length, which could be implemented in future analyses. Nevertheless, it is likely that this simplification has limited impact on the results, as the directions of short structures generally represent those of the major regional faults.
4.3. Interpretation according to the riedel shear model
Given the current state of knowledge regarding the stress regime affecting metropolitan France (Figure 3), it is possible to propose a neotectonic model capable of explaining the distribution of lineament orientations observed in the eastern part of the Monts Dore Massif. The principal stress 𝜎1, oriented approximately N160°E–170°E (Mazotti et al., 2020), suggests that faults with the same orientation (F4 family) correspond to faults currently undergoing extension. This interpretation is further supported by the observation that most eruptive centers of Monts Dore volcanism, as well as subsequent volcanic activity, are aligned along these structures (e.g., the Monts Dore calderas, the Dent du Marais volcano, the Tartaret volcano, etc.). The region would therefore be subjected to a WNW–ESE–oriented extensional tectonic regime (Dorel et al., 1995).
Nevertheless, a model based solely on pure flattening does not suffice to explain the presence of fault families F1, F2, F3, and F5, whose orientations are oblique with respect to the main stress axis 𝜎1. These orientations suggest the superposition of a simple shear regime, which must be considered in order to account for the full range of observed fault directions.
The proposed model is illustrated in Figure 9. It consists of a system of dextral shear bands oriented according to the direction of the main F1 faults, which correspond to an eastern continuation of the Cholet–Poitiers Fault within the South Armorican Shear Zone, with associated secondary faults consistent with the classical Riedel shear model (Tchalenko, 1970).
Interpretative attempt of the lineament directions. (a) The different fault families superimposed on the rose diagram of lineament orientations. (b) The simple dextral shear model.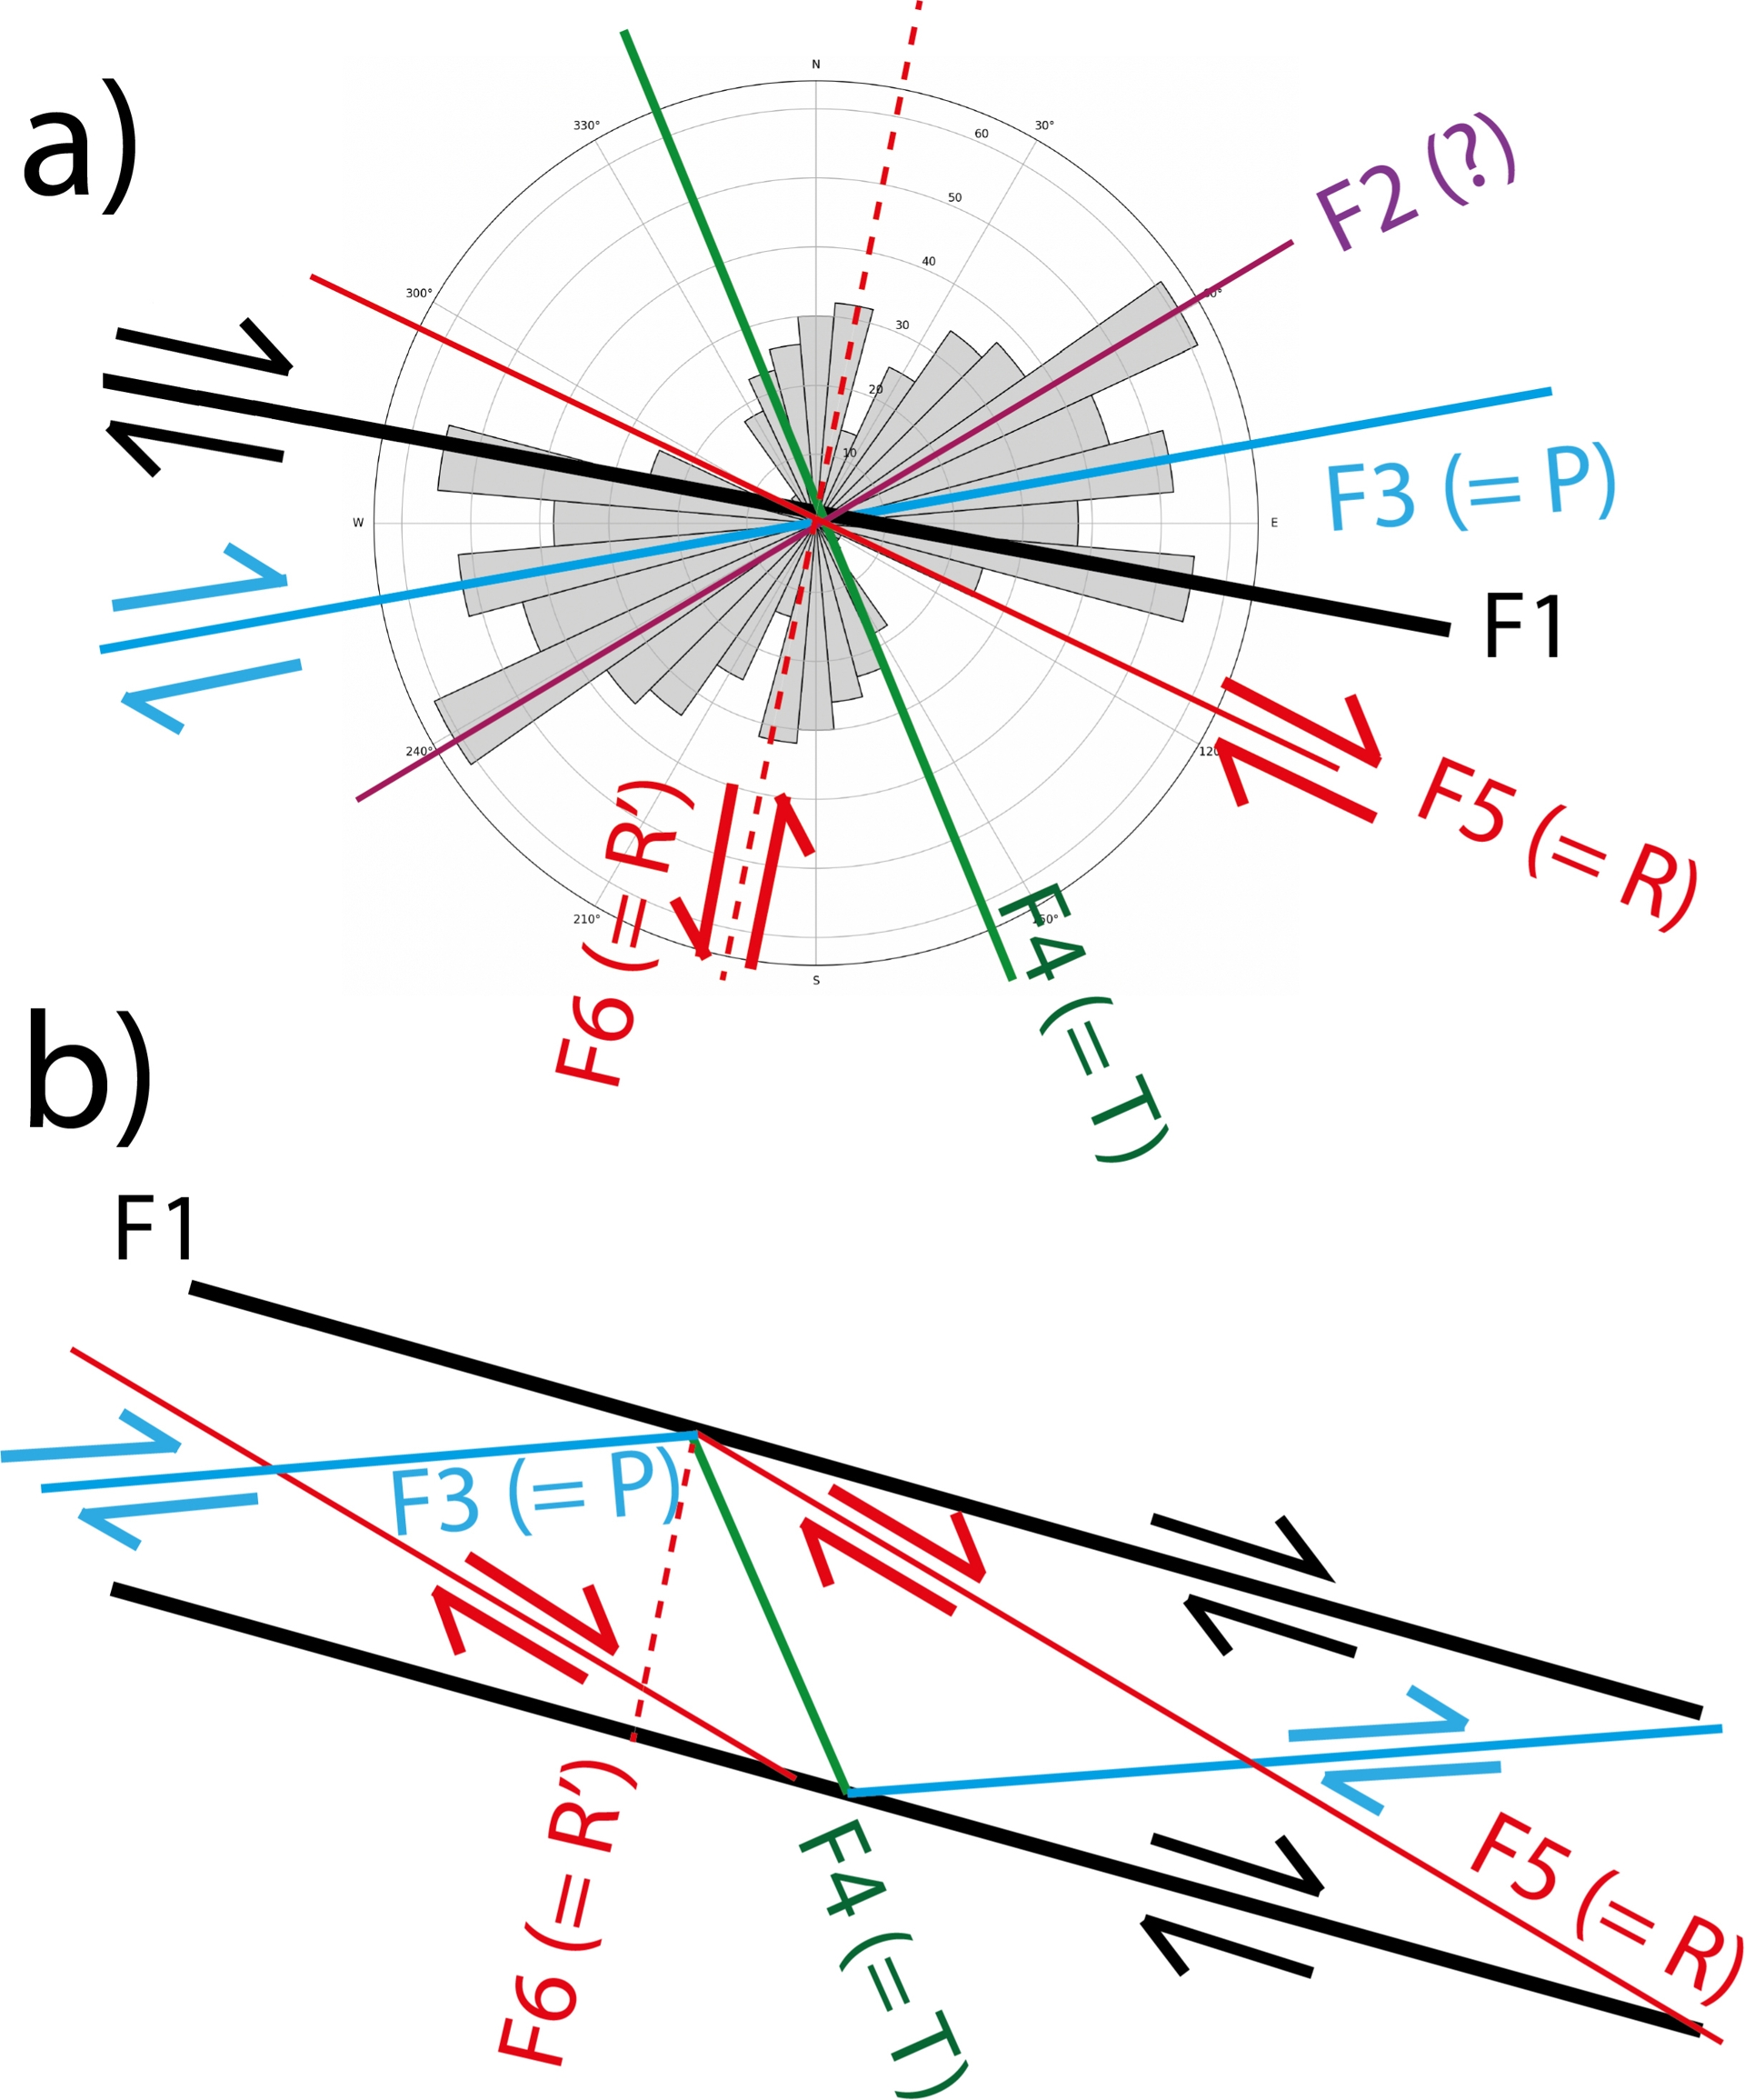
- Faults of the F3 family could be interpreted as P shears, i.e., secondary dextral strike–slip faults, arranged at a high angle relative to the main dextral shear direction F1, with an average orientation on the order of N85°E.
- Faults of the F5 family would correspond to synthetic Riedel R fractures, also exhibiting dextral strike–slip motion, arranged at a low angle relative to the main dextral shear direction F1, with azimuths typically ranging between N110°E and N120°E.
- Faults of the F6 family, oriented approximately N10°E to N20°E, could in turn correspond to antithetic Riedel R′ fractures, i.e., secondary sinistral strike–slip faults.
- Finally, F4 faults, previously interpreted as normal faults related to extension under the principal stress 𝜎1, fit into this system as tension fractures denoted T in the Riedel model. They typically form an angle of about 30° with the R and R′ fractures (respectively F5 and F6) and are oriented at approximately 45° to the main F1 faults.
Within the proposed interpretative model, only the F2 faults, oriented N60°E–N70°E, do not find a direct explanation in the set of main shear bands F1. This orientation is particularly well developed in the upstream part of the Chaudefour Valley, located southwest of Lake Chambon.
5. Semi-supervised directional classification using k-means
To better understand the origin and structural significance of the fault families, the full dataset of lineament azimuths was analyzed using a semi-supervised clustering approach. This procedure was informed by the initial visual classification presented in the previous section, which tentatively assigned the lineament orientations to a Riedel-type shear model. Building on this conceptual framework, we applied a clustering algorithm to refine the grouping of orientations and to reveal statistically consistent families of structures.
The classification method employed is based on the k-means algorithm, a well-established semi-supervised learning technique from the field of artificial intelligence, commonly used to detect natural patterns in complex multidimensional datasets. In order to account for the circular nature of azimuthal data, raw azimuths (expressed in degrees) were first converted to radians, then transformed into unit vectors in polar coordinates ( cos𝜃,sin𝜃), allowing for a geometry-consistent clustering.
The number of classes was set to seven (k = 7), taking into account the apparent angular diversity of the structures and based on the silhouette score analysis (obtained value: 0.534), an indicator of the internal consistency of the formed groups. For each cluster, a mean direction was determined from the vector mean of the azimuths, and the associated angular dispersion was calculated using the circular standard deviation. These results were then represented as a rose diagram (Figure 10), where each group is visualized with its dominant direction and an angular uncertainty sector of ± 1𝜎 (Table 4). This approach allows for a more systematic identification of dominant directional families in the spatial organization of the lineaments, independently of visual interpretation biases.
Rose diagram of measured directions, grouped according to the clusters identified by a semi-supervised classification approach, guided by a Riedel shear model. Each cluster is represented by a distinct color. The shaded sectors indicate the angular dispersion (±1𝜎) around the mean direction of each cluster.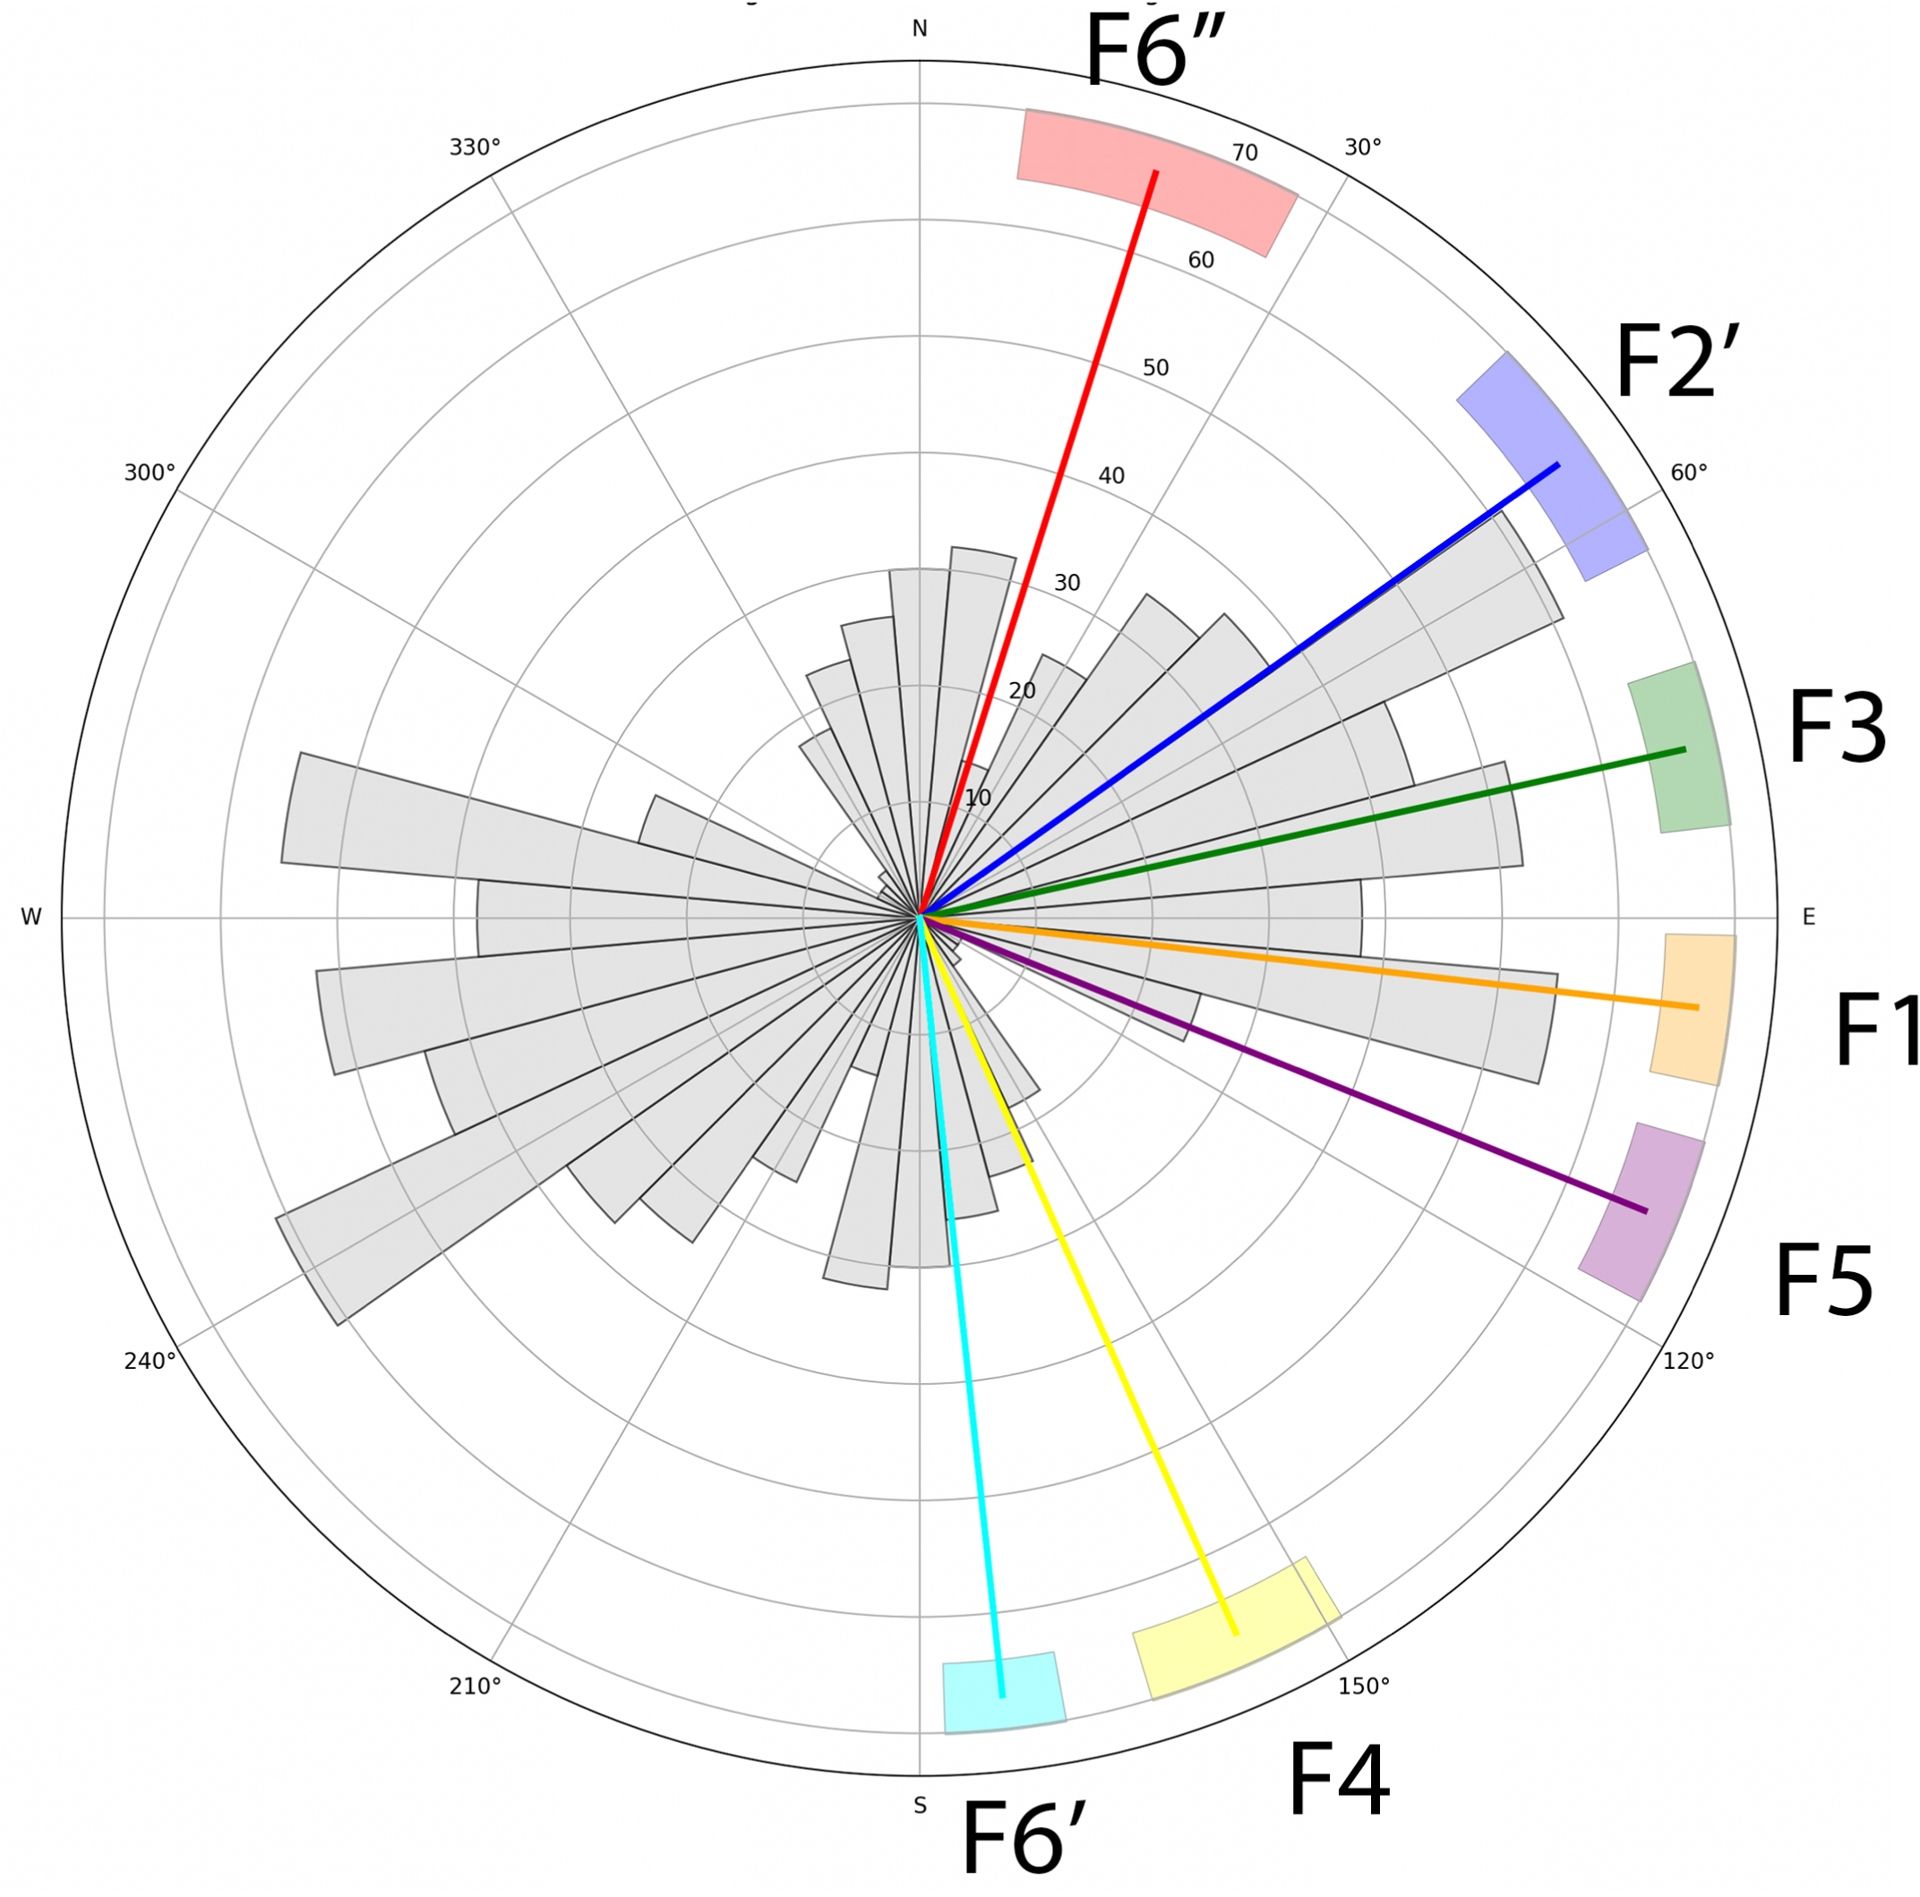
Characteristics of clusters i obtained by classification: number of elements (n) and mean direction (𝛼) with uncertainty (±1𝜎)
| i | n | 𝛼 | Type |
|---|---|---|---|
| 1 | 92 | 17.6 ± 10.1 | F6′′ (SHF) |
| 2 | 125 | 54.6 ± 8.6 | F2′ (TAF) |
| 3 | 97 | 77.5 ± 5.9 | F3 (P) |
| 4 | 78 | 96.5 ± 5.3 | F1 (SASZ) |
| 5 | 59 | 112.0 ± 6.1 | F5 (R) |
| 6 | 41 | 156.1 ± 7.3 | F4 (T) |
| 7 | 35 | 173.9 ± 4.3 | F6′ (R′) |
The automatic classification performed on the directions of the lineaments generally confirms the previously proposed structural interpretation, while providing important nuances.
The lineaments initially assigned to group F2 are now divided into two distinct subsets.
- A first subgroup, labeled F2′, with a N50°E–N60°E orientation, appears to correspond to the direction of the Tauves–Aigueperse Fault (TAF), a secondary structure affiliated with the Sillon Houiller Fault (SHF) Zone, operating as a left-lateral strike-slip fault.
- The remaining lineaments previously associated with F2 are now included in group F3, which is interpreted as secondary P-type faults, right-lateral strike-slip, related to the main F1 faults.
Similarly, the lineaments from the former F6 group are now distributed into two sets:
- A group F6′, oriented N170°E–N180°E, identified as R′ faults (in continuity with F6);
- A group F6′′, with a N10°E–N20°E orientation, corresponding to the orientation of the Sillon Houiller Fault (SHF).
6. The structural framework of Lake Chambon
Based on these elements, it is possible to propose a reinterpretation of the relief of Lake Chambon and its surrounding area.
6.1. Structural control
Indeed, until now, previous studies (Macaire, Corcita, et al., 1992; Macaire, Bossuet, Choquier, Corcita, de Luca, Dupis, Gay, Mathey, et al., 1997; Gay et al., 1998; Gay-Ovejero and Macaire, 1999) have interpreted the Lake Chambon area as a dammed lake, resulting mainly from external geodynamic processes (see Section 2.3). These processes include glacial erosion typical of glacial valleys, as well as valley blockage by the emplacement of the Tartaret volcanic deposits or by gravitational processes such as the collapses of the Dent du Marais.
However, the very angular geometry of the Lake Chambon Basin and of the Chaudefour Valley suggests that tectonic processes may also play a significant role in shaping the relief.
The publication by Macaire, Bossuet, Choquier, Corcita, de Luca, Dupis, Gay, Mathey, et al. (1997) provides a detailed description of the boreholes and core drillings carried out in the Chaudefour Valley and in Lake Chambon. Their Figures 5 and 7 present cross-sections through the deposits of the Tartaret paleolake and the present-day Lake Chambon. The associated raw data, including digitized borehole logs, are available through the BSS (Banque du Sous-Sol) database, managed by the BRGM and accessible via Infoterre.
Analysis of these documents shows that, contrary to what the relatively flat surface morphology suggests, the shallow sedimentary deposits of the Chaudefour Valley and the Lake Chambon basin rest on a granitic substratum characterized by a highly irregular buried surface at depth.
An abrupt deepening of the granitic substratum is observed (Table 5) along the southern continuation of the Quancouve stream fault (Figure 6) between four neighboring borehole sites (sites 1–4). East of this continuation, the upper surface of the granite shows a deepening of nearly 30–40 m (sites 2 and 4) compared to sites 1 and 3 located farther west (Table 5, Figures 6 and 11). In this area, the continuation of this fault can therefore be interpreted as an east-dipping normal fault.
Structural sketch of the Lake Chambon area. Shaded areas indicate subsiding zones created by transtension, located westward near the Rochers de Pousseterre and eastward beneath Lake Chambon, framing a central transpressive zone corresponding to the slow-moving Champsiaux–Berlaire landslide. The fault labeled (CF) corresponds to the Chambon Fault, interpreted at depth as a west-dipping normal fault (Gailler et al., 2025). Fault FQ corresponds to the Quancouve stream fault, whose subsurface continuation beneath Lake Chambon appears to exert a significant local control on the deepening of the granitic bedrock by nearly 40 m at points (2) and (4) relative to points (1) and (3). Areas of destabilized slopes (the slow-moving Champsiaux–Berlaire landslide to the west and the Dent du Marais rockslide to the east, together with their associated deposits in the Lacassou Lake area) are shown in semi-transparent orange, with their head scarps highlighted by barbed lines.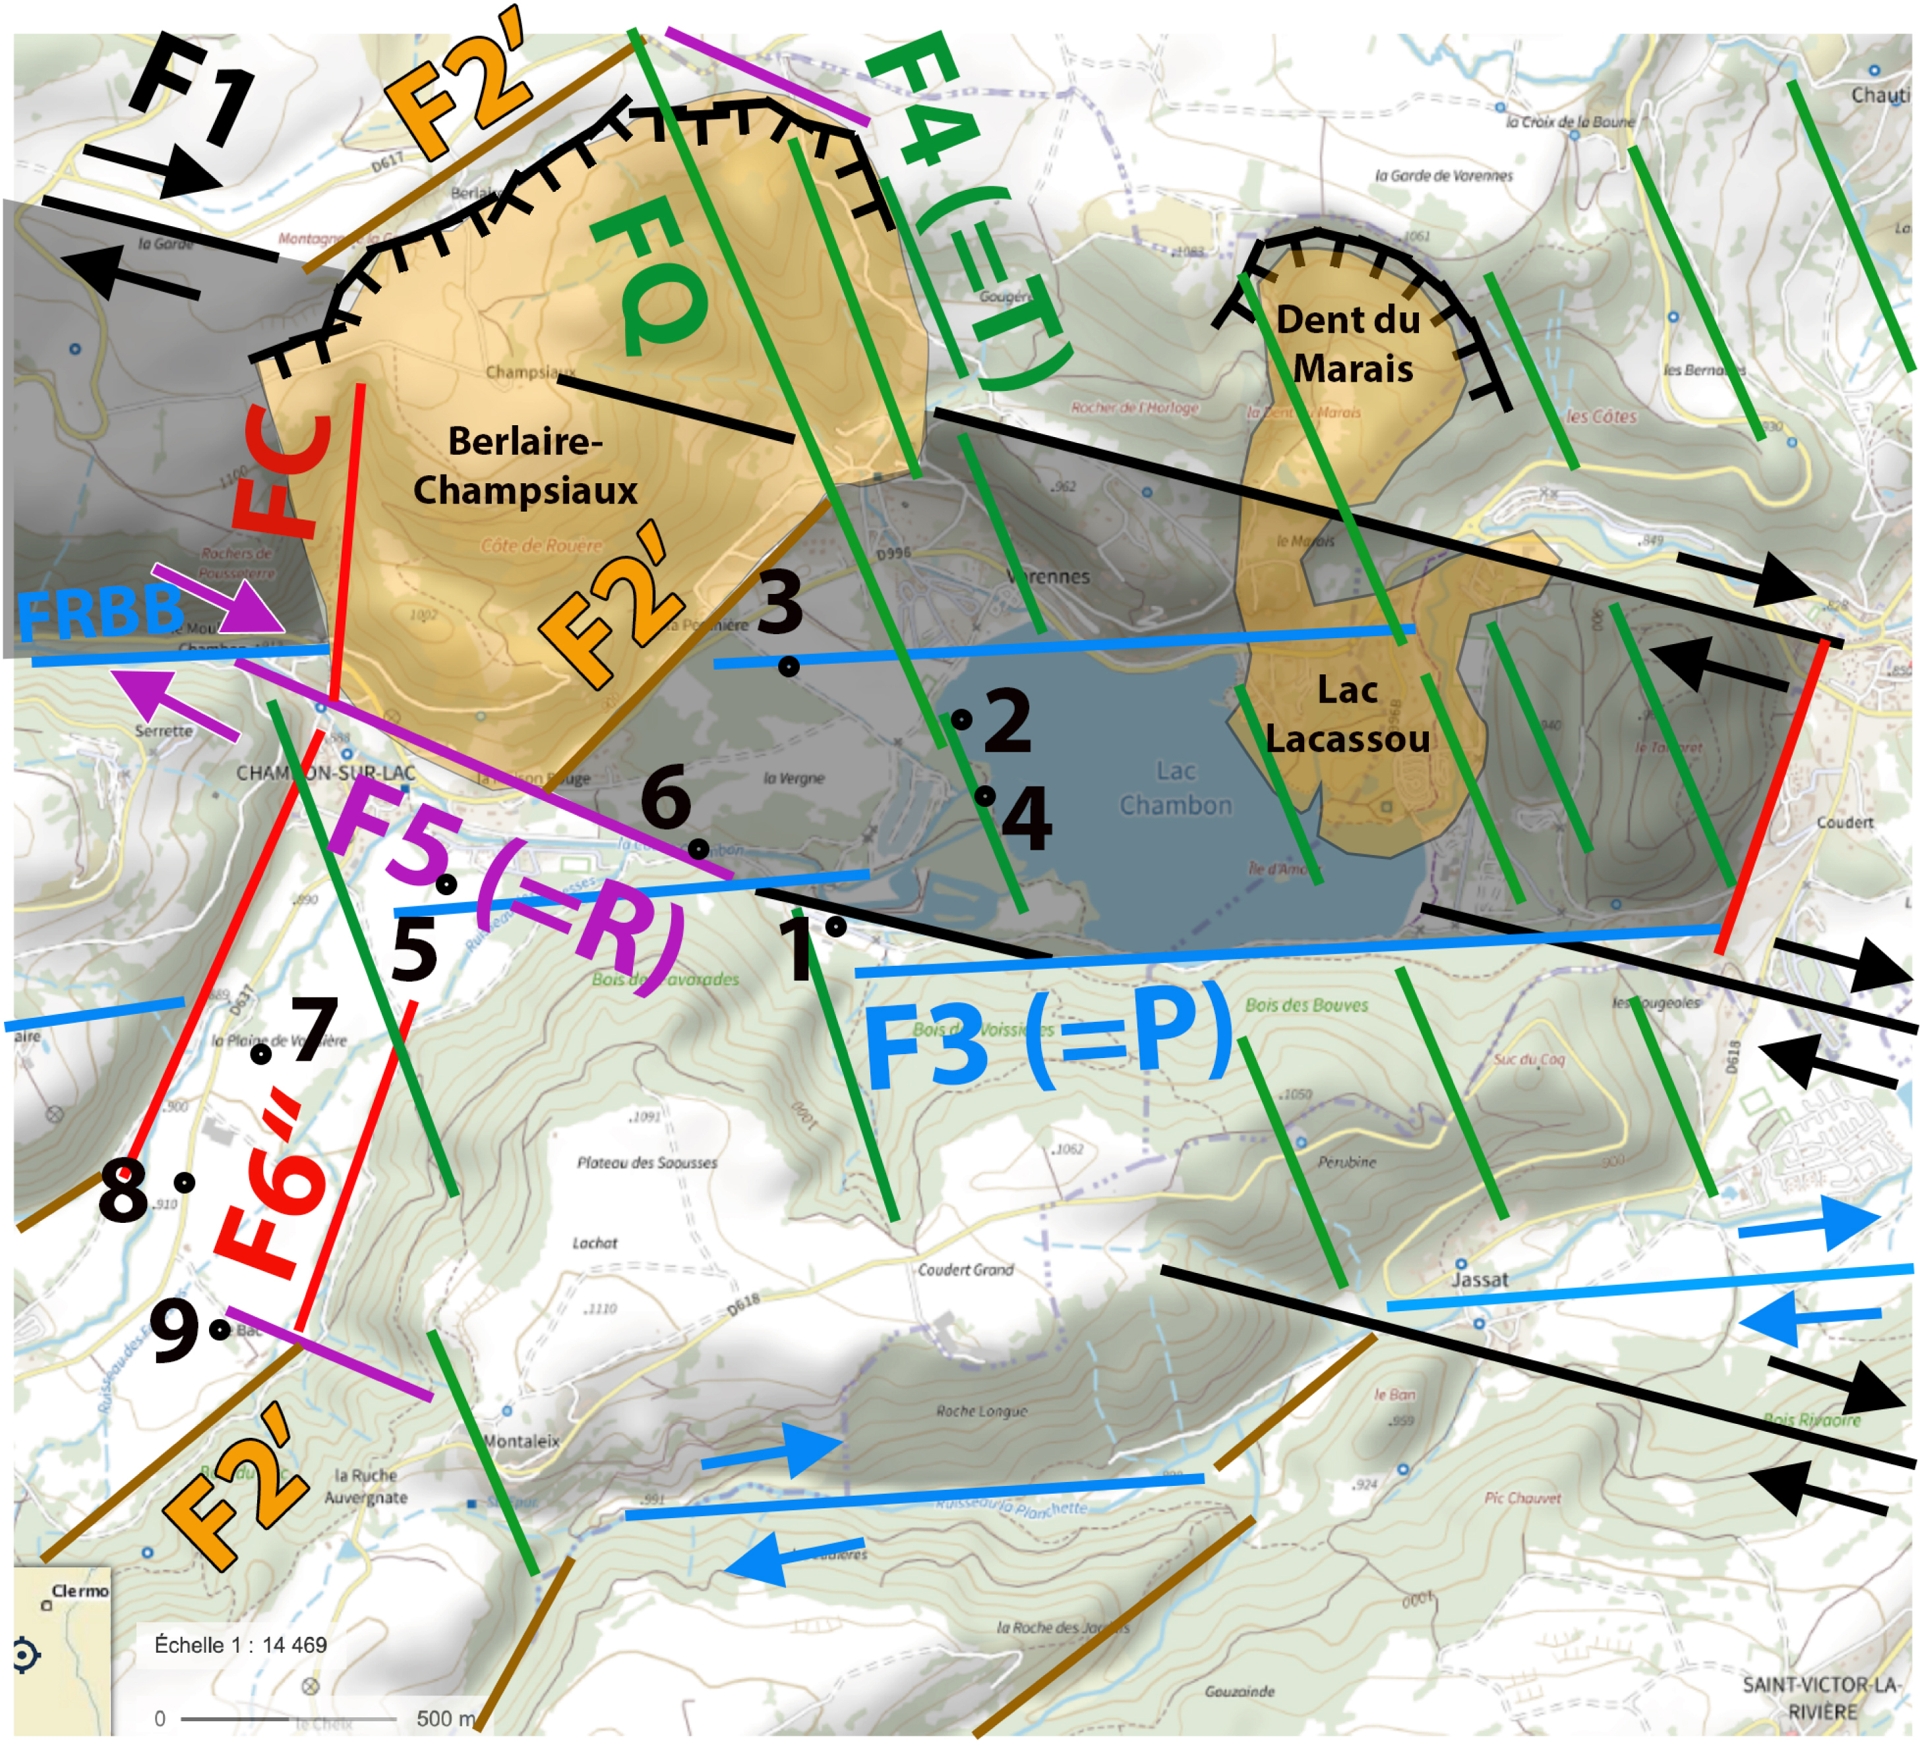
Characteristics of the investigated borehole sites
| Site no. | n | id | E (m) | C (m) | d (m) |
|---|---|---|---|---|---|
| 1 | BSS01UKLM | LV3 | 26 | 851 | 5 |
| 2 | BSS01UKLN | LV4 | >48 | <828 | >28 |
| 3 | BSS01UKLR | LV7 | 25 | 856 | 0 |
| 4 | BSS01UKLX | LVC4 | >58 | 817 | >39 |
| 5 | BSS01UKLP | LV5 | 21 | 864 | 0 |
| 6 | BSS01UKLQ | LV6 | 21 | 857 | 7 |
| 7 | BSS01UKLS | PV1 | >34 | 864 | 34 |
| 8 | BSS01UKLT | PV2 | 6 | 898 | 0 |
| 9 | BSS01UKLU | PV3 | 14 | 895 | 3 |
n corresponds to the BSS record number (replace n with its value in the URL http://ficheinfoterre.brgm.fr/InfoterreFiche/ficheBss.action?id=n), id is the borehole identifier as used by Macaire, Bossuet, Choquier, Corcita, de Luca, Dupis, Gay, Mathey, et al. (1997), E is the thickness of the Tartaret or Chambon lake deposits, C represents the elevation of the basement–sediment interface, and d is the relative vertical deepening calculated with respect to the neighboring site showing the highest basement elevation, for which d is set to 0 m.
Similarly, near the village of Chambon-sur-Lac, a deepening of approximately 8 m of the basement–sediment interface is observed at site 6 compared to site 5 farther west (Table 5), also suggesting the presence of an east-dipping normal fault.
In the same way, farther upstream in the Chaudefour Valley, between Voissière and Chambon-sur-Lac, the boreholes carried out by Macaire, Bossuet, Choquier, Corcita, de Luca, Dupis, Gay, Mathey, et al. (ibid.) (sites 7–9) suggest a local tectonic uplift of the basement in the vicinity of faults trending in several directions (Figures 6 and 11); however, the maximum depth reached by the boreholes did not allow the granitic substratum to be directly intersected, although the vertical displacement of the basement exceeds 30 m (Table 5).
It is therefore difficult to attribute these abrupt variations in the depth of the granitic substratum solely to glacial erosion, particularly in the form of glacial thresholds, since the lithology is identical on either side of the observed discontinuities. A tectonic origin therefore appears more likely.
6.2. Proposed model
Lake Chambon is thus interpreted as a narrow subsiding basin of parallelepipedal shape. Its geometric form is only partially obscured in its northeastern part (Lacassou Lake area) by the rockfall deposits derived from the Dent du Marais (Vidal et al., 1996; Chapron et al., 2022). This transtensional basin most likely formed as a pull-apart structure, resulting from a right-stepping relay between two offset branches of the main dextral strike-slip fault system F1, within the fault zone extending from the Col de la Croix-Morand to Murol (Figure 11).
The basin is bounded by a set of border faults dominated by the regional dextral shear faults F1, together with secondary faults F3 (P-type), F5 (R-type), F6′ (R′-type), F2′ (faults with orientations comparable to that of the Tauves–Aigueperse Fault), and F6′′ (with orientations close to that of the Sillon Houiller Fault), which frame this extensional relay zone. At depth, the basin displays a negative flower structure (see, for example, Muksin et al., 2014), characteristic of transtensional settings, with internally subsiding blocks mainly bounded by F4 faults (T-type).
Within this structural framework, the F6′′ faults can be interpreted as sinistral antithetic faults associated with the regional dextral shear accommodated by the F1 faults, in continuity with the Cholet–Poitiers Fault of the South Armorican Shear Zone (SASZ). Furthermore, the R′ faults (corresponding here to the F6′ structures) likely underwent progressive clockwise rotation during deformation, in accordance with Riedel shear reorientation models described by Tchalenko (1970) and Atmaoui (2005). This conceptual model thus accounts for the geometric arrangement of the observed faults, the localization of subsidence zones, and the coupling between transtensional tectonics and volcanism (Dent du Marais and Tartaret).
Furthermore, the same explanatory model could be applied at a broader scale, that of the Monts Dore Massif (Figure 12), where volcanism may also have developed within a crustal transtensional context favoring magma ascent. As shown in Figure 12, the two calderas of the Monts Dore Massif appear to be structured along the orientations of the F4 faults, suggesting that these faults played a major role in the localization and organization of volcanic centers.
Simplified structural sketch of the Monts Dore Massif superimposed on its DEM. (1) Lake Guéry; (2) Puy de Sancy; (3) Lake Pavin; (4) Lake Chambon; (5) Saint–Nectaire; (6) Besse–et–Saint–Anastaise; (7) Murat–le–Quaire; (8) Mont–Dore; (9) Couze Pavin at Lomprat. (a) Murol–La Croix–Morand Fault; (b) Croix–Morand–Banne d’Ordanche Fault; (c) La Bourboule Fault; (d) Chaudefour faults. F1: main dextral shear faults; F3: secondary dextral P-type strike–slip faults; F4: extensional T-type faults; F2′: faults related to the Tauves–Aigueperse Fault. Dotted lines represent the inferred boundaries of the two calderas (Cantagrel and Briot, 1990), that of the Guéry volcano to the north and that of the Sancy to the south. The shaded area indicates the subsiding transtensional basin of Lake Chambon. ⋆: Dent du Marais rockslide. ◇: Montagne de la Plate rockslide. △: Champsiaux–Berlaire (or Chambon) landslide.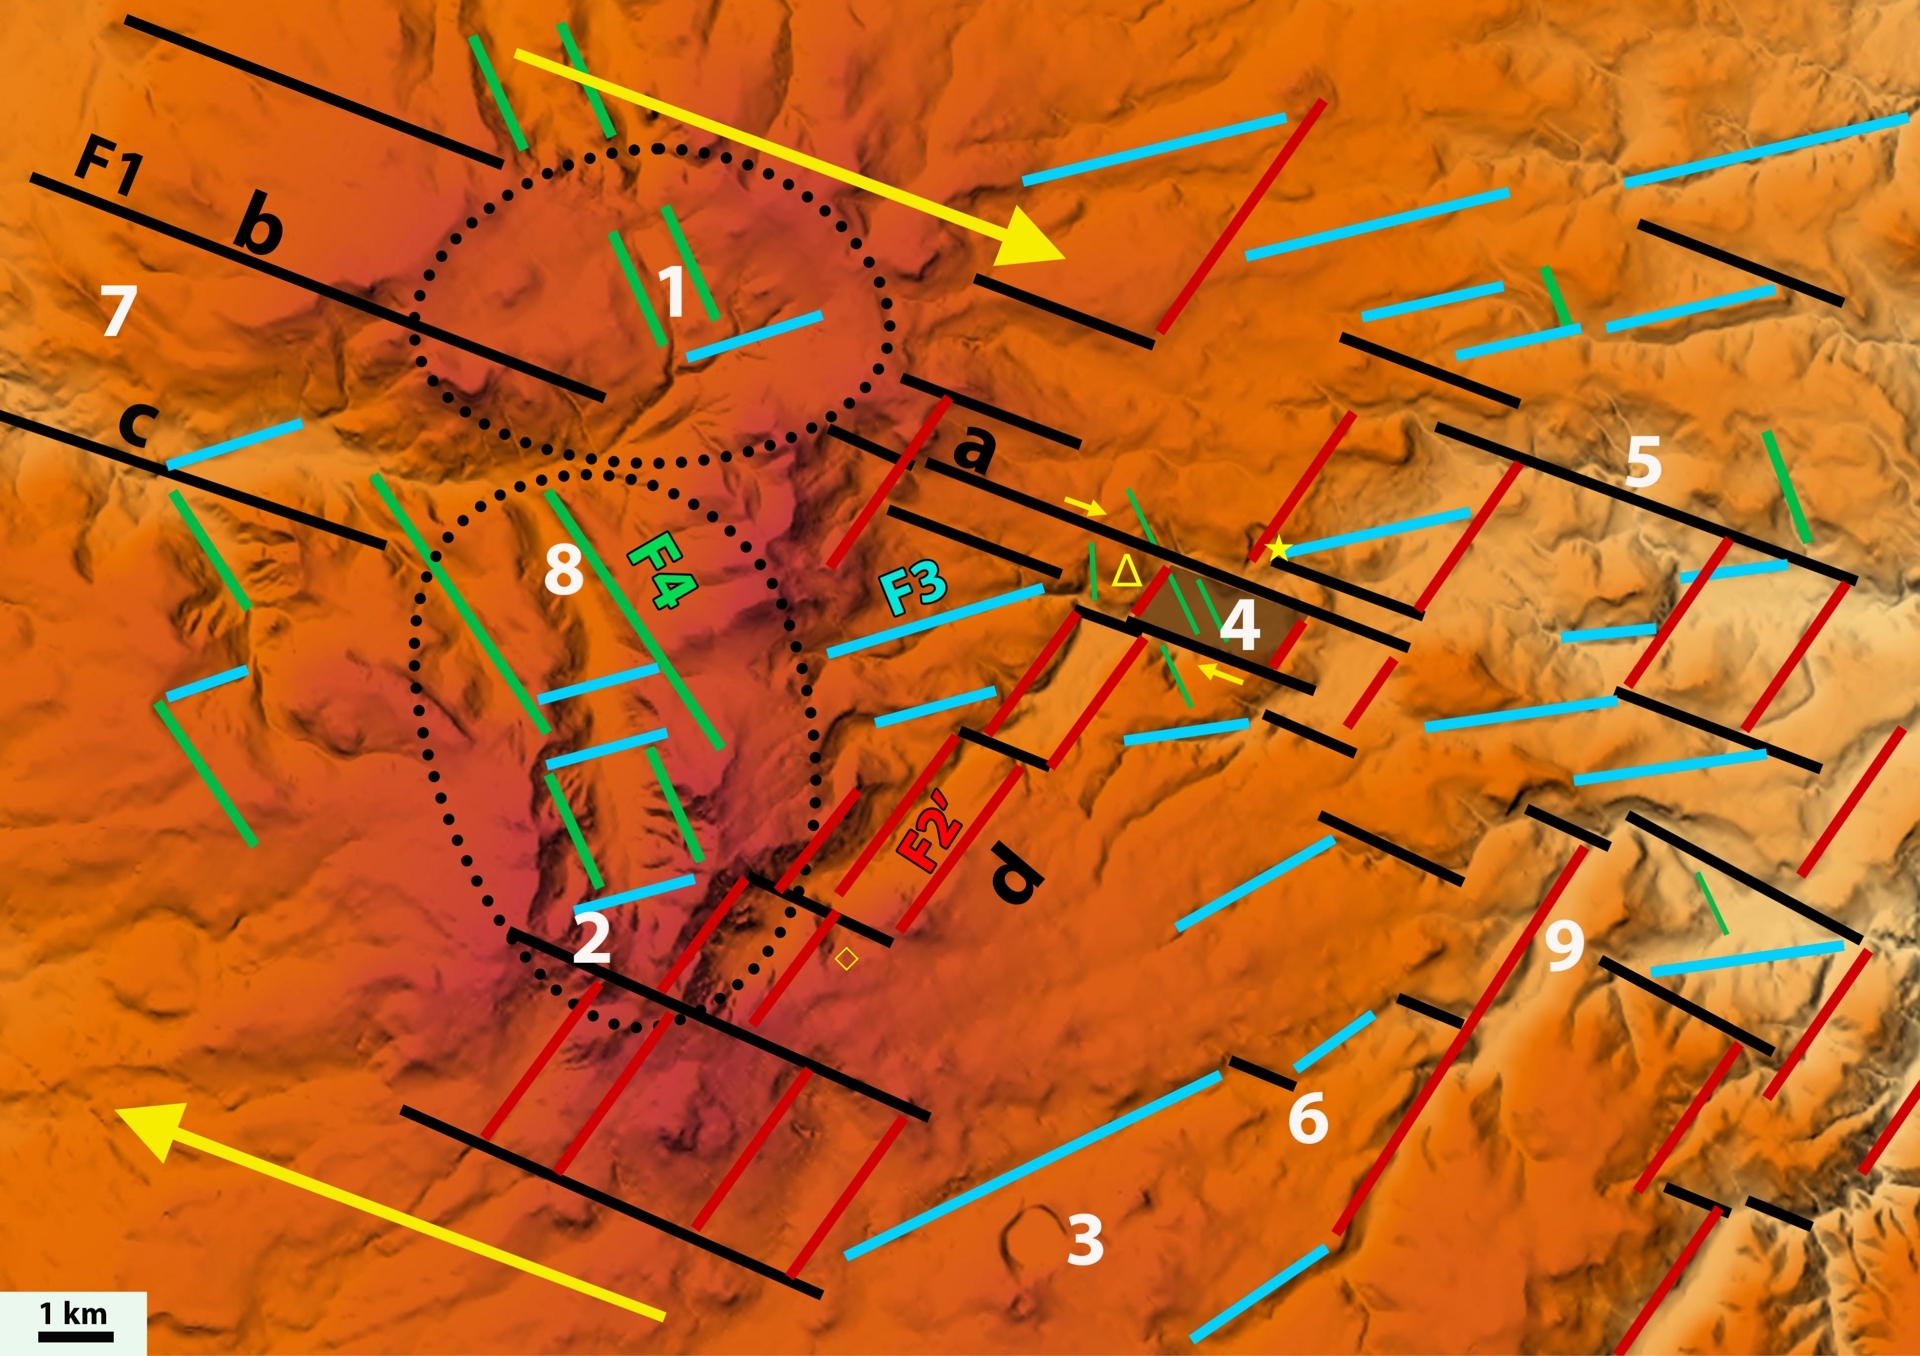
The main regional dextral shear directions (F1), previously described in the context of the Lake Chambon area, are also observed in the Dordogne Valley, between Murat–le–Quaire and the town of Mont–Dore, indicating a regional continuity of strike–slip deformation. In addition, SSW–NNE–trending fault directions (F2′), similar to the orientation of the Tauves–Aigueperse Fault, are recognized in the Chaudefour Valley as well as in the Couze Pavin Valley near Besse.
Furthermore, the work of Cantagrel and Briot (1990) shows that the area located northwest of the Croix–Morand Pass, corresponding today to the Lake Guéry sector, may represent the core of a former major volcanic edifice, the Guéry stratovolcano. This edifice is thought to have undergone a preferential collapse of its northeastern quarter, generating large lahar and debris-avalanche deposits, notably the so-called Perrier debris-avalanche deposits and lahars. Such a mode of flank destabilization is consistent with the model proposed by Lagmay, van Wyk de Vries, et al. (2000), according to which a volcanic cone built above a strike–slip fault preferentially develops flank instabilities within the sector of the cone located between the secondary R and P faults associated with the active shear fault (see, for example, Lagmay and Valdivia, 2006; Paguican et al., 2012). In the case of the former Guéry stratovolcano, the orientation of debris avalanches toward the NE and E sectors is thus compatible with a structural control exerted by a regional dextral shear oriented N110°E. In this context, the destabilization of the Guéry stratovolcano is interpreted as being related to the same system of regional dextral strike–slip F1 faults oriented N110°E as that recognized throughout the rest of the study area.
Finally, Figure 12 highlights a pattern of crustal deformation characterized by the presence of numerous dextral strike–slip F1 faults (regional shear faults) and F3 faults (P-type faults), suggesting a largely diffuse and distributed deformation at the scale of the massif. However, a more pronounced structural corridor clearly stands out between the Croix–Morand Pass, Lake Chambon, and Murol, where deformation appears to be concentrated along a network of more continuous and better-organized faults.
6.3. Discussion
The results obtained in this study can be compared with those of Gailler et al. (2025), conducted in the same area. That study is based on the analysis of focal mechanisms of microseismic events located between 3 and 5 km depth and thus provides direct constraints on the kinematics of active structures at depth, complementary to surface morphostructural observations (Figure 13). Several faults with well-constrained kinematics are described therein:
Kinematic and structural model of the transtensional relay associated with the Montagne de la Garde, north of the village of Chambon-sur-Lac. (a) Fault traces overlaid on a LiDAR DEM (IGN), obtained from a screenshot of the Geoscope mobile application (Thiéry, 2025). CF corresponds to the Chambon Fault (N13°E, 68°W dip). Fa and Fb are two adjacent faults, associated at depth, striking N173°E and dipping 85°W. BBF is the Bois de Benne stream fault. The circle with an internal cross indicates subsidence motion on the Montagne de la Garde plateau. The blue arrow represents southward ground push at the locality known as “Rochers de Pousseterre”. (b) Kinematic interpretation of faults Fa, Fb, and CF based on a direct application of the structural model proposed in this study; blue arrows indicate relative block displacements. 𝜎h represents the maximum horizontal stress according to Mazotti et al. (2020). (c) Kinematic reinterpretation incorporating constraints derived from focal mechanisms described by Gailler et al. (2025). Barbed lines represent normal faults, with barbs indicating the downthrown block, particularly along the Chambon Fault (CF). The semi-transparent yellow domain corresponds to the narrow basin, with a triangular to trapezoidal geometry, currently developing between the CF fault on the one hand and the Fa and Fb faults on the other. Yellow arrows indicate the opening direction of the basin. Red dots indicate restraining points along the BBF fault. (d) Conceptual WNW–ESE cross-section through the pull-apart basin, illustrating the geometry (flower structure) and the combined behavior of the Fa, Fb, and CF faults through the granitic basement.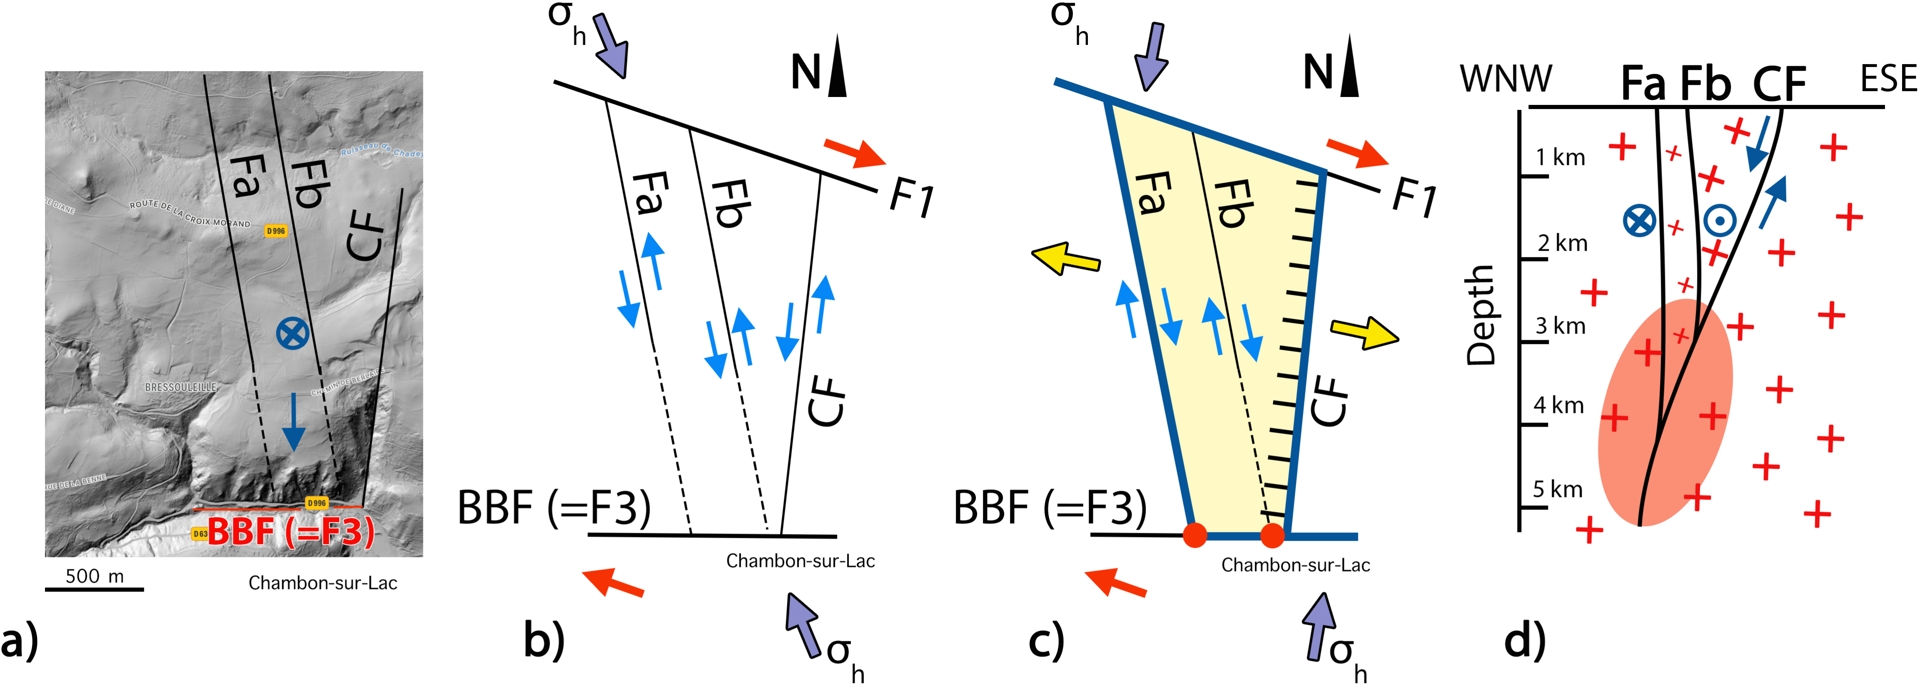
- a fault striking N13°E and dipping 68° westward, corresponding to the Chambon Fault (CF; Figure 11). In our structural model, this structure is interpreted at the surface as a sinistral strike–slip fault, comparable to an R′-type fault or to a structure related to the Sillon Houiller Fault. However, seismological data indicate that at depth this fault behaves mainly as a west-dipping normal fault (ibid.).
- two neighboring faults striking N173°E and dipping 85° westward, referred to as Fa and Fb, located west and northwest of the Chambon Fault and showing no clear morphostructural expression at the surface. Although this orientation could initially be related in our model to a sinistral R′-type shear, the focal mechanisms reveal a dextral strike–slip behavior at depth.
At the regional scale, the maximum horizontal stress oriented between N160°E and N170°E (Mazotti et al., 2020) implies that the Fa, Fb, and CF faults should operate as sinistral strike–slip faults, in agreement with their geometry and with the structural model proposed here (Figure 13b). However, the focal mechanisms analyzed by Gailler et al. (2025) indicate a significantly different kinematic behavior at depth, with Fa and Fb faults active as dextral strike–slip faults, whereas the CF fault behaves as a west-dipping normal fault. This apparent contradiction between the behavior expected from the regional stress field and the seismological data suggests a local accommodation of deformation associated with a perturbation of the stress field.
In such a transtensional setting, even a moderate reorientation of the principal stresses is sufficient to locally reverse the sense of slip on faults. We interpret this configuration as a transtensional relay developed between, to the north, a major F1 fault segment striking N110°E and accommodating regional dextral strike–slip motion, and, to the south, an F3 fault segment corresponding to the Bois de Benne stream fault (BBF), of P-type and also characterized by dextral kinematics. In this context, a narrow pull-apart basin develops between the CF, Fa, Fb, F1, and BBF faults (Figure 13c). The operation of this basin implies the existence of restraining points along the BBF fault, particularly in the immediate vicinity of the village of Chambon-sur-Lac, where several active faults converge. Such a tectonic configuration may locally promote seismic locking and stress accumulation, potentially allowing the release of significant seismic energy in the Chambon-sur-Lac area, without implying any short-term predictability.
This model is consistent with the deformations observed at the surface, marked by a southward bulging of the relief at the locality known as “Rochers de Pousseterre” and, farther north, by the development of a depression affecting the summit surface of the Montagne de la Garde (Figure 13a). The WNW–ESE cross-section shown in Figure 13d illustrates the typical “flower” geometry associated with this type of transtensional basin developed within a regional shear corridor.
7. Consequences and natural hazards
7.1. Landslides and rockfalls
Active fault zones generally leave clear geomorphological evidence of their recent or ongoing activity along their traces. Such evidence notably includes fault scarps and other geomorphological features caused by gravitational movements such as landslides, tilting, rockfalls, flows, or combinations of these types of processes (Cruden and Varnes, 1993).
In the study area, the landslides and rockfalls described below are, almost systematically, spatially associated with underlying faults. While these faults naturally contribute to weakening the relief through rock fracturing, this spatial recurrence is a striking feature, suggesting that these instabilities may, at least in part, be triggered or reactivated by seismogenic activity (see, for example, Song, Yu, et al., 2022; Song, Chen, et al., 2025).
Such manifestations are clearly visible in the study area, as illustrated by the major rockfall of the Dent du Marais, dated to approximately 2600 years BP, which contributed to the partial blockage of the Couze Chambon and to the development of the present natural dam lake, Lake Chambon (Vidal et al., 1996; Chapron et al., 2022). Another significant event is the sudden drainage of the Tartaret paleolake, which occurred around 8500 years BP. Although a strictly seismic origin of these events has not been formally established, the studies of Chassiot et al. (2016) and Chapron et al. (2022) suggest a high probability of earthquake triggering.
In a similar manner, the collapses of the Montagne de la Plate are located in an area where analysis of the digital elevation model highlights the proximity and intersection of F1 and F2′ faults (Figure 12).
Another major flank landslide, identified as the Chambon (or Champsiaux–Berlaire) landslide, initiated on the southern slope of the Montagne de la Garde. Covering an estimated area of ∼1.5 km2, the unstable zone extends from the Berlaire farm and the locality of Champsiaux to the Roches de Pousseterre to the west and the Varennes locality to the east, and overlooks the village of Chambon-sur-Lac with a relative relief of approximately 200 m (Figure 14).
(a) Extract from the 1:25,000 IGN topographic map. (b) Annotated view of the Champsiaux-Berlaire (or Chambon-sur-Lac) landslide (Google Maps screenshot). Solid lines indicate the faults controlling the boundaries of the landslide: B: Chambon Fault of R′ type; C: F1-type fault; D: F4 fault (=T-type) of the Quancouve stream; E: F4 fault of T-type; F: F1 fault north of the Berlaire farm. Lines with barbs indicate landslide scarps of secondary slides identified by slope breaks on the hillsides. The yellow line, labeled A, indicates the head scarp of the slow landslide at the Berlaire farm. Grey-shaded areas indicate displaced slide panels. Orange-shaded areas indicate probable mudflows and debris flows.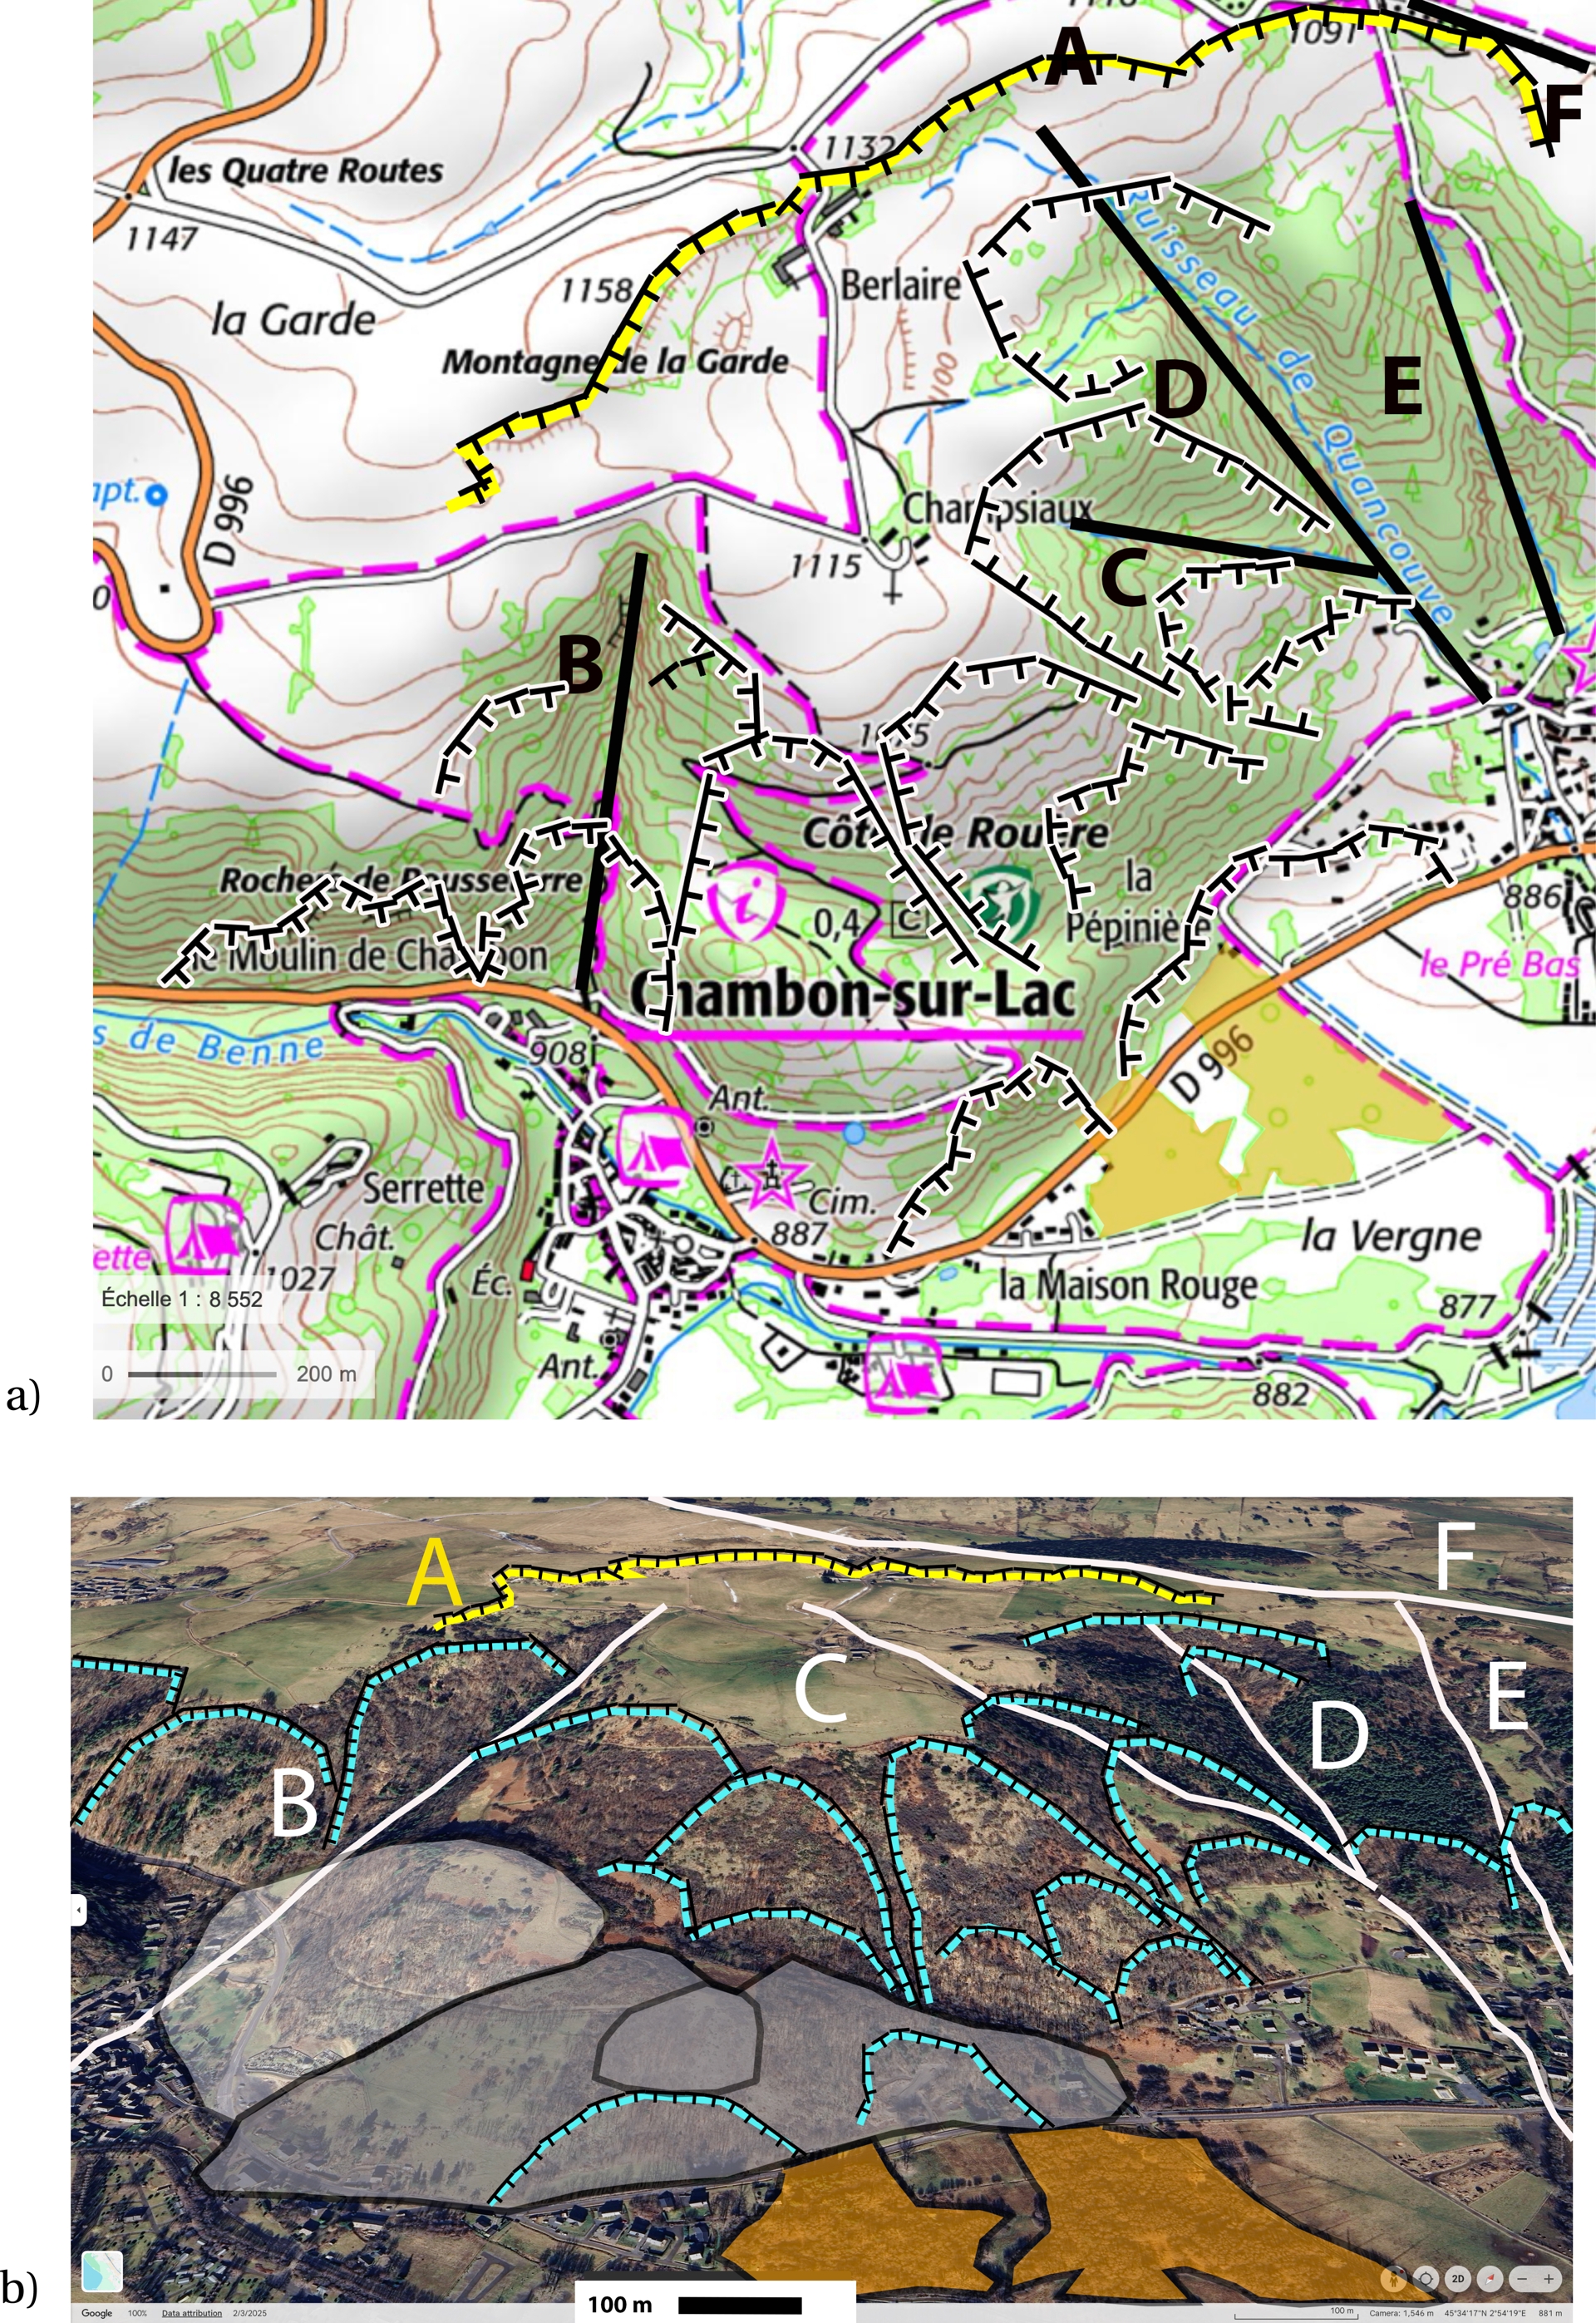
It is noteworthy (Figure 11) that this slope abruptly truncates the northern boundary of the Chaudefour Valley along a lineament interpreted as an F5 fault of R-type, and then along an F2′ fault (with an orientation comparable to that of the Tauves–Aigueperse Fault) along its southeastern margin. The destabilizing slope is subsequently clearly compartmentalized by deeply incised gullies, whose paths are controlled by additional fault structures. Thus, the eastern part of this slope is dissected by two gullies, including the Quancouve stream gully, which follows an F4 fault interpreted as a T-type fault in the Riedel scheme. The western limit of the Champsiaux–Berlaire landslide is marked by the Chambon Fault (FC), now interpreted as a west-dipping normal fault. East of the village of Chambon-sur-Lac, the Bois de Benne stream displays a clear convex southward deflection at the foot of the landslide, suggesting a progressive push of the slope toward the valley. Moreover, the large head scarp at the northern part of the slope shows an orientation consistent with that of the F2′ and F4 faults. These head scarps observed near the Berlaire farm are expressed by fresh scarps several meters high, indicating ongoing slope activity, most likely in the form of slow landsliding. The slope surface is further affected by secondary landslides and associated gravitational features (depressions, and counter-slopes), characteristic of moving slopes.
Finally, at the toe of this landslide, mudflows and debris flows have been identified based on the analysis of aerial photographs and borehole data (presence of clayey–silty superficial deposits with blocks in borehole 071175X0059) from the BRGM Subsurface Database, suggesting recurrent historical flow episodes rather than a single event.
All these observations suggest that secondary Riedel-type structures, in connection with the major border faults F1, F2′, F4, F6′, and F6′′, play a decisive role in the segmentation, kinematics, and gravitational preconditioning of this unstable flank.
The dynamics of this unstable flank justify enhanced geomorphological and geophysical monitoring, especially as this type of phenomenon is frequently observed in active fault zones, as reported in other comparable tectonic settings (e.g., Malamud et al., 2004; Ocakoğlu et al., 2024).
7.2. Reactivation of the deep hydrothermal system
Our structural model also helps to clarify the functioning of the active deep hydrothermal system located at approximately 3–5 km below the surface (Boudoire et al., 2025). This system is evidenced at the surface by the presence of carbo-gaseous mineral water springs (rich in CO2) and has recently shown signs of anomalous activity. Between 2021 and 2022, several episodes of microseismicity were recorded in the area, accompanied by long-period (LP) seismic waves, which are characteristic of intense hydrothermal activity and, more specifically, of fluid boiling within subsurface conduits (Chouet, 1996; Nakano et al., 2003; Ohminato, 2006).
The hypothesis proposed here is that these manifestations reflect a decompression of the hydrothermal system induced by the tectonic reactivation of deep fault structures. Fractures that were previously sealed may currently be reopening under the effect of recent tectonic stresses, allowing fluids to depressurize and migrate toward the surface. This process can be interpreted as a precursor signal of tectonic reactivation (Chouet, 1996; Saade et al., 2019). Within the range of pressures and temperatures expected for a hydrothermal system located between 3 and 5 km depth (150–300 °C, 300–500 bar under hydrostatic conditions), the presence of CO2-rich mineral waters may lead to explosive degassing during fracture opening and associated decompression. This phase-separation process can generate seismic signals due to the abrupt release of energy (Thiéry and Mercury, 2009a; Thiéry and Mercury, 2009b).
Furthermore, the fact that this hydrothermal system is located within a transtensional relay provides strong support for our model. In transtensional relays, the local stress is reduced, which constitutes a key factor for increased permeability and the development of hydrothermal circulation, as suggested by the work of Liotta et al. (2023).
The association between this hydrothermal microseismicity, field observations (landslides and surface ruptures), and the geometry of the faults identified along the southern border fault of the Limagne Graben (SBLF) suggests that the Croix–Morand–Murol fault (CMF) zone is not only inherited but still active. This situation argues for enhanced monitoring, both of the hydrothermal system and of slope stability. Such systems are known to generate earthquakes related to fluid–fault interactions, as demonstrated in other volcanic or tectonic settings.
7.3. Tectono–geomorphological integration
The Champsiaux–Berlaire slow landslide occupies a key structural position within the major dextral shear corridor trending N110°E (WNW–ESE), recognized between the Croix–Morand Pass and the Murol area. It is also located at the northern termination of the large Chaudefour Valley structure, oriented N50°E (SW–NE), a direction comparable to that of the Tauves–Aigueperse Fault. In this context, the Champsiaux–Berlaire area appears to be spatially framed by two transtensional domains: to the west, the small transtensional basin currently forming at the Rochers de Pousseterre, and to the east, the more developed transtensional basin of Lake Chambon. This configuration suggests that the Champsiaux–Berlaire sector corresponds to a transpressive push–up ridge structure, intercalated between two extensional zones within the same regional dextral shear corridor. Such a structure promotes conditions of relative uplift, fracturing, and destabilization of the substratum, making this area particularly favorable for the development of a large-scale slow landslide.
The morphostructural continuity observed between the Champsiaux–Berlaire landslide and the Chaudefour Valley along the same N50°E axis further supports this interpretation. It suggests that the Chaudefour Valley may have initially corresponded to an uplifted structural block, possibly an ancient N50°E–oriented horst affecting the Chambon-sur-Lac granitic basement and related to an inherited transpressive structure. This uplifted block would have been preferentially fractured and weakened, subsequently favoring enhanced incision by glacial erosion processes, as well as by rockfalls and gravitational collapses. The fact that the Chaudefour Valley is not protected by effusive lava flows, in contrast to the Montagne de la Plate area, supports the idea that it originally constituted a topographically elevated zone, dominating paleovalleys that are now infilled by volcanic products of the Monts Dore Massif. In addition, the Chaudefour Valley clearly incises Middle Pleistocene volcanic formations, including trachybasalts (unit 𝜏𝛼2 in Figure 2) and the basalts of the Montagne de la Plate scoria cone, dated at ca. 220 ka (Vidal et al., 1996), indicating that valley incision initiated no earlier than the Middle Pleistocene. This implies that the erosion and relief inversion of the former Chaudefour Valley horst occurred over a relatively short geological time span. From this perspective, the Chaudefour Valley may represent a noteworthy example of relief inversion, developed on an inherited tectonic structure initially expressed as a horst or push-up ridge. Finally, the northward continuation of this N50°E axis of basement uplift, in connection with the doming of the Dômes Plateau forming the basement of the Chaîne des Puys, suggests a first-order regional tectonic control on the organization and long-term evolution of relief at the scale of the Massif Central.
8. Conclusion
This study allowed the identification and mapping of 527 lineaments based on a detailed digitization of the Digital Elevation Model (DEM) of the Chambon-sur-Lac region, with a resolution of 5 m per pixel. All data were integrated into a Geographic Information System (GIS) using QGIS software, enabling a structured analysis of lineament orientations.
An initial statistical analysis revealed the existence of six major fault families oriented along the following directions: F1 (N100°E–N110°E), F2 (N60°E–N70°E), F3 (N80°E–N90°E), F4 (N150°E–N180°E), F5 (N110°E–N130°E), and F6 (N0°E–N20°E).
To objectively support this classification, we also applied a semi-supervised clustering approach using the k-means algorithm, a well-known machine learning method. This analysis grouped the lineaments into seven main clusters corresponding to the following dominant orientations: F6′′ (N10°E–N30°E), F2′ (N40°E–N60°E), F3 (N70°E–N80°E), F1 (N90°E–N110°E), F5 (N110°E-N120°E), F4 (N150°E–N160°E), and F6′ (N170°E–N180°E). This classification refines the initial typology by revealing more precise groupings, indicative of a complex structural organization potentially related to a general dextral shear regime.
Based on these observations, an interpretive model of brittle deformation was proposed, consistent with the current tectonic stress regime characterized by a principal stress 𝜎1 oriented between N160°E and N180°E (Dorel et al., 1995; Mazotti et al., 2020). This model is based on the presence of dextral shear zones associated with the main F1 faults, part of the SASZ-SBLF fault system, interpreted within the Riedel shear model framework: F4 corresponding to extensional T faults, F3 to dextral secondary P-type faults, F5 to R faults, and F6′ to sinistral R′ faults.
The study also highlights the influence of the sinistral shear zone of the Sillon Houiller Fault (SHF), an antithetic fault to the SASZ-SBLF system. Indeed, the characteristic orientations of the Sillon Houiller Fault appear in group F6′′ (interpreted as related to the SHF), as well as those of the Tauves–Aigueperse Fault (TAF), a fault associated with the Sillon Houiller Fault in group F2′.
This neotectonic framework provides an explanation for several geomorphological and structural features observed in the region. The Lake Chambon Basin is interpreted as a subsiding pull-apart basin, formed in a transtensional relay between two F1 fault segments. The volcanism of Tartaret and Dent du Marais appears to be related to the extensional F4 faults. This tectonic model can furthermore be extrapolated to the regional scale of the Monts Dore massif.
The analysis also emphasizes the major tectonic role of the secondary F4 and F6′′ faults in triggering and driving the large slow-moving landslide of Champsiaux-Berlaire (Chambon-sur-Lac).
Finally, this study provides new insights into the understanding of regional seismic activity. It particularly highlights the structural importance of the dextral strike-slip fault Croix-Morand–Murol Fault (CMF). The 2021–2022 seismic crisis may thus be an indicator of the tectonic activity of this fault system and its underlying hydrothermal dynamics.
Acknowledgments
This work is based on the Master 1 project of Ludovic Chender, carried out between April and June 2023 and publicly presented on 9 June 2023 at the Observatoire de Physique du Globe de Clermont–Ferrand (OPGC), within Université Clermont Auvergne. The manuscript was subsequently substantially revised and expanded as part of the doctoral thesis of Ludovic Chender. The authors also thank the anonymous reviewer for their constructive comments and suggestions, which significantly improved the quality of the manuscript. This is contribution no 744 of the ClerVolc program of the International Research Center for Disaster Sciences and Sustainable Development of the University of Clermont Auvergne.
Declaration of interests
The authors do not work for, advise, hold shares in, or receive funds from any organization that could benefit from this article, and have declared no affiliations other than their research organizations.
Supplementary materials
Supporting information for this article is available on the journal’s website under https://doi.org/10.5802/crgeos.326 or from the author.
It can also be accessed from the following GitHub repository: https://github.com/regthiery/morphoChambonLake.