

 CC-BY 4.0
1. Introduction
The Notre-Dame de Paris Cathedral is one of the architectural masterpieces of the Middle Ages. While the oak framework dates mainly from the late 12th century, a neo-Gothic spire was built in 1859. During the tragic fire of April 15th 2019, this spire collapsed and the framework was almost completely burnt down. Three large holes were formed in the vault (Figure 1). However, the greater part of the limestone structure and, in particular, the two bell towers were saved, in extremis.
(a) Openings in the vault located in the nave and in the crossing, showing carbonized oak beams (red arrow) and the steel scaffolding (installed around the spire before the fire) deformed by the high temperatures. (b) Opening in the north transept (photos by Damien Deldicque and Jean-Noël Rouzaud).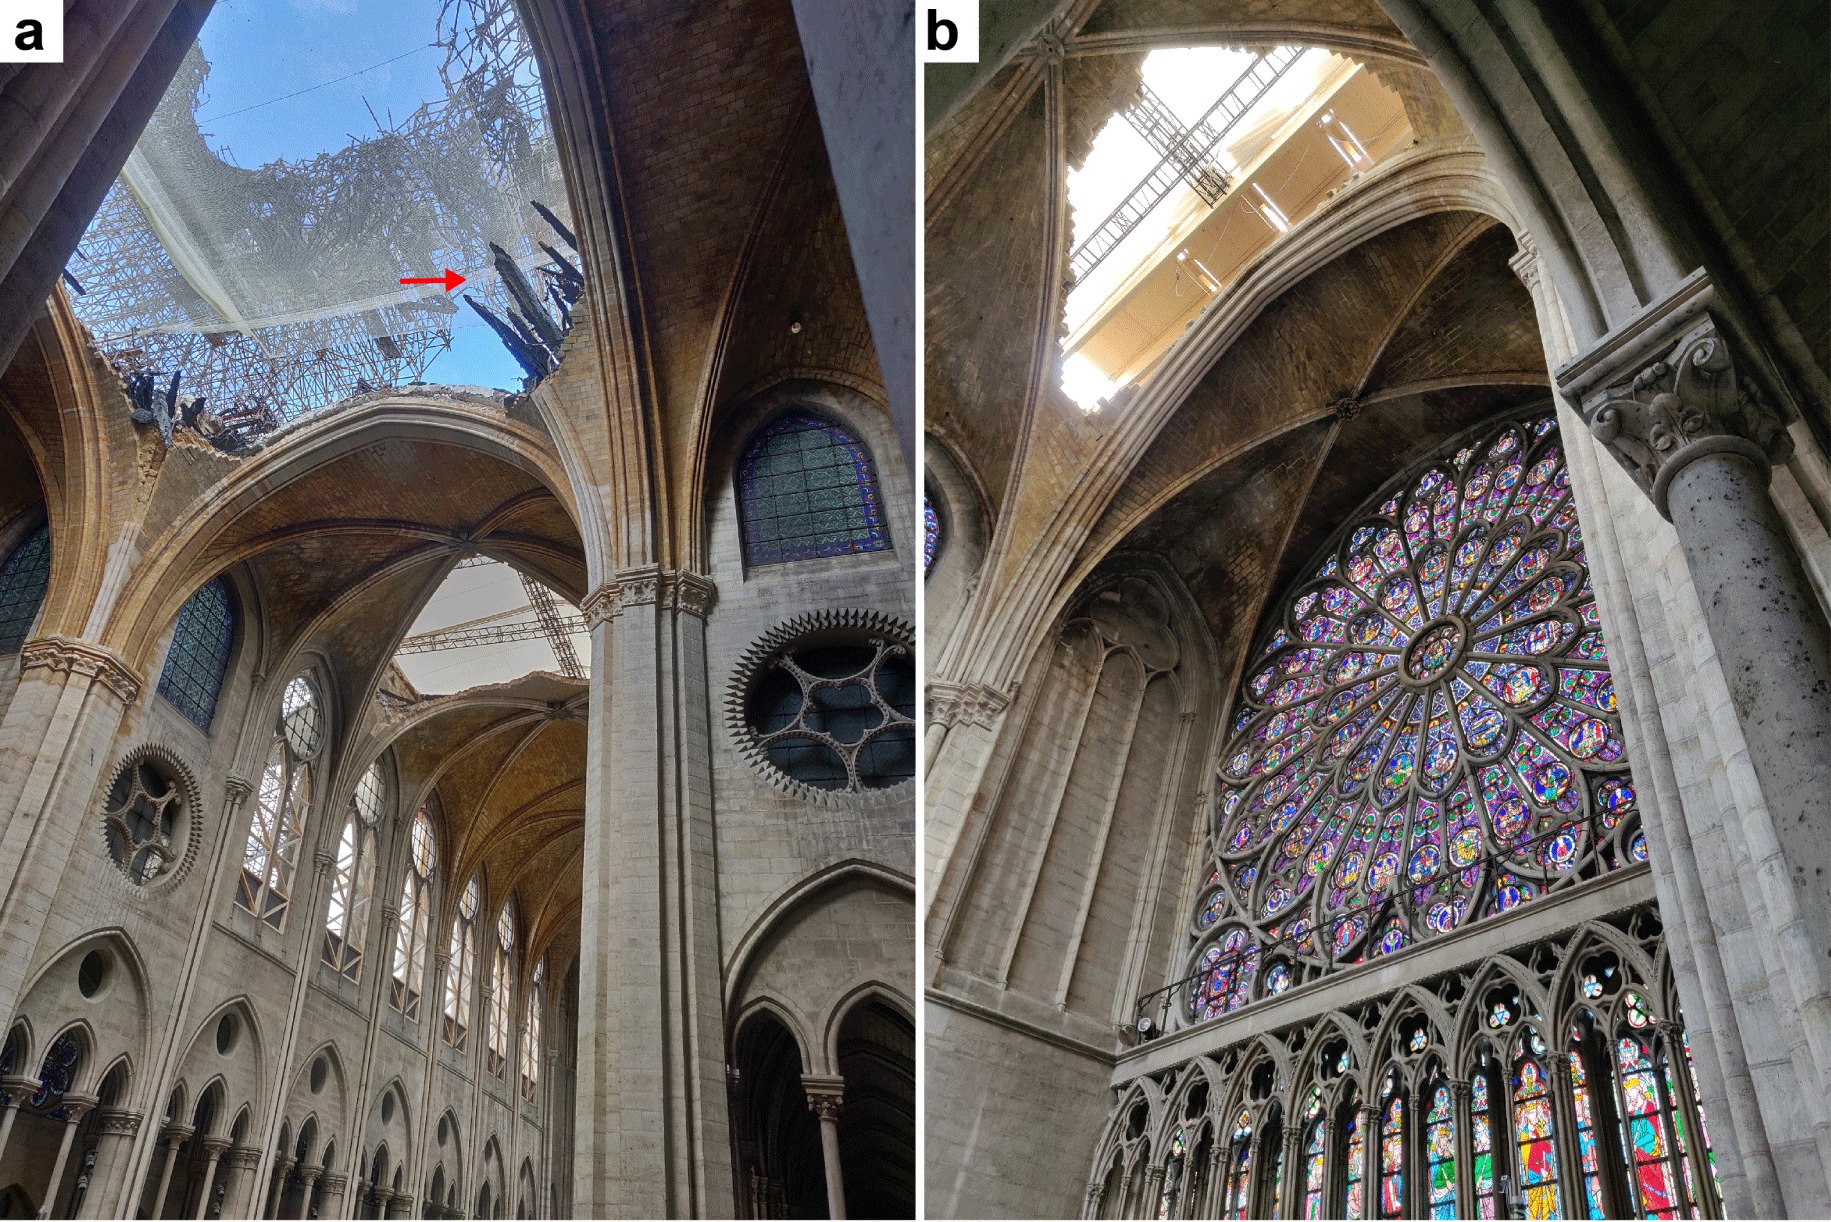
To date, the investigation has not yet been able to determine with certainty the origin of the fire. Nevertheless, the history of this tragic event has been accurately traced. A retrospective can be found in Gallet [2019]. However, one essential parameter – the temperature of the fire – could not be determined as no measurements (with thermocouples or pyrometry) were made during the fire. Extremely high temperatures (up to 2000–2500 °C) were sometimes mentioned at the time of the disaster or during the days that followed, without any scientific basis. The estimates of the temperatures that reigned in different parts of the building were essential questions not only for the judicial investigation but also for the management of the Notre-Dame reconstruction project. The uncertainties included whether lead from the roofs could have vaporized, thereby polluting the building and the neighbourhood. Moreover, even after the fire was extinguished, the saved structure appeared extremely fragile, and a complete collapse, especially of the vault, might be feared. In limestone rocks subjected to high temperatures, the physical and mechanical properties are modified. The decarbonation of limestone (CaCO3) into lime (CaO) is assumed to be accompanied by a loss of mechanical strength. The thermal alteration of limestone properties has been the subject of several studies in recent years [Gonz’alez-G’omez et al. 2015, Idris et al. 2018, Ozguven and Ozcelik 2014, Vigroux et al. 2019]. One of the most comprehensive and innovative studies is that of the rubefaction and subsequent softening of limestone walls in caves due to the effect of fires. These phenomena have been quantitatively evaluated in the Chauvet Paleolithic cave and in the “analogous” cave of Lugasson [Ferrier et al. 2014, Mindeguia et al. 2013] to verify whether such softening could have facilitated the execution of parietal works (paintings and engravings).
Obviously, determining the temperature of an experimental fire is easy when this is based on thermocouples placed in or near the fire source. The challenge is to perform such temperature measurements without thermocouples and on sites of extinguished fires. This is now possible thanks to the development of a method of “Raman paleothermometry” applied to charcoals remaining after the fire has been extinguished [Deldicque et al. 2016]. The principle of the method can be briefly summarized as follows. During carbonization, at between 400 °C and 1300 °C, the organic molecules of the precursors (wood, bone, etc.) become aromatic and the size of the resulting polyaromatic layers significantly increases with temperature, up to a few nanometres, and is irreversible, i.e. this depends on the maximum temperature reached. The shape of the Raman spectra of the charcoals, and especially the intensity of their two main bands (D and G), is extremely sensitive to the polyaromatic layer growth [Ferrari and Robertson 2000] and therefore to the carbonization range [Bény and Rouzaud 1985, Bernard et al. 2010, Deldicque et al. 2016, Ishimaru et al. 2007]. Increasing temperature results in a growth of the D-band of around 1350 cm−1. The height ratio (HD∕HG) of the D-band to the G-band (at 1581 cm−1) increases monotonically and irreversibly with heat-treatment temperatures (HTT) up to 1300 °C [Deldicque et al. 2016, Rouzaud et al. 2015]. Reference curves were constructed from pinewood heated to different temperatures from 500 °C to 1200 °C. The determination of the HD∕HG ratio on a charcoal sample thus makes it possible to determine the temperature of its formation with an accuracy of ±20 °C. Note that the growth of the polyaromatic layers is an irreversible phenomenon, so this Raman ratio does not decrease, even during cooling and thus records the maximum temperature. The HD∕HG ratio is therefore a paleothermometer. It was validated on experimental fires equipped with thermocouples, whose data were in excellent agreement with those obtained by Raman paleothermometry on charcoals collected from fire sites after fire extinction [Rouzaud et al. 2015]. This method of Raman paleothermometry is explained in detail in Deldicque et al. [2016].
Raman microspectrometry is now an extremely useful tool in archaeometry [Deldicque et al. 2016, Jaubert et al. 2016, Medina-Alcaide et al. 2019, Rouzaud et al. 2015]. In particular, Raman paleothermometry has been successfully applied to traces of Paleolithic fires from the Tautavel cave dated back to more than 550,000 years (Deldicque et al. submitted) and the Chauvet cave dated back to 36,000 years [Deldicque et al. 2016, Rouzaud et al. 2015]. In addition to archaeometry, Raman paleothermometry is also successfully used in experimental geosciences, for instance, to determine the temperatures reached on the surfaces of seismic faults recreated in uniaxial presses to simulate earthquakes in the laboratory [Aubry et al. 2018].
The objective of this study is to show that Raman paleothermometry is probably the only method to date, capable of giving values of the temperatures to which the framework and vaults of Notre-Dame have been subjected after the complete extinction of the fire. First, we present the experimental precautions taken to ensure the reliability of our measurements, including the realization of a calibration curve constructed from Notre-Dame oak charcoal samples. We give the maximum temperatures obtained on the first sampling of about 50 charcoals collected in situ only a few days after the Notre-Dame fire. An initial mapping makes it possible to specify the areas of the choir, a priori, the most thermally altered. On the basis of these original experimental data, we propose some preliminary indications of the diffusion of lead during the fire, as well as of the possibility to assess more precisely the temperatures experienced by the limestone structure of the monument, and any possible subsequent thermal and mechanical alterations.
2. Experimental set-up
2.1. Review of the Raman paleothermometry method
Deldicque et al. [2016] showed that the carbonization process is mainly governed by the highest treatment temperature (HTT). However, the carbonization process also depends on kinetics. The longer the exposure time at the highest temperature, the higher the degree of carbonization. The time at HTT has a small but noticeable influence on the Raman spectra and the HD∕HG Raman ratio. The higher the HTT, the smaller this kinetic effect. For example, it takes 6 h at HTT for a pine or poplar charcoal to reach its stable nanostructure (i.e. the maximum HD∕HG Raman ratio) for temperatures ranging from 500 °C to 900 °C, whereas it takes only 1 h at higher temperatures.
In the case of logs burning in an open fire, the combustion reaction progresses from the outside to the core. The flames have a double effect: (i) they burn the surface of the wood, which is combustion in air; (ii) they heat the piece of wood with a thermal gradient, where the maximum temperature occurs just behind the flame front. When this outermost part is burning and due to the extremely high reactivity of the wood with air, the oxygen atoms in the air are immediately combined with the active sites to form CO2 and H2O and some hydrocarbons. As a result, oxygen cannot penetrate the inside of the log that is pyrolysed by the heat front behind the flame, i.e. into an oxygen-free atmosphere. In fact, everything happens as if the heat treatment of this unburnt part were carried out in an inert atmosphere. The remaining charcoals, collected after the extinction of the fire, were therefore pyrolysed in the absence of air. This justifies the use of laboratory pyrolysis in an argon atmosphere to simulate the formation of these charcoals. A cross-section of a partially burnt piece of wood from Notre-Dame is shown in Figure 2. The charcoals preserved from combustion are located in the outermost part of the piece.
Cross-section of a partially burnt piece of wood. A carbonized crown surrounds the intact core. Indicated temperatures were determined by Raman paleothermometry (see Section 2.2).
Therefore, the maximum temperatures will be found on the outer surface, i.e. just behind the flame front. This surface is frequently highlighted by traces of white ash (usually silicates and carbonates from wood combustion). In the case of a fire, determining how long wood has been subjected to the maximum temperature is not an easy task. Because the flame front is advancing rapidly, it is unlikely that the charcoal formed just behind it will be heated at HTT for a long period of time. For this reason, a 1-hour plateau at HTT was chosen first. However, to simulate possible longer temperature exposures, carbonizations with 6-hour stages were also carried out.
2.2. Construction of calibration curves for Raman paleothermometry dedicated to Notre-Dame oak charcoals
Initially, the Raman paleothermometry method was developed for softwoods such as pine and poplar. Deldicque et al. [2016] showed that the effect of the nature of these two wood species was negligible. Pine and poplar charcoals formed at a given temperature both produced very similar Raman spectra and therefore the same HD∕HG ratio. However, since the roof structure of Notre-Dame is made of oak and considering that this is a hardwood, a calibration curve was constructed by making new laboratory charcoals from oak. A piece of oak wood was sampled from an unburnt beam of Notre-Dame. Thus, a series of oak charcoals was manufactured using a tubular furnace with a controlled atmosphere, every 100 °C, from 500 °C to 1300 °C with an argon flow to keep them protected from oxidation. Two residence times at the highest temperature were chosen: 1 h and 6 h.
2.3. Sampling of charcoals in the Notre-Dame de Paris Cathedral
As a result of the fire, the spire, the crossing, the roof of the north transept and part of the nave collapsed, causing three large openings to appear in the vault (the largest hole is shown in Figure 1a). Below these collapses, an accumulation of burnt beams and rubble formed (Figure 3). Centimetre-sized charcoals were sampled in May and June 2019 under each structure of interest (transept, nave and crossing; Figure 4).
(a) Carbonized beams under the opening of the nave (photo by Damien Deldicque and Jean-Noël Rouzaud). (b) Sampled charcoals.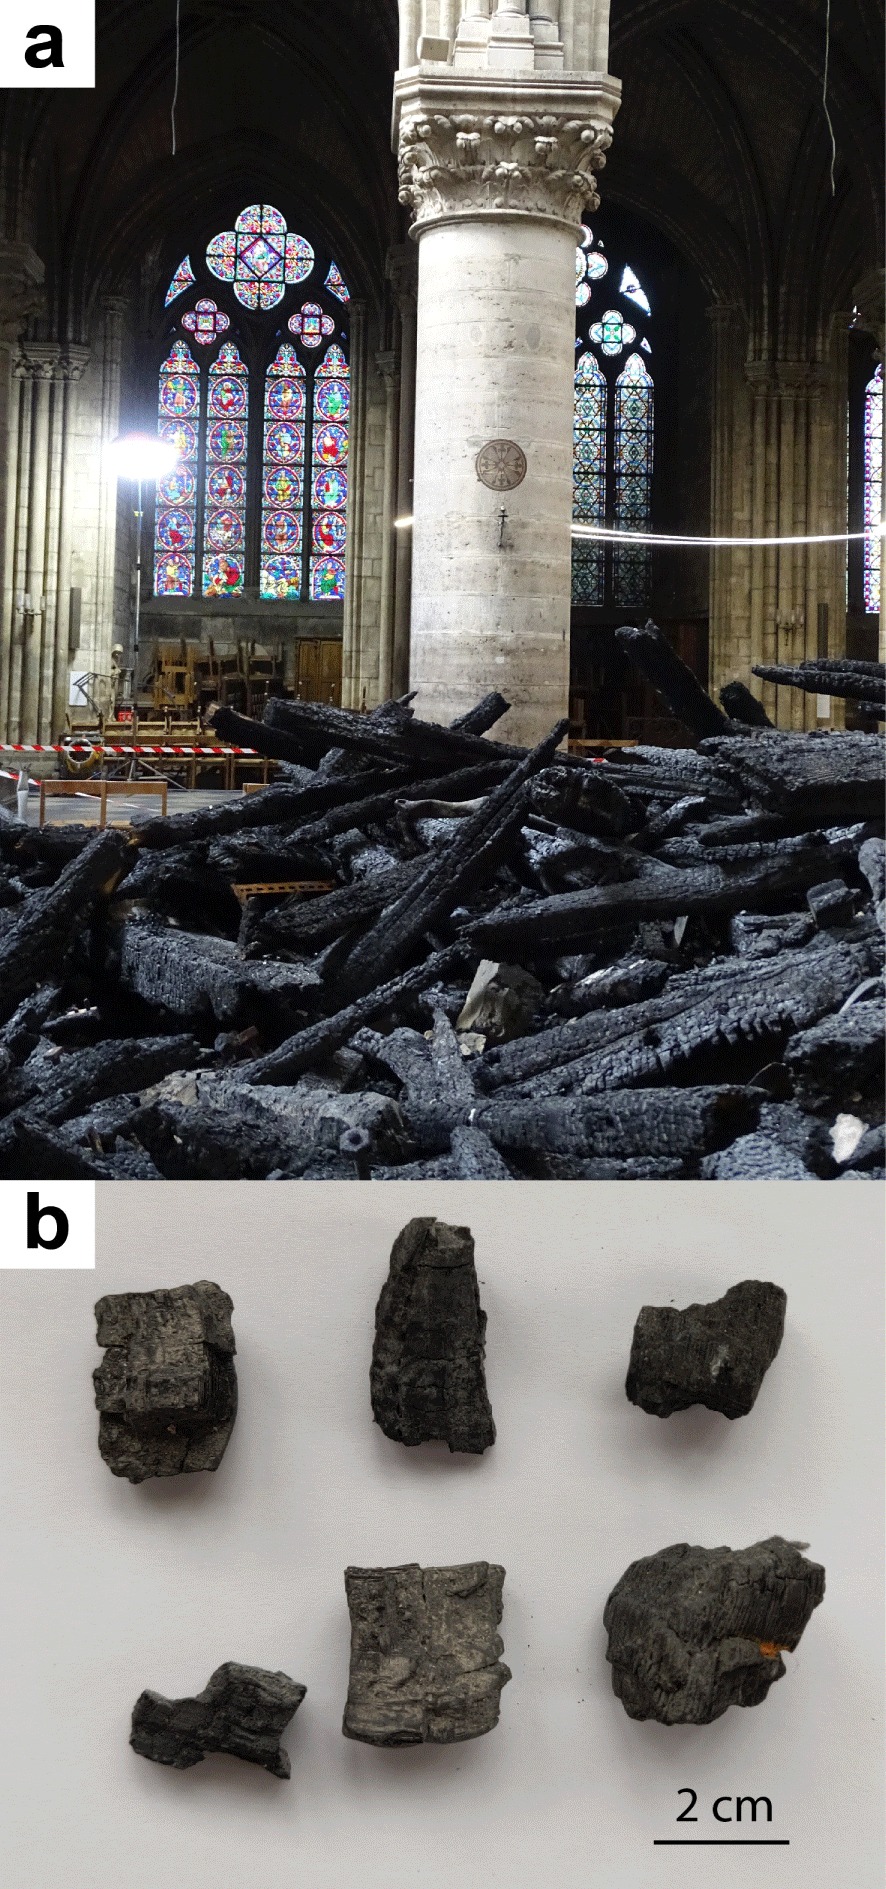
Ground plan of Notre-Dame de Paris.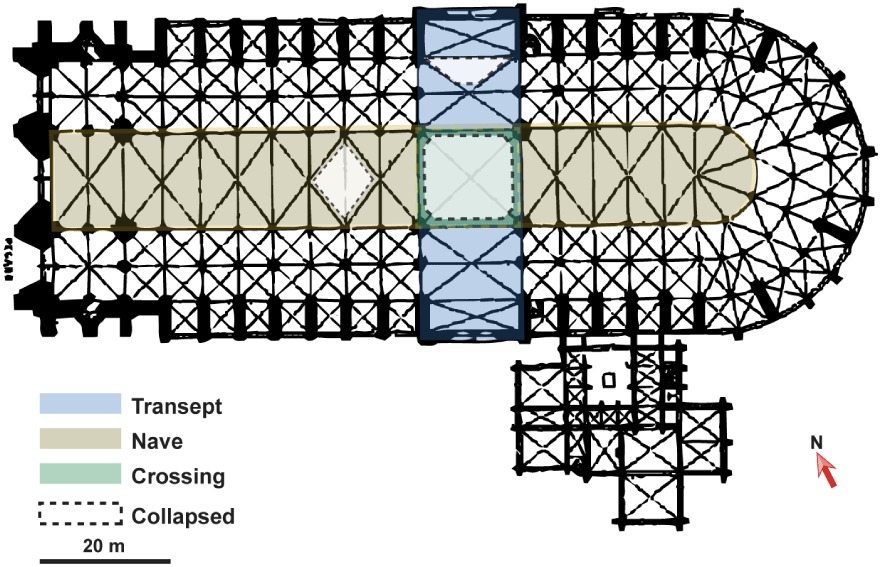
2.4. Raman measurements on charcoals
The charcoals were analysed by a Renishaw InVia Raman microspectrometer equipped with a 50 mW Fandango diode laser. Its wavelength is 514 nm. The acquisition time was 180 s and the power was maintained at 1% of the nominal power to avoid any alteration of the sample due to the laser. All spectra were acquired between 600 and 2000 cm−1 to focus on the first-order Raman scattering of the carbonized material [Bernard et al. 2010]. Each spectrum was background-corrected to eliminate the fluorescence signal. A linear baseline was drawn between 600 and 2000 cm−1. In Deldicque et al. [2016], it was shown that the value of the intensity ratio ID∕IG of the D-band (at about 1350 cm−1) to the G-band (at about 1581 cm−1) depends on the deconvolution method and does not allow a linear monitoring of the carbonization process. This is why the measurement of the band height, independent of any deconvolution mode, was chosen. The HD∕HG ratio, i.e. the height ratio of the D-band to the G-Raman band was calculated. The heights of the D and G bands were measured, without any fitting, from their peak maxima measured orthogonally to the baseline. Thus, the obtained HD∕HG ratio increases continuously across the whole carbonization field (500–1200 °C). To plot the calibration curves, 10 spectra were recorded for a given sample and a given temperature. An arithmetic mean value of the HD∕HG ratio was calculated. The dispersion of the HD∕HG ratios for a given experimental HTT results in a dispersion of the temperatures on the calibration curve. The temperature dispersions are determined from the minimum and the maximum values of the height ratios for each calibration point.
Raman spectra of experimental charcoals obtained from oak wood heated in an argon atmosphere from 500 to 1300 °C; residence time: 1 h. The height of the D-band increases with the carbonization temperature. (a) Raw spectra normalized by the G-band intensity; note, for the spectra obtained for the lowest temperatures (<800 °C), the presence of weak fluorescence (responsible for a slight tilt of the baseline) and a small shoulder to the right of the D-band (arrow on Figure 5b); (b) background-corrected spectra, normalized by the G-band intensity.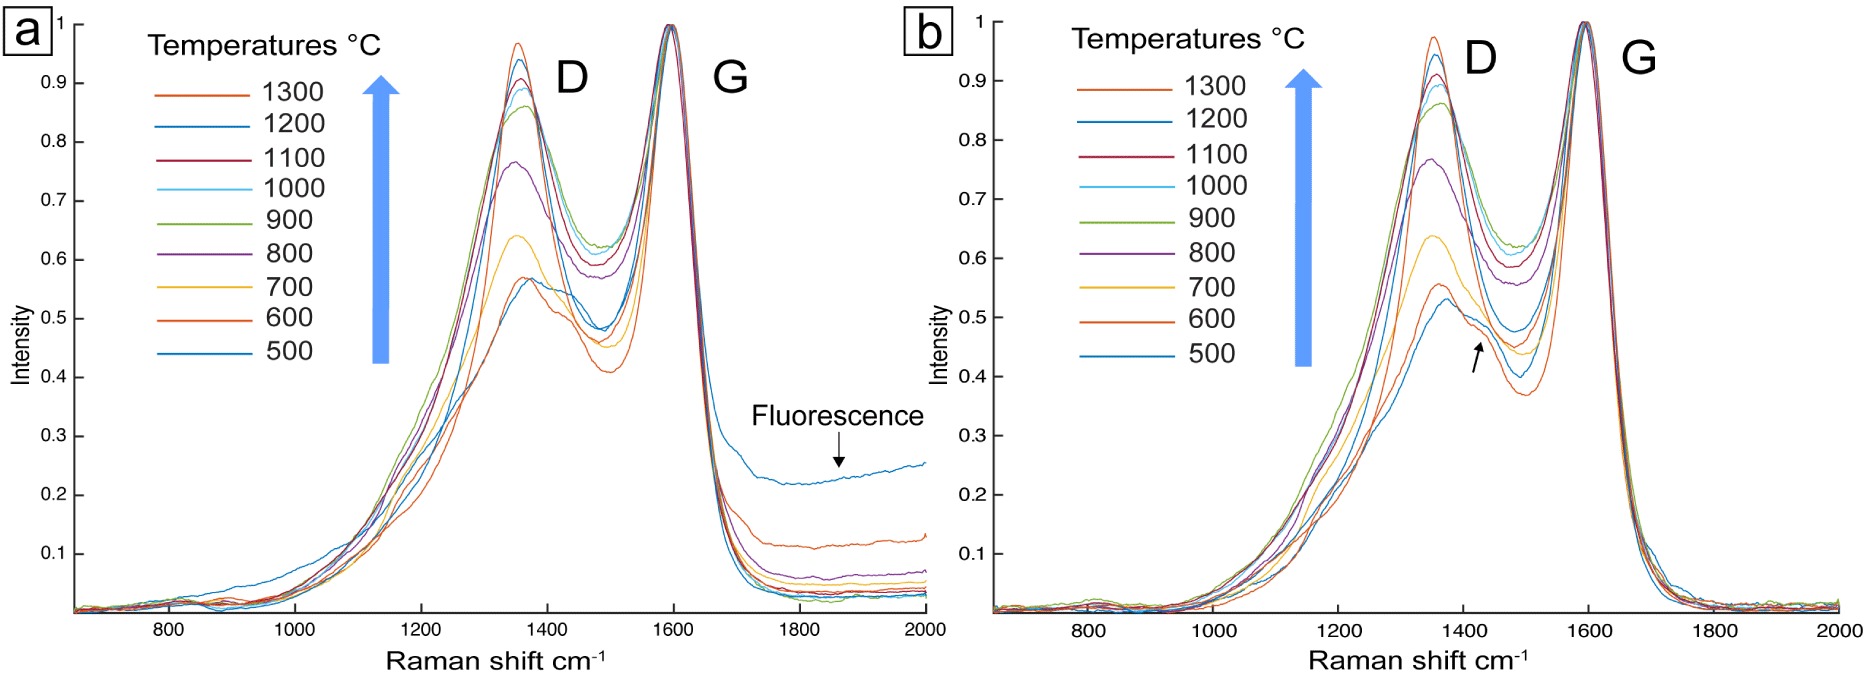
Between 15 and 20 charcoals were measured for each sampled area of the cathedral (the nave, the crossing and the north transept). As explained previously, Raman spectra were recorded first on the outermost parts of the charcoals, which potentially recorded the highest temperatures. These parts are easily identifiable as they contain microfragments of ash from wood combustion. Second, cross-sections were carried out on the charcoals with the highest HD∕HG ratio and 30 additional spectra were recorded on each one of these surfaces. The mean value obtained then gives the highest ratio per zone, and a standard deviation was calculated. The latter values correspond to the highest temperatures to which the different parts of the cathedral were submitted.
3. Results
3.1. Calibration curves for paleotemperature measurements
The spectra of the experimental charcoals for the different carbonization temperatures, from 500 °C to 1300 °C, and 1 h residence time are shown in Figure 5a. First, fluorescence, clearly present at temperatures below 800 °C, affects the measurement of the HD∕HG ratio. To treat the spectra correctly, its contribution was simply eliminated from the spectra by using horizontal baselines (Figure 5b). All spectra show the two Raman D and G bands characteristic of all carbon-based materials [Bernard et al. 2010, Deldicque et al. 2016, Ferrari and Robertson 2000, Bény and Rouzaud 1985]. As expected, the height of the D-band increases with the carbonization temperature. In the spectra corresponding to charcoals obtained at temperatures below 700 °C, a shoulder appears at about 1480 cm−1 (arrow in Figure 5b). Such a shoulder, systematically detected in oil and gas shales, is attributed to hydrocarbons trapped in the charcoal nanostructure [Romero-Sarmiento et al. 2014]. In charcoals, this could correspond to the heavy hydrocarbons formed during the wood pyrolysis [Deldicque et al. 2016].
A reference curve was constructed by plotting the carbonization temperatures as functions of the HD∕HG ratio for each residence time. The calibration curve obtained for a residence time of 1 h is shown in Figure 6. As expected, the HD∕HG ratio increases monotonically with temperature, confirming that it is a relevant parameter for unambiguously measuring the carbonization process. To return to the temperature to which a carbon has been subjected, one simply plots the HD∕HG ratio measurement on the calibration curve.
Calibration curve of experimental charcoals obtained from oak wood heated in an argon atmosphere to between 500 and 1300 °C; residence time at HTT: 1 h.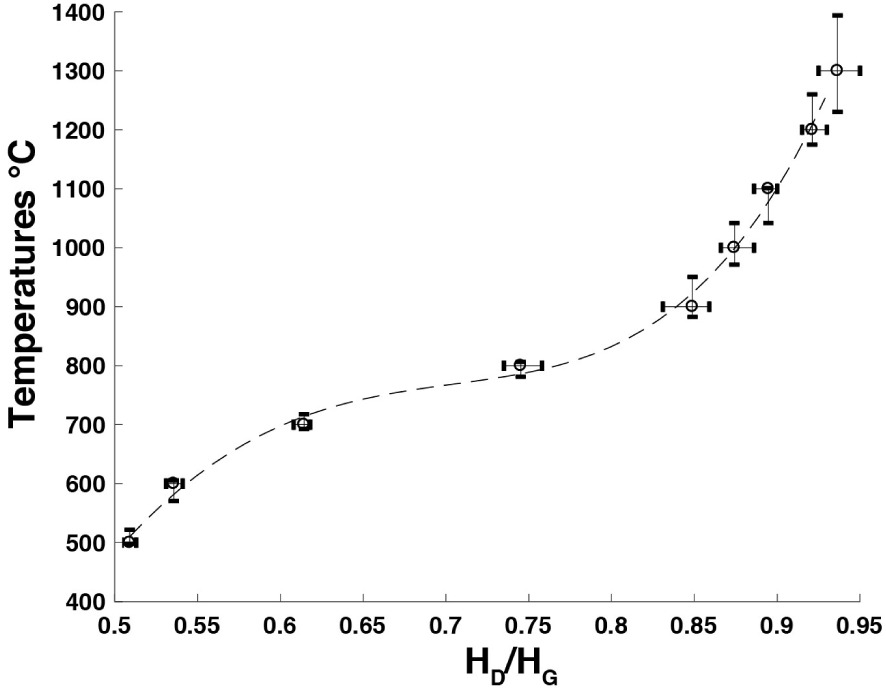
As already observed for other wood precursors such as pine and poplar [Deldicque et al. 2016], the residence time has only a small effect in the 500–800 °C temperature range. As seen in Figure 7, the curves for 1 h and 6 h residence times become superimposed above HD∕HG > 0.8, i.e. for temperatures higher than 800 °C, and the effect of the residence time at HTT becomes negligible.
Calibration curves of experimental charcoals obtained from oak wood heated in an argon atmosphere to between 500 and 1300 °C; residence times at HTT: 1 h (blue plot) and 6 h (red plot).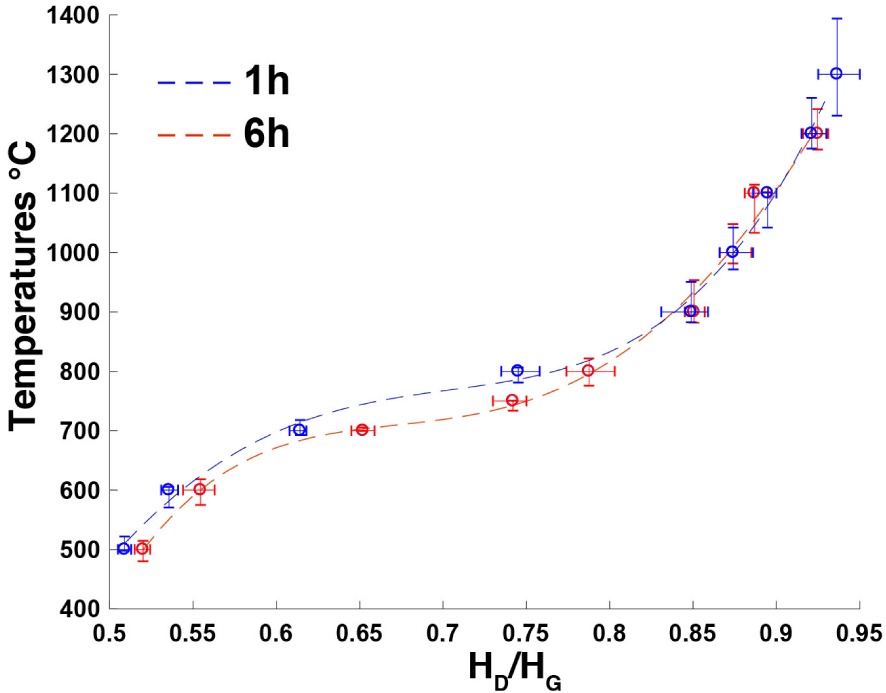
The dispersion of the HD∕HG values and thus of the corresponding temperatures is of the order of ±15 °C up to 800 °C. It then increases: ±30 °C to 1100 °C to reach ±40 to 1200 °C and ±80 to 1300 °C, where the slope of the calibration curve increases.
3.2. Charcoals from Notre-Dame Cathedral – paleotemperatures and preliminary mapping
The temperatures measured with the Raman paleothermometer applied to the Notre-Dame charcoals are in the range of 500 °C to 1300 °C. All temperatures were determined by plotting the HD∕HG ratio on the 1 h calibration curve. The data of all the samples are shown in Figure 8.
Retrieved paleotemperatures from the HD∕HG ratios in the crossing (green dots), the north transept (blue dots) and the nave (khaki dots).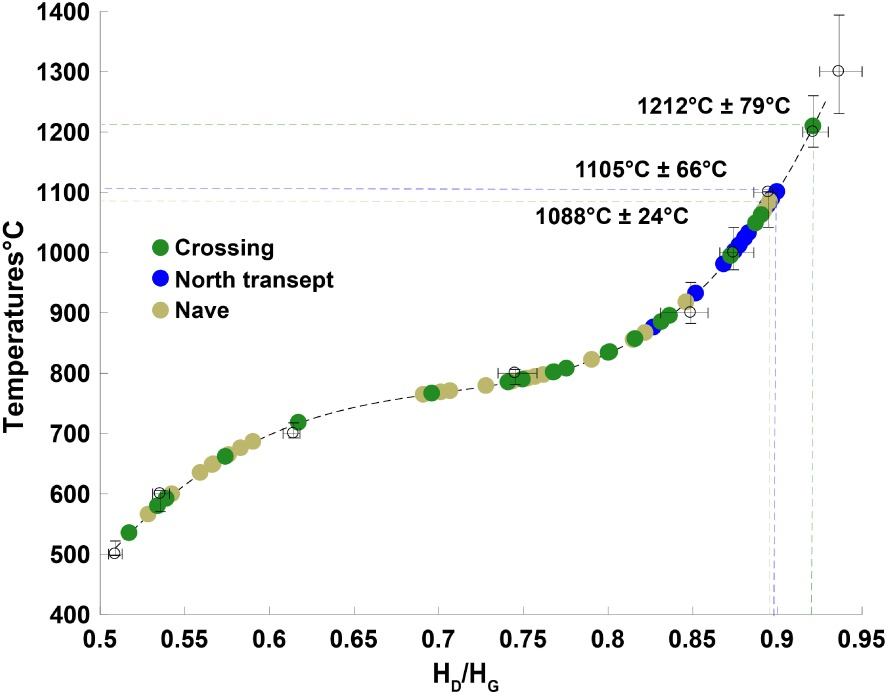
The highest maximum temperature (1212 ± 79 °C) of this series of samples from Notre-Dame Cathedral was detected in the crossing. In the nave and in the northern transept, the highest maximum temperatures are 1088 ± 24 °C and 1105 °C ± 66 °C, respectively. Cross-sections of the hottest charcoals giving the highest temperatures for each area of the cathedral are shown in Figure 9. A total of 30 spectra were generated covering the entire surface of these sections. The standard deviations are in good agreement with the dispersion of the calibration curves, making these charcoals relevant paleothermometers.
Cross-sections of the hottest charcoals from the crossing (a), the nave (b) and the north transept (c) with corresponding paleotemperatures. The temperatures were determined with 30 Raman spectra recorded on each section.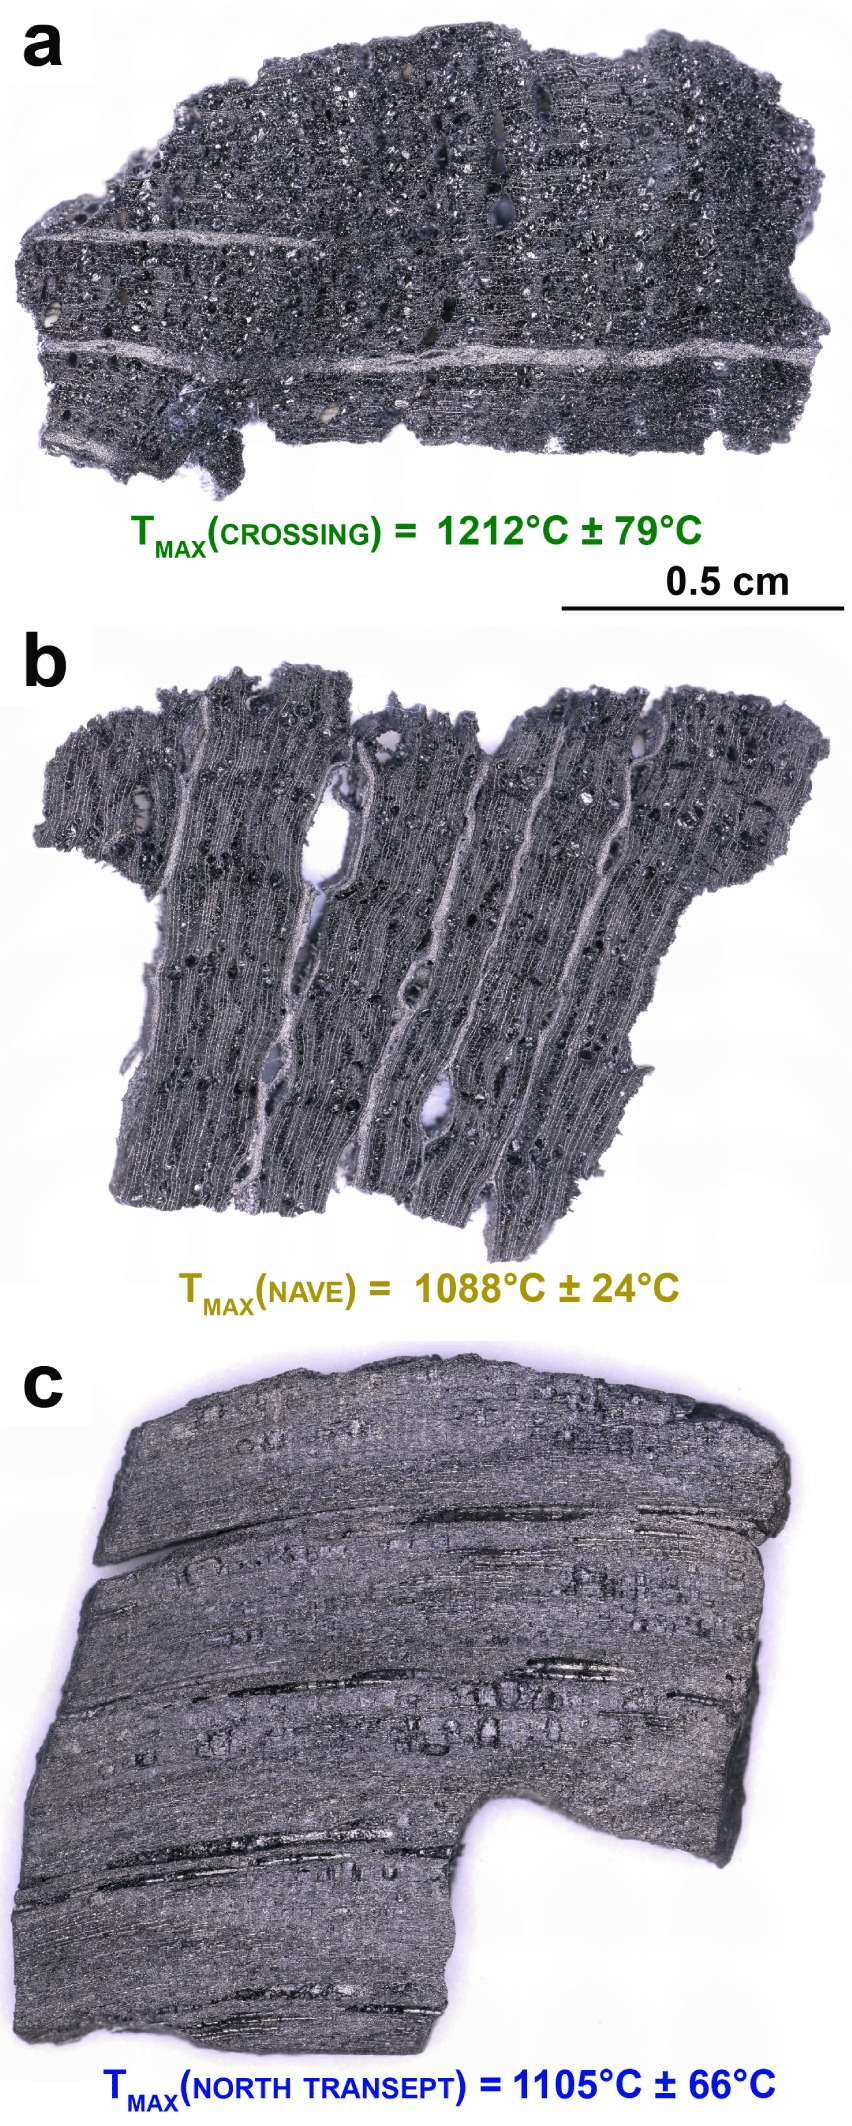
These measurements make it possible to carry out an initial mapping of the temperatures to which the different parts of the cathedral were subjected by the fire (Figure 10).
Initial temperature mapping of Notre-Dame de Paris Cathedral. Highest temperatures (in red) reached in the nave, the north transept and the crossing.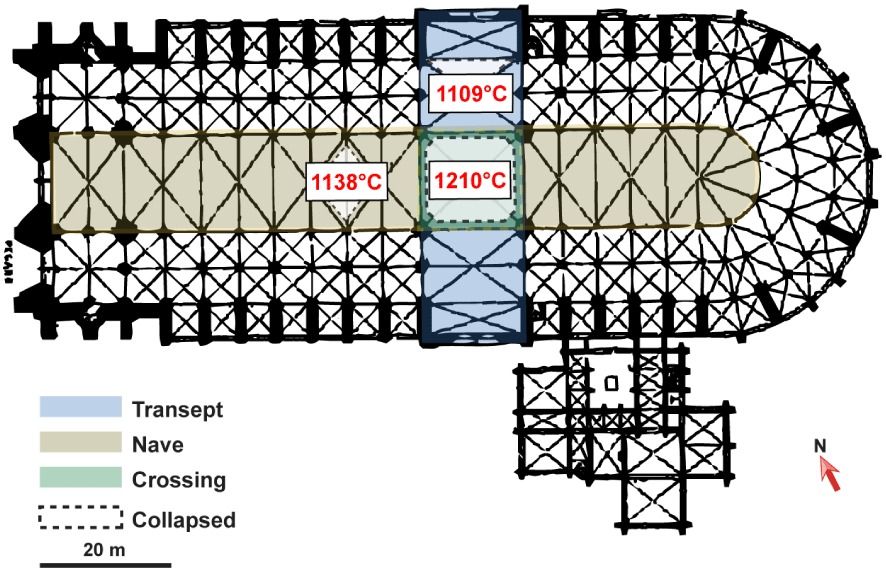
4. Discussion
The objective of this work is to show the temperatures to which the oak frame of the cathedral was subjected and, if possible, to find the places where the temperatures were the highest. To our knowledge, no measurements were made during the fire. Only a few journalistic estimates of above 2000 °C were issued without any scientific basis, as reported by Gallet [2019]. To achieve the objective of estimating the temperature, the Raman paleothermometry method was tested [Deldicque et al. 2016].
This original method is the only one, to our knowledge, that can yield temperatures after fire has been extinguished (i.e. paleotemperatures) in the range of 500–1300 °C. Indeed, this paleothermometer had already been successfully applied to pine-based experimental charcoals, similar to those found in Paleolithic pine fires [Deldicque et al. 2016, Rouzaud et al. 2015].
This pioneering work shows that the maximum temperature is the most important parameter in the evolution of Raman spectra during heat treatment. The nature of the wood species and the residence time at HTT were found to be secondary parameters. However, in the present work, the Raman paleothermometer was recalibrated with oak wood, and two different residence times, 1 h and 6 h, were tested to be applicable to Notre-Dame charcoals. New calibration curves were generated from a piece of unburnt oak from the cathedral itself.
The effect of the residence times becomes negligible for temperatures above 800 °C (Figure 7). However, the dispersion of the measurements increases with temperature: ±15 °C up to 800 °C, ±40 °C to 1200 °C and ±80 °C to 1300 °C.
The maximum temperatures obtained on Notre-Dame charcoals with this paleothermometry method vary between 500 and 1300 °C. These values are in good agreement with the temperatures measured in situ using thermocouples placed in eucalyptus forest fires [Mueller et al. 2018, Wotton et al. 2012] where the temperatures did not exceed 1100 °C, although these species are highly flammable. The results also agree well with the experimental models [Ferrier et al. 2014, 2015, 2017, Lacanette et al. 2017, Salmon et al. 2018, 2020]. The results therefore invalidate temperatures above 2000 °C, which have been mentioned in certain hasty journalistic statements. However, these high temperatures are compatible with the softening and deformation observed in the steel scaffolding installed around the spire before the fire (Figure 11). Indeed, the steel deforming temperature lies between 1050 °C and 1300 °C [Angelescu et al. 2018].
Steel scaffolding (surrounding the spire before the fire) deformed by the high temperatures (photo by Damien Deldicque and Jean-Noël Rouzaud).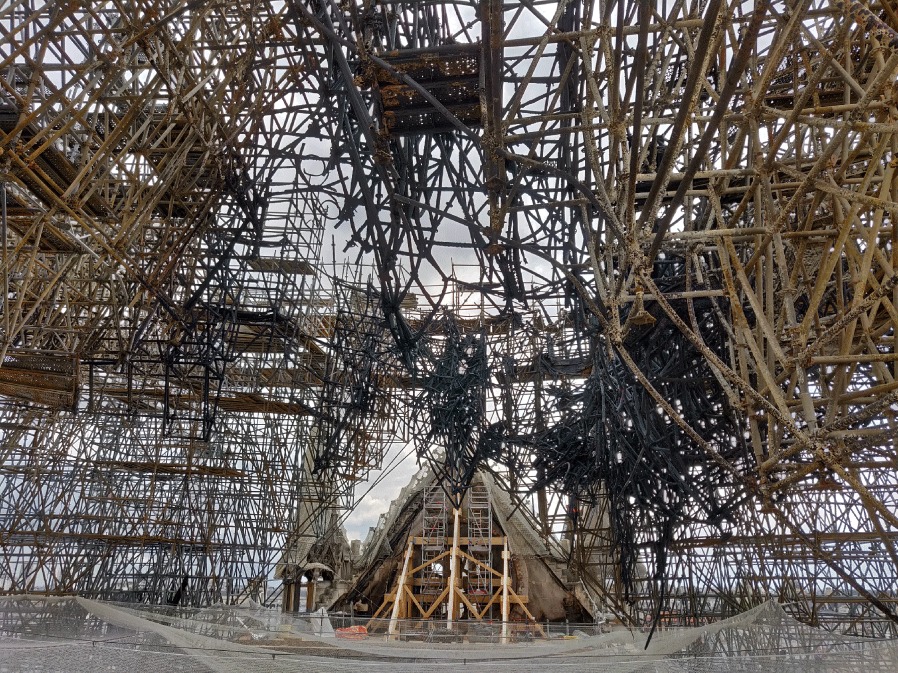
With respect to temperature mapping, however, one uncertainty is due to the charcoals being collected in collapses beneath the structures of interest and not sampled directly in or on the structures themselves. Furthermore, it cannot be totally excluded that during the firefighting operation, collapses and water jets might have transferred charcoals from one area to another. Although an accurate and error-free temperature mapping is probably illusory, this study has one great advantage: the maximum temperatures reached during the fire of the cathedral can be determined with a good degree of accuracy. These results probably have consequences for securing disaster areas and for evaluating different reconstruction methods.
First, the highest temperatures found, i.e. 1212 ± 79 °C, provide information on the physical state of lead from the roof and its possible diffusion inside and outside the cathedral. Such temperatures allowed lead to reach its melting point (330 °C) as evidenced by the numerous resolidified flows of liquid lead visible on the walls of the cathedral after the fire. However, the highest measured temperatures are significantly lower than the lead evaporation temperature (1740 °C). The lead pollution found in the Notre-Dame area cannot therefore be due to the evaporation of lead sensu stricto. However, an aerial migration of lead nanoparticles (“aerosols”) can also be considered. Metal nanoparticles such as lead oxides could have formed during the fire. In addition, it is not excluded that lead could also come from corrosion and leaching of lead in the cathedral roofs before the fire. It could then have migrated in the form of carbonates, hydroxides, etc. Finally, sources of lead external to the cathedral (plumbing, painting, etc.) cannot be completely excluded either. Systematic studies (mineralogical, isotopic, etc.) carried out by specialized teams are therefore required to characterize the traces of lead found in the neighbourhood and thus to shed light on their origin.
A second question may be discussed based on these Raman paleothermometry results. High temperatures have an effect on the physical and mechanical properties of rocks [Vigroux et al. 2019]. As a result of thermal stress, microcracks form within the rock, contributing to an increase in porosity, a reduction in density and consequently to a loss of strength. This occurs from 300 °C and becomes critical at 600 °C for limestone [Gonz’alez-G’omez et al. 2015, Idris et al. 2018, Ozguven and Ozcelik 2014, Vigroux et al. 2019]. These temperatures were largely reached in the Notre-Dame fire since it appears to frequently have exceeded 1000 °C, at least in the studied areas. In addition, these high temperatures exceed the 900 °C required to decarbonate limestone (CaCO3) to produce lime (CaO) [Vigroux et al. 2019]. Lime is a fragile product, possibly powdery, which entails a significant risk of cracks and decohesions between healthy limestone and calcined limestone. As a result of such alterations, the ability of limestone to absorb water increases, especially after exposure to temperatures above 600 °C [Ozguven and Ozcelik 2014]. This must be seriously taken into account especially as these heated limestones were abundantly watered during the extinguishing of the fire. Such thermo-alterations, even superficial, could have played an important role in the mechanical resistance of the limestone framework of the cathedral. They could even have contributed to the collapses of the vault during the fire. In particular, the collapse of the spire might have been caused not only by the effect of the fire on the spire itself but also by the loss of strength of the limestone beneath.
These thermal and possible aqueous alterations present potential dangers of subsequent collapses after the extinguishing of fires, especially in areas subjected to the highest temperatures. A more complete temperature mapping by Raman paleothermometry should guide specialists in thermal alterations of limestone and project managers to better constrain these phase changes to forecast the consequences for the integrity of the damaged building. The charcoals located inside, or in the immediate vicinity of, the stone are true “fossil thermocouples”. Sampling them would certainly be beneficial for measuring the temperatures to which the limestone blocks were subjected locally during the fire.
5. Conclusion
For the first time, Raman paleothermometry measurements provide estimates of the real temperatures recorded during fires by the charcoals of the Notre-Dame frame.
The great advantage of this method is that it provides relevant data about a fully extinguished fire. The charcoals can be considered to be true “fossil thermocouples”. The Raman paleothermometry method is thus a useful new tool dedicated to archaeometry.
The maximum temperatures of the blaze in Notre-Dame Cathedral were measured at various strategic places in the monument (transept, crossing and nave). The highest temperatures (up to 1212 ± 79 °C) were observed in the crossing, while temperatures above 900 °C were frequent in many other parts during the fire. These temperatures cannot support the sensationalist hypothesis of vaporization of roofing lead. However, they agree well with, at least, a superficial calcination of the limestone blocks in the cathedral structure, responsible for probable mechanical strength alterations.
This study made it possible to provide the first distribution of the maximum temperatures reached in different places in Notre-Dame. It presented solid experimental data, which should make it possible to better constrain the phase changes, in particular, with regard to lead and limestone. They could be a guide for specialists in thermal alterations of limestone and, more generally, help the manager of the Notre-Dame Cathedral reconstruction project.
Acknowledgements
The authors wish to thank very warmly the Direction of Works of the Notre-Dame Cathedral. Without their help, this study would not have been possible. Pascal Prunet, Chief Architect of Historic Monuments, trusted the authors to test the applicability of the Raman paleothermometry method. Therefore, he authorized them to take samples of charcoal from the fire in the oak frame. For this sampling, the advice of Véronique Verges-Belmin (in charge of “Le pôle Pierre”, Laboratoire de Recherche des Monuments Historiques, France) and Catherine Lavier (Direction Générale des Patrimoines, Ministère de la Culture et de la Communication) was invaluable in optimizing the sampling to obtain the most relevant samples.
Last but not least, special thanks are due to the Paris firefighters for saving as efficiently as possible the masterpiece and heritage of humanity that is the Notre-Dame de Paris Cathedral.