

1 Introduction
Analysis of the behaviour of cells in response to cell cycle specific antineoplastic agents is important to oncologists in order to improve cancer therapy by maximising cell killing while minimising normal cell toxicity. The observation of Howard and Pelc 〚3〛 that DNA replication takes place during interphase was the first evidence for an important biochemical event, essential for cell reproduction, which occurs outside mitosis. Thus, the cell cycle was subdivided into four consecutive phases: G1, S, G2 and M. It is important to get quantitative information about the proliferative characteristics, i.e. the fractions of cells in the G0/1, S and G2+M phases of the cell cycle as well as the fraction of actively proliferating cells. The rate at which the cells go through the cell cycle before and during drug treatment is of great interest for prognosis.
The aim of this paper is to compare the different aspects of cell kinetics assessment following nuclear or membrane labelling.
2 Nuclear labelling and cell cycle analysis
2.1 DNA content
2.1.1 Biological aspect
Evaluation of global DNA content is often determined by monoparameter analysis using fluorescent probes with stoichiometric nuclear labelling in order to obtain DNA content distribution in each phase. Intercalating dyes such as propidium iodide (PI), ethidium bromide (EB) or base pair-specific dyes such as mithramycin or Hoechst 33342 (Ho 342) are often used to quantify DNA content by flow cytometry (FCM).
2.1.2 Modelling
Several mathematical models have been developed to estimate the fractions of cells in G0/1, S and G2+M phases from DNA content distributions measured for asynchronously growing cells. They take into account for an accurate estimation of cell fractions in each cycle phase.
Two approaches based on mathematical models approximate S phase either as a rectangle (Fig. 1A) 〚4〛 or a succession of normal distributions (Fig. 1B) 〚4〛.
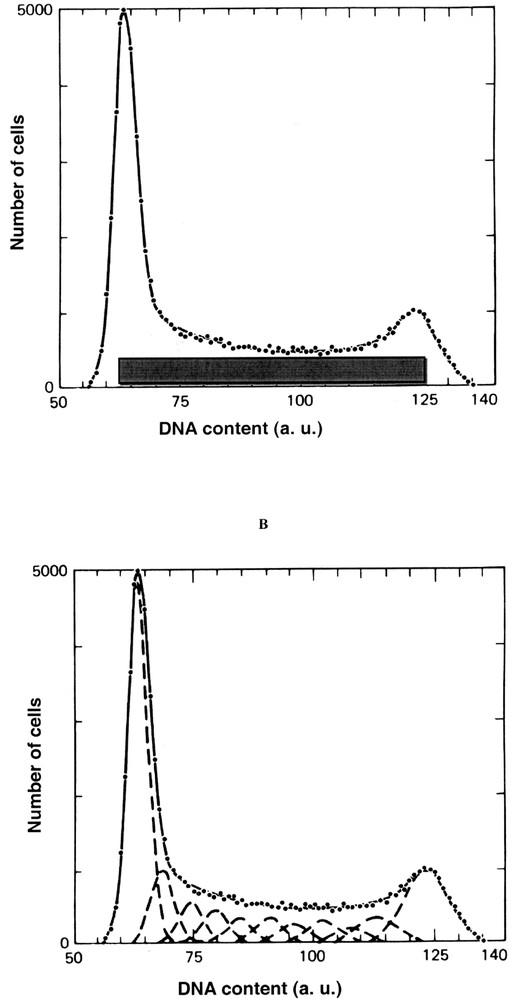
Mathematical modelling of DNA content. A. Rectangle method (2). The G0/1 and G2+M phases areas are estimated as proportional to the area to the left of the S phase distribution area to the right of the S phase distribution, respectively. B. Gaussian method (2). The G0/1 and G2+M peaks are represented by Gaussian (normal distribution) and S phase is represented by a second-degree polynomial broadened with the Gaussian function to account for measurement variability.
The rectangle method consists in drawing a straight horizontal line through the S phase between G0/1 and G2+M peaks. The G0/1 and the G2+M phases areas are estimated as proportional to the area to the left of the S phase distribution area and to the area to the right of the S phase distribution, respectively.
S phase could be also estimate using Gaussians represented by Fig. 1B. The G0/1 and G2+M peaks are represented by a Gaussian (normal distribution) and S phase is represented by a second-degree polynomial broadened with a Gaussian function to account for measurement variability. This procedure amounts to fitting S phase with a series of Gaussians, where the areas of the Gaussian are constrained to lie a second-degree polynomial.
2.1.3 Critical aspects
Monoparameter analysis of DNA content using PI requires cell fixation and elimination of RNA by enzymatic treatment. Cell fixation step can be eliminated using Ho 342, a vital dye specific for DNA that provides dynamic cell cycle analysis. However, Ho 342 can induce an accumulation of cells in G2 phase, depending on the cell type and cycle duration 〚5〛. In addition, Ho 342 is expulsed from chemoresistant cells expressing Glycoprotein-P-170 〚6, 7〛.
Both methods overestimate the G0/1 and G2+M phase fractions and underestimate the S phase fraction. In addition, the magnitude of the error is enhanced as fluorescence distribution variability (coefficient of variation) of G0/1 phase increases.
2.2 DNA content and BrdUrd analysis
2.2.1 Biological aspect
In order to improve the sensitivity of S phase detection, modified pyrimidine analogues can be incorporated into DNA and detected by fluorescence. These molecules include halogenated derivatives of thymidine such as 5-bromodeoxyuridine (BrdUrd), 5-fluorodeoxyuridine and 5-iododeoxyuridine (IdUrd). BrdUrd substitutes thymidine when DNA is synthesised by proliferating cells.
Several FCM methods have been developed for DNA-BrdUrd measurements, but the most widely used is the assay described by Dolbeare et al. and Gratzner et al. 〚8, 9〛 that combines PI DNA staining with immunofluorescent labelling of BrdUrd. This method requires cell fixation and partial denaturation of DNA by heat or acid treatment to reveal the incorporated BrdUrd molecules by monoclonal antibodies. Primary antibody is often revealed by indirect immunofluorescence using Fab’2 coupled to fluorescein isothiocyanate (FITC) dye and DNA with PI or Ho 342 dyes. Fig. 2 shows a typical multiparameter distribution displaying DNA content (X-axis) fluorescence associated to incorporated BrdUrd (Y-axis).
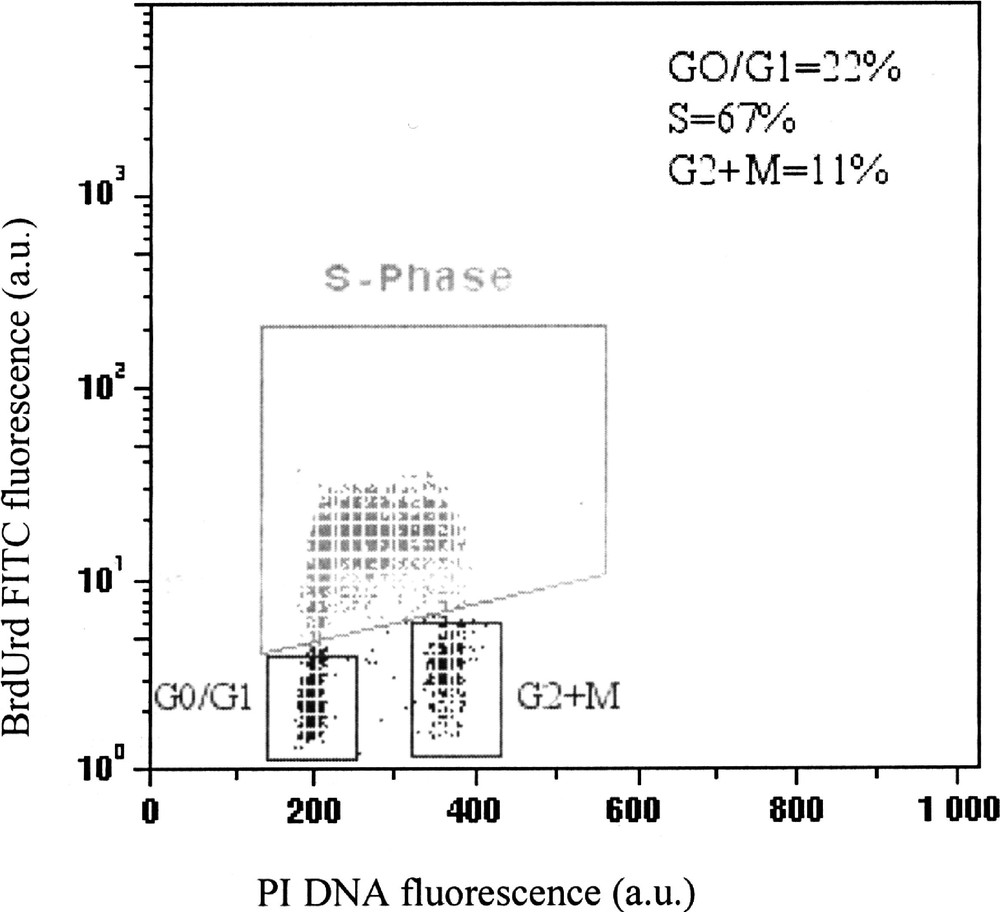
Typical multiparameter analysis of BrdUrd incorporation and DNA content in K562 leukaemia cells obtained by FCM. The cell distribution in each phase, obtained through three windows, corresponds to cells with non-incorporated BrdUrd (G0/1 and G2+M), and to cells with high levels of BrdUrd incorporation (S phase).
2.2.2 Modelling
Two major models are of interest to analyse cell proliferation after BrdUrd incorporation. The mathematical model of Shackney et al. 〚1〛 is based on levels intensity evaluation of BrdUrd incorporation during S phase. This model assumes (Fig. 3) that cells with high level of BrdUrd incorporation in mid S are sub-populations with relatively high level of DNA synthesis throughout S phase and short overall cell cycle times. According to this model, a relationship between cells in mid S phase and doubling time is established.

A model for cell cycle duration taking into account the rates of BrdUrd incorporation (and DNA synthesis) in mid-S phase. Cells with high level of DNA synthesis throughout S phase (A) correspond to cells with high rates of BrdUrd incorporation in mid-S (C) and are supposed to be members of cell subpopulations with relatively short overall cell cycle times (E). Cells with low rates of DNA synthesis throughout S phase (B) correspond to cells with low rates of BrdUrd incorporation in mid-S (D) and are supposed to be members of cell subpopulations with relatively long overall cell cycle times (E) 〚8〛.
Figs. 3C and 3D show various levels of BrdUrd incorporation in individual cells in relation with their DNA content (3A and 3B). The content of BrdUrd incorporated by a given cell during pulse treatment reveals the mean number of DNA replication sites that were active during the pulse BrdUrd exposure. Then, it can be concluded that a cell in mid S phase with a high level of BrdUrd incorporation progresses faster through a short S phase during the period of BrdUrd availability (3E, top). It can also be concluded that a cell in mid S phase with a low level incorporation of BrdUrd during pulse exposure (3D) progresses more slowly through a longer cell cycle with a more prolonged S phase (3E, bottom).
The mathematical model described by Torricelli et al. 〚2〛 is based on a segmentation of multiparameter analysis of BrdUrd incorporation with DNA content by FCM in four windows. The cell population is divided into four windows separating labelled divided, labelled undivided, unlabelled G1–S and unlabelled G2+M cells (Fig. 4). This model simulates the time course of G1, S and G2+M cell age distributions, given the probability distributions of phase transit times.
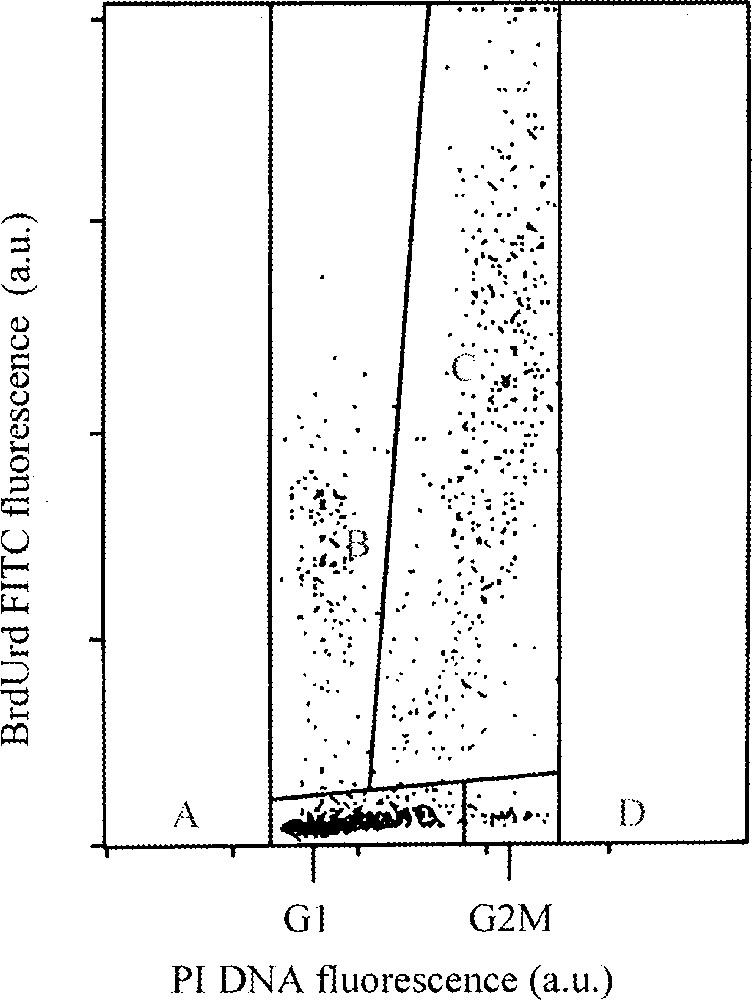
Example of flow cytometric DNA-BrdUrd 2-parameter distribution. Four windows separate labelled divided (B), labelled undivided (C), unlabelled G1-S (A), and unlabelled G2+M cells (D) 〚9〛. This model makes it possible to identify cells labelled but not divided.
In pulse chase studies, the duration of the BrdUrd exposure period is brief and adjusted to only labelled cells in S phase. This kind of analysis yields information on the cycle progression capacity of cells that were in S phase during treatment with various agents.
Jensen et al. 〚10〛 described FCM methods where cells were pulse-labelled with IdrUrd 10 μM for 30 min. Fig. 5 shows pulse-labelled cells grown during 0, 4, 8 and 16 h with 5 ng ml–1 vinblastine. Pulse-labelled cells progress through S and G2 phase (4 and 8 H) and accumulate in mitotic metaphase (16H).
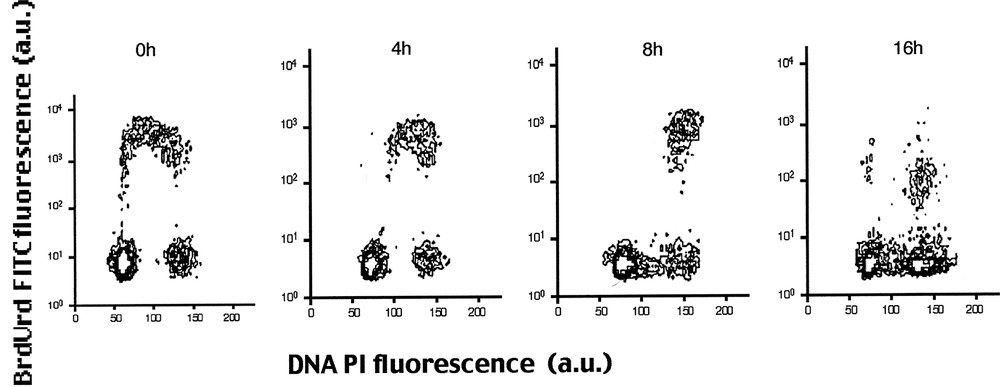
Multiparameter analysis by FCM of IdUrd labelling and DNA content in K193 human keratinocytes. Pulse-labelled cells were cultured for 0, 4, 8, and 16 h with 5 ng ml–1 vinblastine. The figure shows that pulse-labelled cells progress through S and G2 phase (4 and 8 h) and accumulate in mitotic metaphase lacking of beginning S phase (16 h) 〚10〛.
2.2.3 Critical aspects
BrdUrd can induce cell toxicity at high concentrations, leading to cell cycle disturbance. This experimental approach involves a compromise between a partial DNA denaturation necessary to detect BrdUrd molecules and a stoichiometric DNA staining. The different steps required for immunofluorescent BrdUrd detection induce an important cell loss. In addition, the percentage of S phase can be biased especially when chemosensitive cells are arrested in S phase in response to drug treatment. However, pulse-labelled technique makes it possible to follow the time course of cell progression through S and G2 phases.
3 Membrane labelling and cell division
3.1 Biological aspect
Besides the methods devoted to DNA quantification analysis using nuclear labelling, new dyes were developed for vital membrane labelling in order to estimate cell trafficking and proliferation. These dyes also called PKH are a family of lipophilic, fluorescent membrane intercalating dyes developed by Horan and Slezak 〚11〛. Their long alkyl chains rapidly partition into cell membranes and provide strong anchorage in the lipid bilayer. The use of PKH dyes to study proliferation has been described by several authors 〚12, 13〛. When labelled cells divide, each resulting daughter cell receives half the dye reducing the fluorescence intensity to one-half that of the parent cell 〚14–17〛. The decrease of fluorescence of monoparameter analysis allows following cell proliferation (Fig. 6). PKHs do not modify the main cell functions: proliferation, adhesion and migration 〚18〛.
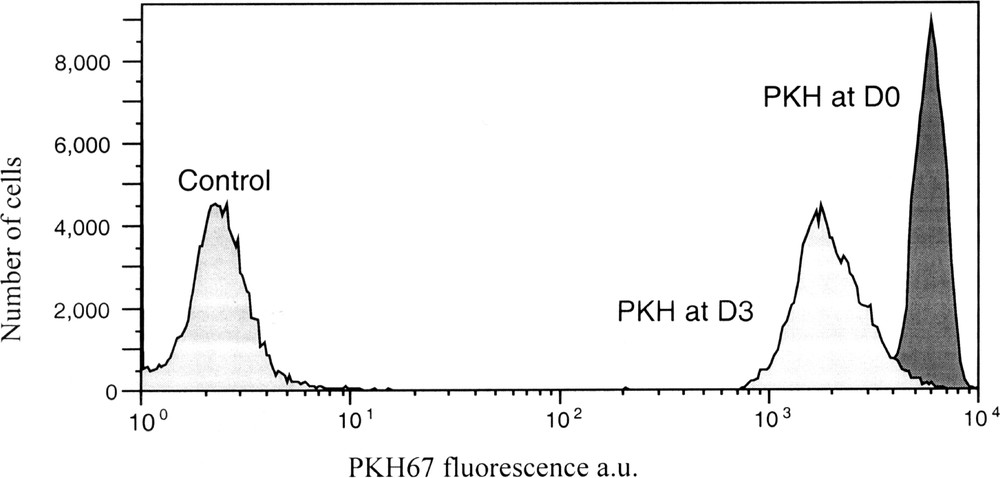
PKH67 fluorescence analysis by FCM of K562 controls cells, just after PKH labelling and after 3 days of culture. The decrease in PKH fluorescence corresponds to cell proliferation after 3 days.
3.2 Modelling
Cell proliferation kinetics are analysed by a mathematical model that assumes deconvolution of fluorescence histograms (Fig. 7). The Cell Census Plus™ estimates the number of cells having undergone cell divisions. Gaussian distributions are then fit by a non-linear least squares of the histogram data and the areas of each distribution are used to calculate percentage of cells in each generation. The standard deviation of the following generation is set equal to the original cell’s standard deviation. Parameters calculated using Modfit software (Verity Software) in conjunction with the Cell Census Plus model include: (i) the mean of fluorescence of parent generation, (ii) the percentage of cells in each generation, (iii) the proliferation index, which represents the ratio of analysed cells divided by the calculated original number of cells, and (iv) the goodness of fit, measured by a reduced χ2.
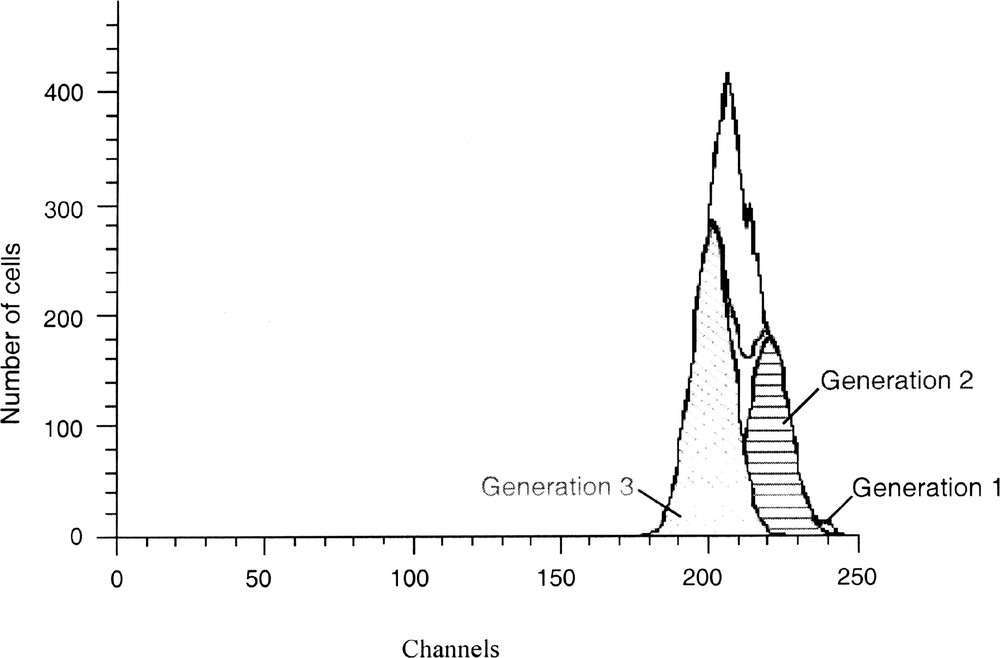
Mathematical modelling of the PKH fluorescence profile in Fig. 6 using the Modfit software. This software estimated the number of cells having undergone cell divisions. It displays the data acquired on a four-decade logarithmic scale in a 256-channel linear scale. Three generations were obtained: generation 1 (cell parent, 1%); generation 2 (39%) and 3 (61%) with a proliferation index of 2.85. The reduced χ2 (2.043) shows a good consistency between experimental and theoretical data.
3.3 Critical aspects
PKH are suitable for studying the time course of proliferation status of all cell types, including chemoresistant cells. High proliferating cells lead to rapid decrease of the fluorescence level, which can overlap with intrisinc fluorescence. These dyes are promptly internalised and do not alter intracellular trafficking, thus allowing multiparameter analysis with other fluorescent probes to detect various cell properties (apoptosis, necrosis, membrane antigens...). For example, PKH67 (green fluorescence) in combination with Ho 342 (blue fluorescence) dye allows assessment of both proliferation and cell cycle status (Fig. 8).
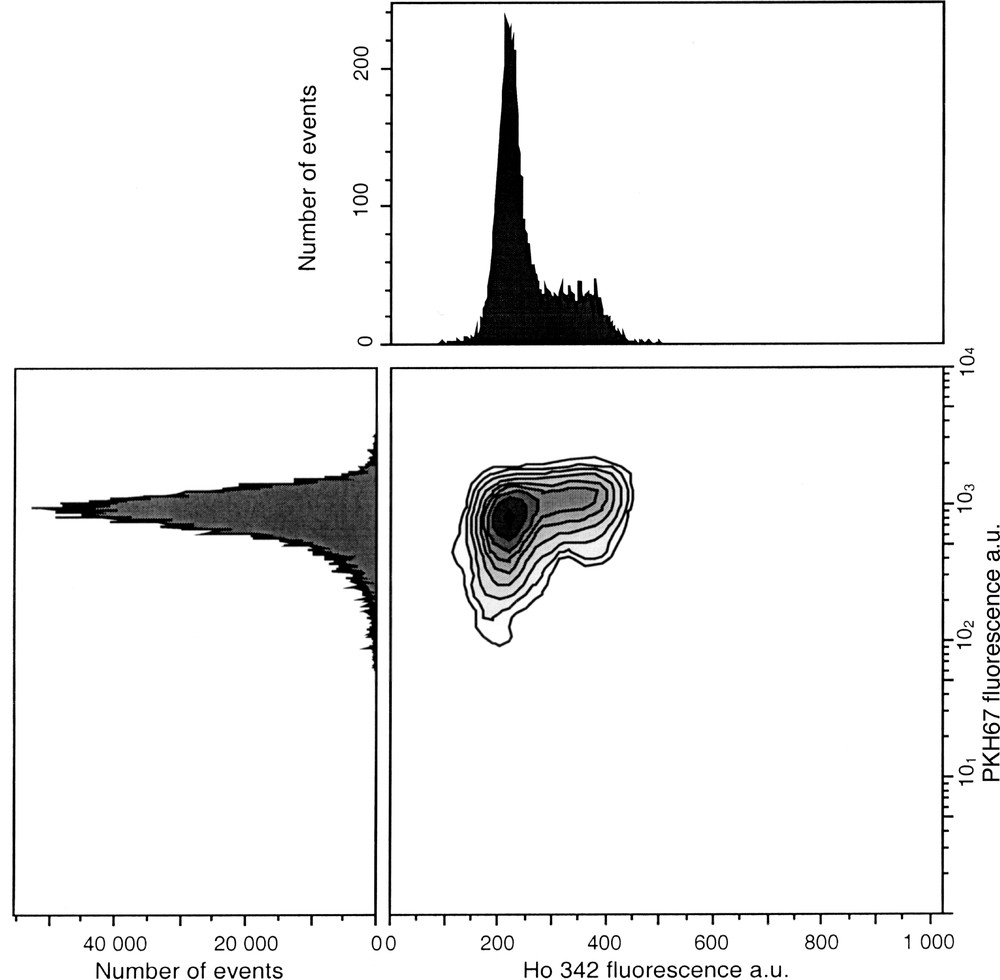
Simultaneous assessment of cell cycle status by Ho 342 dye and cell proliferation status by PKH67 dye. Cells were labelled with 10 μM PKH67 on day 0 and counterstained with 4 μg ml–1 Ho 342 after 1 day in culture. Dual labelling allows to analyse simultaneous cell proliferation with PKH67 and the cell distribution in each phase using Ho 342.
4 Conclusion
Cell cycle analysis by nuclear staining and cell division analysis using membrane staining are two complementary ways for studying cell proliferation. Both methods require mathematical modelling to study the proliferative behaviour of cells after antineoplastic treatment.
Acknowledgements
This work was supported by grants from the French ‘Ligue nationale contre le cancer’, ‘Comité de la Drôme’. Magali Barbier is a recipient from ‘Ligue nationale contre le cancer’, ‘Comité de la Haute-Savoie’.
Version abrégée
La réponse cellulaire aux traitements par les antinéoplasiques dépend de la balance entre la prolifération et l’apoptose. Plusieurs méthodes permettent de modéliser la prolifération cellulaire après analyse par cytométrie en flux (CMF), qui font intervenir des marqueurs fluorescents nucléaires ou membranaires. Dans ce contexte, nous comparons l’analyse monoparamétrée du contenu en ADN par un marquage traditionnel à l’iodure de propidium, l’analyse multiparamétrée de l’incorporation de la bromodésoxyuridine (BrdUrd) associée à l’analyse du contenu en ADN et l’analyse dynamique de la prolifération cellulaire par des intercalants membranaires, les PKH.
L’évaluation du contenu en ADN repose sur une analyse monoparamétrée par l’iodure de propidium, assurant un marquage stœchiométrique, qui permet d’obtenir la distribution des cellules en fonction de leur contenu en ADN. Différents modèles mathématiques permettent d’évaluer la fraction de cellules dans chaque phase du cycle cellulaire. Généralement, l’analyse mathématique assimile les pics G0/1 et G2+M à une gaussienne, alors que la phase S est estimée par un rectangle ou par une succession de gaussiennes.
L’analyse biparamétrée repose sur l’incorporation de la BrdUrd, qui se substitue à la thymidine pendant la phase de synthèse de l’ADN. La BrdUrd est révélée par un anticorps monoclonal, couplé à un fluorochrome tel que l’isothiocyanate de fluorescéine (FITC), permettant d’identifier la fraction de cellules en phase S. Le marquage de l’ADN par l’iodure de propidium assure l’identification des cellules en phase G0/1 et G2+M. Deux modèles mathématiques sont intéressants pour analyser la prolifération cellulaire. Shackney et al. 〚1〛 décrivent un modèle mathématique fondé sur l’évaluation du niveau de l’intensité de fluorescence de la BrdUrd au cours de la phase S. Ce modèle permet d’établir une relation entre l’intensité de fluorescence, la quantité de BrdUrd incorporée en phase S et le temps de doublement des cellules. Un autre modèle, décrit par Torricelli et al., 〚2〛 est basé sur une segmentation de l’analyse biparamétrée de la BrdUrd et du contenu en ADN par CMF en quatre fenêtres. Elles permettent d’identifier les cellules BrdUrd positives qui ont accompli la division cellulaire, les cellules BrdUrd positives n’ayant pas terminé leur division, les cellules BrdUrd négatives en G1–S et BrdUrd négatives en G2+M. Le modèle montre une relation entre le rythme de la croissance cellulaire et le temps de doublement. Cette approche permet d’obtenir la probabilité de distribution de la transition des cellules dans chaque phase.
Les deux méthodes décrites précédemment ne permettent pas l’évaluation de l’étape finale de division cellulaire. Une approche nouvelle fait appel aux PKH, molécules lipophiles présentant une tête polaire, où sont situés les groupements fluorescents. Fixés par ancrage lipophyle, ces marqueurs vitaux se répartissent également dans chaque cellule fille à l’issue de la division cellulaire. La mesure par cytométrie en flux de la décroissance de fluorescence permet de suivre la prolifération des cellules. La prolifération est analysée au moyen d’un modèle mathématique qui assure la déconvolution de l’histogramme de fluorescence obtenu après plusieurs jours de culture en une série de pics de distribution gaussienne, en prenant comme référence l’histogramme de fluorescence initiale. Il fournit le nombre de générations, la proportion de cellules dans chacune d’entre elles, un indice de prolifération et un test d’adéquation entre le modèle mathématique et les données théoriques. Ce modèle permet d’établir une relation entre l’indice de prolifération et le temps de doublement. Les PKH permettent d’analyser la dynamique de la division cellulaire, d’identifier différents types cellulaires et d’analyser simultanément la prolifération et la mort cellulaire par des marquages multiples.
En conclusion, l’analyse du cycle cellulaire ou de la division par un marquage nucléaire ou un marquage membranaire sont deux voies complémentaires pour étudier la prolifération cellulaire. La modélisation est nécessaire pour étudier le comportement prolifératif complexe des cellules en réponse à l’effet d’agents pharmacologiques.