

1 Introduction
1.1 Follicular development
In mammal females, the pool of oocytes available for fertilisation is constituted early in life. Ovarian follicles are spheroidal structures sheltering the maturating oocyte (Fig. 1). Folliculogenesis is the process of growth and functional maturation undergone by ovarian follicles, from the time they leave the pool of primordial (quiescent) follicles until ovulation, at which point they release a fertilisable oocyte. Actually, most of the developing follicles never reach the ovulatory stage but degenerate by a process known as atresia 〚1〛. The gonadotrophic hormones, Follicle Stimulating Hormone (FSH) and Luteinising Hormone (LH), play a major role in the regulation of terminal follicular development through the control of proliferation and differentiation of the granulosa cells surrounding the oocyte 〚2〛. Gonadotrophin secretion is, in turn, modulated by granulosa cell products such as œstradiol and inhibin. During the follicular phase of the ovarian cycle, negative feedback is responsible for reducing FSH secretion, leading to the degeneration of all but those follicles selected for ovulation. Finally, positive feedback is responsible for triggering the LH ovulatory surge leading to ovulation.
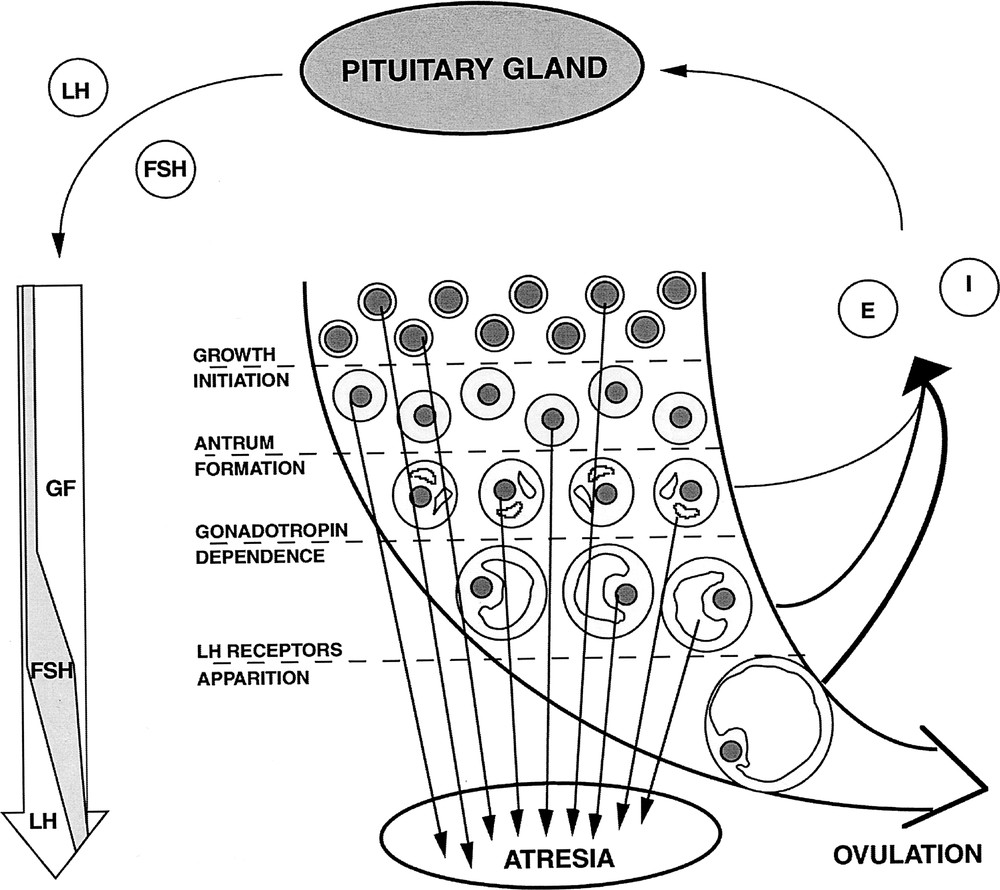
Follicular development. LH: Luteinising hormone; FSH: follicle stimulating hormone; E: œstradiol; GF: growth factors; I: inhibin. The long curved arrow summarises the principal events of folliculogenesis: initiation of growth from the pool of quiescent primordial follicles, formation of the antrum, acquisition of strict gonadotrophin dependence and apparition of LH receptors on granulosa cells. The long left vertical arrow shematically represents the changes in follicular needs thoughout development. The thickness of the right, curved arrows indicates the contribution of the corresponding follicular maturation stage to the total œstradiol secretion.
1.2 Biological and medical challenges
The development of ovarian follicles is a crucial, limiting step for the success of reproduction in mammals. Yet, the process of follicle selection, the regulation of the species-specific ovulation rate and the meaning of the tremendous wasting of follicles through atresia are still incompletely understood. Resolving these fundamental scientific questions correspond to both clinical and zootechnical challenges. A better understanding of follicular development is required to improve the control of anovulatory infertility in women, (such as it is encountered in the severe forms of the Poly Cystic Ovary Syndrome) and to control ovulation rate and ovarian cycle chronology in domestic species. Beyond the frame of reproduction physiology, follicular development is a unique instance of rapid and controlled development in adult organisms, and follicular (particularly granulosa) cells constitute an interesting model in cell kinetics studies.
2 Cellular description of follicular development
We approached the mathematical modelling of follicular development from a cellular viewpoint 〚3〛, basing on the parallel existing between follicular fate (ie either ovulation or atresia), and granulosa cell commitment towards either proliferation, differentiation or apoptosis.
2.1 Cell flows in the granulosa
Three cell states are encountered in the granulosa during terminal follicular development (Fig. 2). Proliferating cells are engaged in the division cycle ending up by mitosis completion. Differentiating cells are terminally-maturating cells characterised by their high level of sensitivity to gonadotrophins and steroidogenic activity. Apoptotic cells are expressing a genetic program leading to cell death and subsequent disappearance from the follicle. At any time, proliferative cells leave the division cycle in an irreversible way, according to the antagonism between proliferation and differentiation observed during terminal follicular development. The apoptosis risk applies to non-cycling cells, and entry into apoptosis is considered to be irreversible. The dynamics of the granulosa cell population is expressed as a function of follicular age by the following system of differential equations:
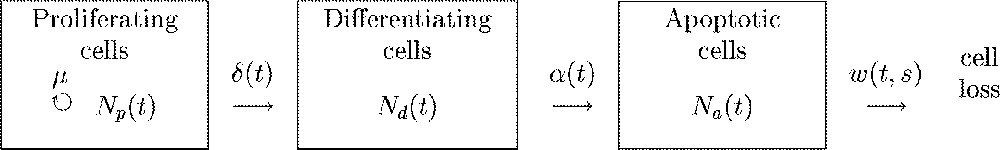
Flow chart of the cellular model. Rectangles represent compartments, straight-lined arrows represent cell flows between compartments, the circle arrow marks cell division. Letters correspond to the instantaneous flow rates. μ: constant rate of cell division, : rate of cell cycle exit, : rate of cells entering apoptotic death, : rate of phagocytose for a cell that entered apoptosis s hours ago.
| 1 |
| 2 |
| 3 |
2.2 Meaning of the cellular transition rates
The two cellular transition rates are the control variables mediating the interactions of the follicle with its hormonal environment. They reflect the response of follicular cells to signalling for differentiation or apoptosis. The cell cycle exit rate is modulated by the proportion of granulosa cells that are in the G1 exit window, and by the biochemical history of these cells in terms of exposure and response to mitogenic or anti-mitogenic signalling since last mitosis. The rate of non-cycling cells entering apoptosis, is similarly modulated by the balance between pro-apoptotic and survival signals integrated at the cellular level.
2.3 Cellular dynamics in ovulatory follicles
From now on, we focus on the course of an ovulatory follicle, for which the apoptosis entry rate can be neglected. The first two equations of system (1) – (3) become:
One can then deduce the dynamics of the total number of viable granulosa cells, as well as of the growth fraction, representing the relative number of proliferating cells amongst the viable cell population:
| 4 |
The values of the five parameters of the sigmoid function can be estimated by fitting the regression equation (4) on real cell number data.
2.4 Changes in cell numbers (ewe)
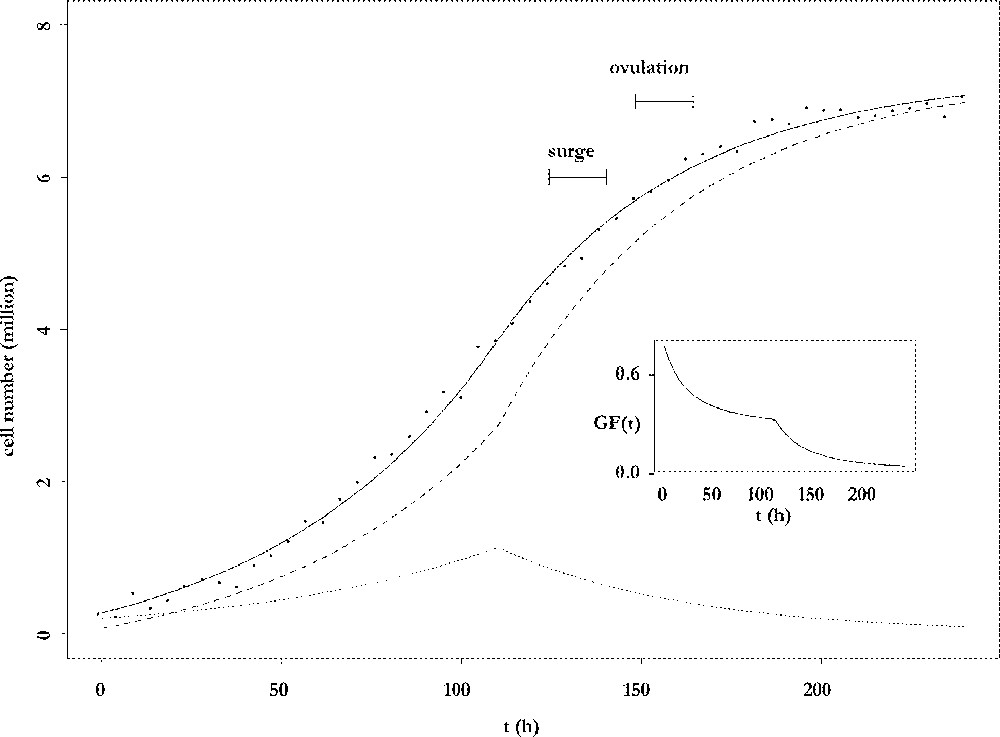
The results of the fitting procedure are illustrated in Fig. 3. Cell number data were harvested from ewes after dissection of follicles and counting of their granulosa cells 〚4〛. The data points are plotted together with the adjusted curve for the total cell number and its decomposition into proliferative and differentiated cells. The number of proliferative cells shows a biphasic pattern: after an initial increase phase, it decreases for the benefit of the non-cycling population, which ends up constituting the whole population. From an initial mainly proliferative state, the granulosa of the preovulatory follicle progressively switches to a highly differentiated state, so that the growth fraction continuously decreases (see insert in Fig. 3). The follicle awaits ovulation with an almost constant number of cells. In this sense, it has reached a cellular steady state. However, this is a temporary state, because the onset of ovulation will completely remodel the follicle into a corpus luteum. The number of cells that is reached at the steady differentiated state is directly related to the capacity of œstradiol secretion, through which the follicle takes part in the endocrine interactions between the ovaries and the hypothalamic-pituitary axis. The observation that this number is fully determined by the speed of exhaustion of the proliferative compartment leads to the notion of follicular proliferative resources.
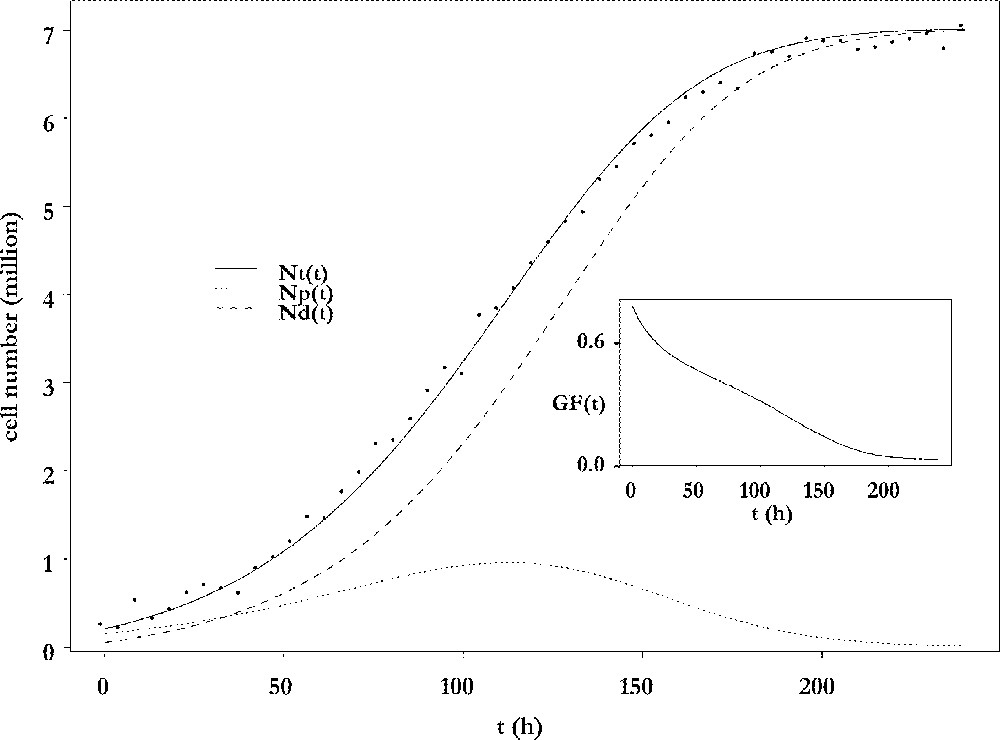
Changes in cell numbers. Main plot: changes in the number of viable cells (solid line), proliferating cells (dotted line) and differentiating cells (dashed line), as a function of the follicular age t. Insert: changes in the growth fraction of the granulosa cell population as a function of the follicular age t.
2.5 Follicular sensitivity towards the cell cycle exit rate: proliferating resources
The corresponding curve for the exit rate is shown in Fig. 4. The minimal value of roughly equals half the value of μ, while its maximal value roughly reaches twice the value of μ. The time when the value of exceeds that of μ (tE in Fig. 4) is of critical importance, as it corresponds to the number of proliferating cells starting decreasing. Starting from similar initial conditions, the earlier this time occurs, the earlier and lower is the peak in the proliferating cell number As a result, the number of fully-differentiated cells available at the end of follicular development is lower, and the decrease in the growth fraction is faster (see Fig. 5). In the ovine species, follicles of poly-ovulating breeds ovulate at a smaller size, associated with a lower number of granulosa cells compared to mono-ovulating breeds. According to the model, the smaller number of granulosa cells in the preovulatory follicles of poly-ovulating breeds could be accounted for by a faster increase in the cell cycle exit rate, corresponding to differential exploitation of the follicular proliferative resources.
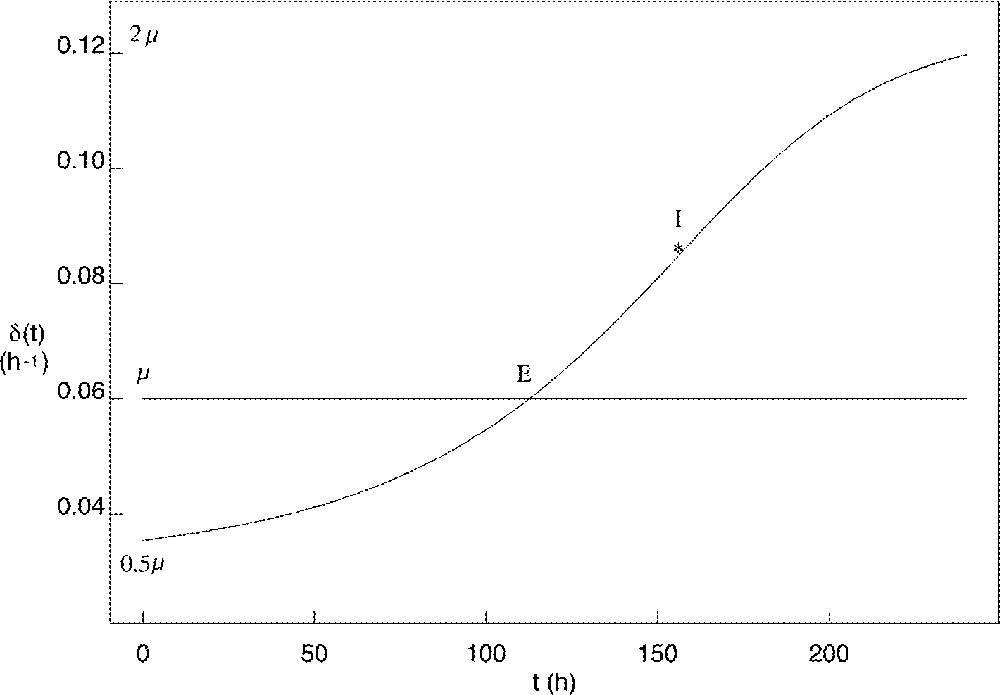
Changes in the cell cycle exit rate as a function of the follicular age t compared to the constant value of the cell division rate μ (horizontal line). E: intersection point where I: inflexion point.
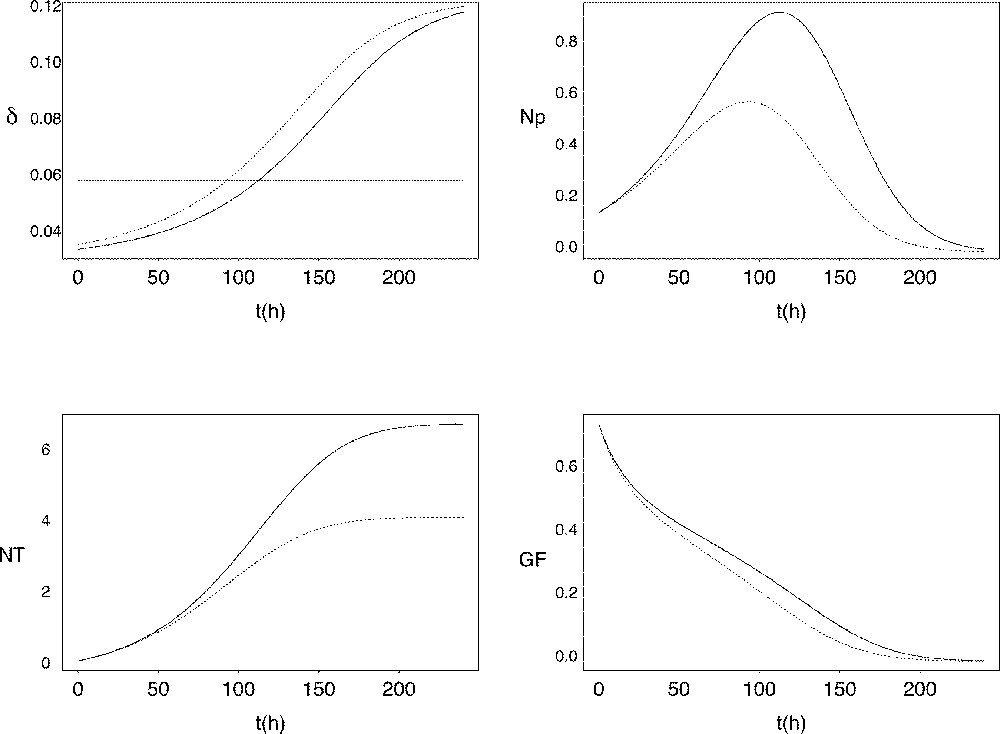
Follicular sensitivity towards the cell cycle exit rate. Changes in the cell cycle exit rate (top left panel, expressed in h-1), proliferating cells (top right panel, expressed in 106 cells), total viable cell number (bottom left panel, expressed in 106 cells) and growth fraction (bottom right panel) as a function of follicular age. The dotted line corresponds to the intersection time E as defined in Fig. 4, occuring earlier compared to the solid line.
2.6 Experimental measurement of the growth fraction
This experiment 〚5〛 aimed at (i) determining the changes in the growth fraction of granulosa cells in the ‘Île-de-France’ mono-ovulating sheep breed compared to the ‘Romanov’ poly-ovulating breed and (ii) studying the effect of overstimulating granulosa cells with FSH on these changes. The former objective corresponds to the testing of the hypothesis derived from the model results on differential increases in the cell cycle exit rate according to the breed, while the latter is a first step in understanding the way FSH acts on the cell cycle exit rate. The experimental steps included ovariectomy of control and FSH-treated adult cyclic ewes, dissection of follicles and pooling of granulosa cells according to follicular diameter, granulosa cell isolation, and continuous 〚3H〛 thymidine labelling and colcemid administration to cultured cells. The determination of the growth fraction was based on the procedure of Maekawa and Tsuchiya 〚6〛, which was initially proposed to determine the durations of the different cell cycle phases. This method is also appropriate to determine the growth fraction in cell populations. Briefly, it consists in the continuous and combined administration of 〚3H〛 thymidine and colcemid, respectively to label all proliferating cells lying in the S phase of the cycle and to block mitosis. After a delay corresponding to the duration of the G2 phase, the first labelled mitosis appear so that four states can be detected: labelled or unlabelled dividing cells, labelled or unlabelled non-dividing cells. The proportion of cells in the unlabelled, non-dividing state decreases before reaching a plateau after a delay corresponding to the duration of the G1 phase. The height of this plateau (modulo unity) finally gives an estimation of the growth fraction.
2.7 Experimental results
2.7.1 Comparison ‘Romanov’/‘Île-de-France’ in basal conditions
Several lessons can be drawn from the results obtained in basal (non stimulated) conditions (left part of Fig. 6). We can first observe that, whatever the follicular diameter, the growth fraction is strictly lower than unity, which means that the granulosa population appears always heterogeneous during terminal follicular development. Further, the growth fraction continuously decreases. The drop is particularly marked between 3 and 4 mm diameter, which corresponds to the period when granulosa cells acquire LH receptors. Finally, the speed of decrease (as measured by the slope of the regression line between the growth fraction and diameter after logit transformation) is higher in follicles from ‘Romanov’ compared to ‘Île-de-France’ ewes. In agreement with the model prediction, this result suggests that the increase in the cell cycle exit rate during terminal follicular development is faster in ‘Romanov’, compared to ‘Île-de-France’ follicles. The impact of this result is emphasized by comparative physiology. Indeed, in women suffering from severe forms of the PolyCystic Ovary Syndrome, follicles stop their development at an intermediary stage. Their failing ovulation might be related to alterations in the control of granulosa cells proliferation such as those observed in Romanov ewes.
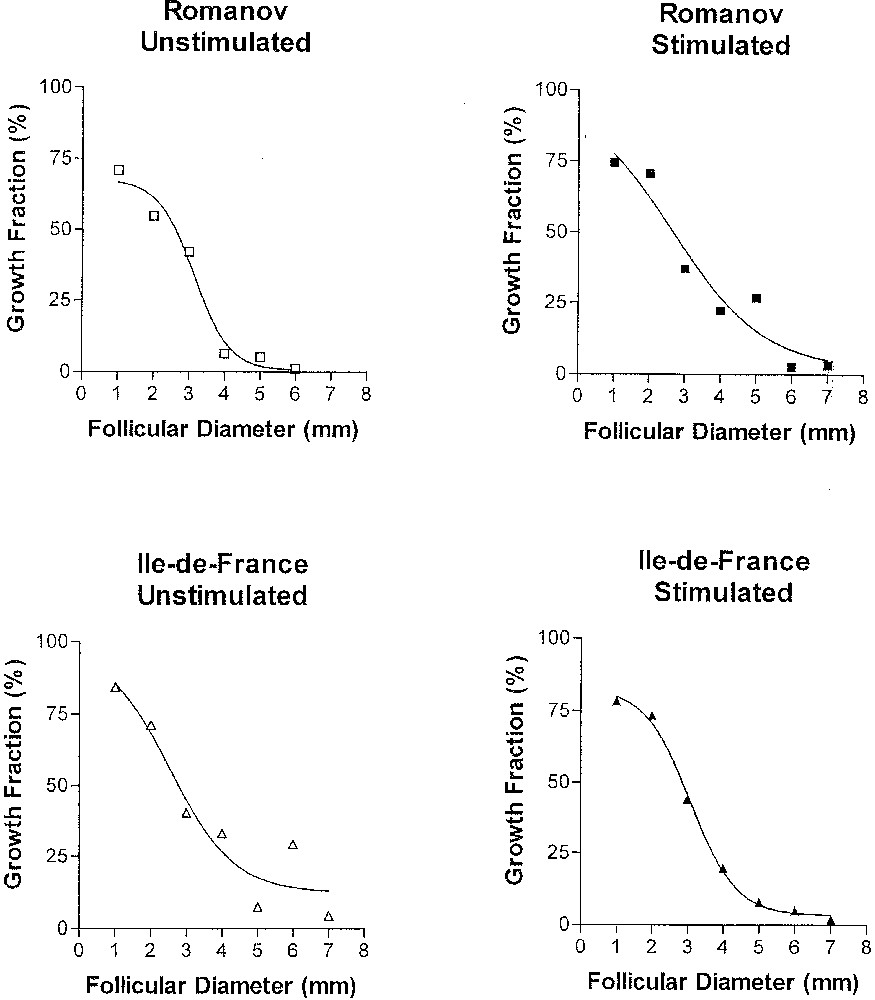
Changes in the growth fraction throughout follicular development. Changes in the growth fraction in follicles from untreated ‘Romanov’ (top left panel), untreated ‘Île-de-France’ (bottom left panel), stimulated ‘Romanov’ (top right panel) and stimulated ‘Île-de-France’ (bottom right panel) ewes, as a function of follicular diameter (from C. Pisselet et al., Reprod. Nutr. Dev. (2000), with permission).
2.7.2 Comparison ‘Romanov’/‘Île-de-France’ after stimulation by FSH
Under FSH overstimulating condition, the pattern of the growth fraction remains almost unchanged in follicles from ‘Île-de-France’ ewes, while the decrease in the growth fraction is slowed down in the follicles of Romanov ewes. Hence, in such condition, there is no significant difference between the mono and poly-ovulating breeds. Romanov granulosa cells appear more sensitive to exogenous FSH in terms of proliferation. Alternatively, they may be less sensitive to endogenous FSH. In any cases, the underlying mechanisms need to be investigated. They could imply either the slowing-down of the increase in the cell cycle exit rate, or a reentry of cells from the G0 phase into the cell cycle.
3 Optimal strategy for exploiting follicular resources
The notion of follicular proliferative resources leads to question whether there exists an optimal strategy of exploiting these resources to reach ovulation. This strategy would consist in controlling the cellular transition rates in an optimal way. Hence, both the cell cycle exit and apoptosis entry rates are no longer given by parametric functions of the follicular age, but are a priori unknown functions to be determined, respectively designated as and They are only assumed to take positive and bounded values ( and ).
Optimality is defined in regards of the physiological conditions for ovulation, or rather, for the onset of the ovulatory LH surge. The exact mechanism leading to the LH surge is unknown. The only indubitable point lies in the importance of rising levels of plasmatic œstradiol 〚7〛, which signals the increase in the maturity level of ovarian follicles. The LH surge thus results from a tight synchronisation between follicular cells, on the one hand, and hypothalamo-pituitary cells, on the other hand. This constraint of synchronisation has been introduced in terms of a constraint on the differentiation level of the follicle at the surge time reaching a threshold on follicular differentiated cells is needed for triggering the surge. We studied three different modes for the œstradiol action upon LH release, corresponding to three expressions of the threshold. The threshold concerns either the instantaneous number of differentiated cells (relation (5)), or the cumulative number of differentiated cells (relation (6)), or the weighted cumulative number with greatest weighting for the contributions that are close to the surge instant (relation (7)).
| 5 |
| 6 |
| 7 |
We finally sought for the optimal cellular transition rates allowing to reach the target value Nc in minimal time.
3.1 Optimal cellular dynamics
Whatever the target may be, the optimal solution consists in applying the minimal apoptosis rate αmin and switching the cell cycle exit rate from its minimal bound δmin to its maximal bound δmax at a given time ts (see Fig. 7). The optimal cell cycle exit rate can thus be considered as a limiting case of a sigmoid function with a very steep increase. The chronology of follicular development is fully determined by both the switching and surge times, whose values are explicitly given as functions of the initial values and other parameters (see reference 〚8〛 for details). The switching time ts occurs all the more lately than the conditions for reaching the target are demanding (high value for Nc), while the delay between the switching and surge times depends on the target (lowest delay with instantaneous target, highest with cumulated one).
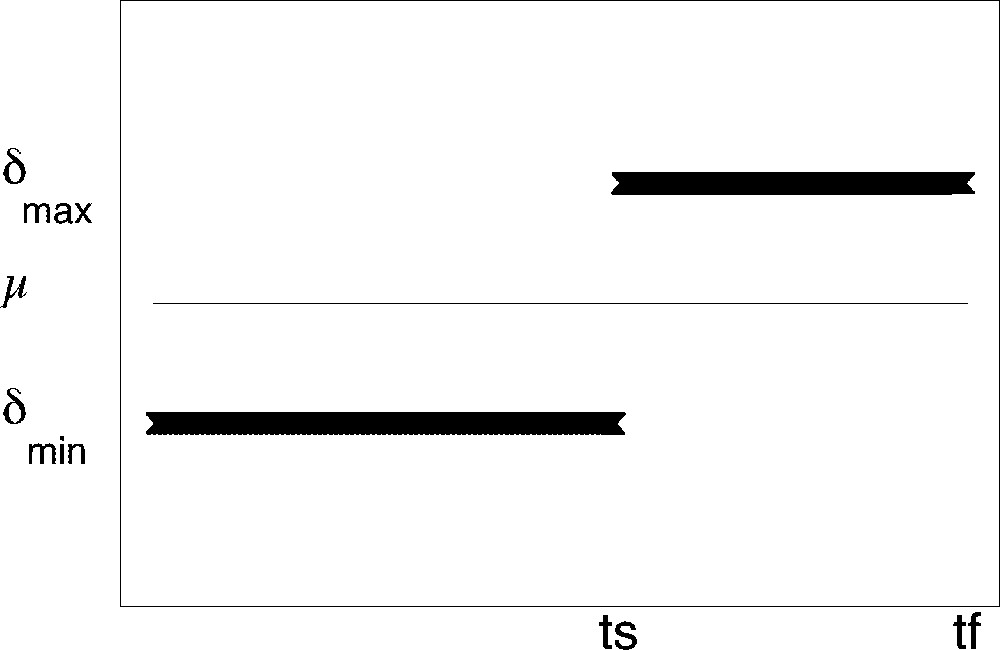
Optimal ‘bang-bang’ cell cycle exit rate. Thin line: value of the constant division rate thick segments: optimal cell cycle exit rate value as a function of follicular age (ts switching time, tf surge time).
The number of viable cells () can be expressed as a function of the parameters of the control problem:
This allows in turn to fit the values of the optimal strategy parameters from the experimental cell counts described in section 2.4 (see Fig. 8) and to get information back on the surge time tf and threshold Nc.
Optimal changes in cell numbers.
3.2 Ovulation/anovulation
Deviation from the optimal response can result from a shift in the time schedule for the switching instant, as it is illustrated in Fig. 9. The way of shifting the switching time has great repercussions on the issue of the problem. Indeed, when the actual switching time occurs earlier than the optimal one, the proliferative resources of the follicular granulosa may be exhausted too quickly. In the instantaneous case, the target may remain beyond reach. In the cumulated case, the delay in reaching the target may hamper the normal progress of the ovarian cycle. The corresponding follicular response is thus completely non-optimal. On the contrary, when the switching time occurs later than the optimal one, the target can be reached with limited delay, but at the expense of producing follicular cells in excess. The corresponding follicular response is thus only suboptimal.
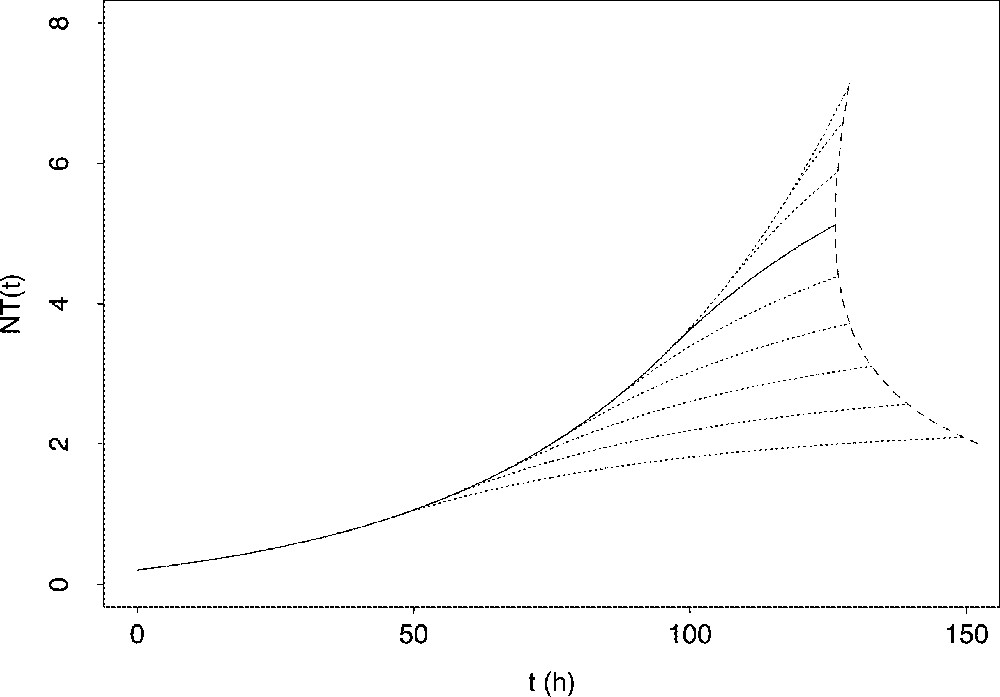
Consequences of a backward or forward shift in the switching time upon the changes in the total number of granulosa cells. Solid line: changes in the total cell number when applying optimal switching time Dotted lines: changes in the total cell number when applying shifted switching time; dotted lines upper than the solid line correspond to a forward-shifted switching time ( by 10 h increment from downwards to upwards), while dotted lines lower than the solid line correspond to a backward-shifted switching time ( by increment from upwards to downwards). The dashed line joins the values of the time elapsed before reaching a same cumulated target condition
4 Mechanistic approach of the cellular transition rates
The previous sections have highlighted the crucial role of the dynamics of the cellular transition rates in the outcome of follicular development. In the long run, we aim at expressing these rates, no more as functions of the follicular age, but as functions of the historical background of granulosa cells in terms of exposure to gonadotrophins. Hence, to further understand the control of the granulosa dynamics, we need to investigate the action of gonadotrophins on the cellular transition rates.
Both FSH and LH mainly operate through G protein-coupled transmembrane receptors, transducing their signal by the activation of the enzyme adenylyl cyclase and the production of second messenger cyclic Adenosine Mono-Phosphate (cAMP) 〚9〛. The binding of FSH to its transmembrane receptors triggers an intracellular signal via the heterotrimeric G proteins. The FSH-bound receptor activates the stimulatory protein, which interacts with adenylyl cyclase to generate an increase in cyclic AMP. Once cAMP is synthesised, it either binds and activates specific protein kinases such as protein kinase A or is degraded by cyclic nucleotide phosphodiesterase 〚9〛. The accumulation of FSH-induced cAMP coincides with the appearance and subsequent dramatic increase in LH receptors, allowing LH to act synergistically or as a surrogate for FSH in granulosa cells 〚10〛. As it also appears to be a keypoint in cell cycle arrest 〚11〛, a better understanding of gonadotrophin-induced cAMP production would help to gain insight into the dynamics of the cell cycle exit rate amongst granulosa cells during terminal development. We now focus on the FSH branch of the cAMP cascade, as it is the first to operate in granulosa cells 〚12〛.
4.1 FSH signal processing by granulosa cells
The biochemical model includes the steps of FSH signal detection, relay and amplification, and extinction:
- •
binding of FSH to its receptor results in the formation of an active complex
- •
bound receptors activate adenylyl cyclase (E) through a conformational change in the associated G protein
- •
activated adenylyl cyclase synthesises cAMP from the substrate (adenosine triphosphate)
- •
cAMP is hydrolysed into AMP by phosphodiesterase
- •
bound receptors are subject to a desensitisation process through cAMP-mediated phosphorylation
- •
phosphorylated inactive complexes undergo internalisation into the cell, where receptors are dissociated from FSH
- •
internalised receptors Ri are recycled back to the cell membrane, while FSH is hydrolysed
Considering only reactions relevant to follicular development allows some simplifications to be made. Reactions generating short-life intermediary species are neglected. In particular, the cycle of G-protein activation/deactivation is not modelled explicitly. The process of receptor synthesis is assumed to compensate both for intracellular receptor degradation and for the depletion of the receptor pool during cell division, so that the total number of FSH receptors in different states (free, active, phosphorylated and internalised) remains constant 〚13〛, leading to the following cellular cycle for FSH receptors under different states:
Finally, cAMP-independent desensitisation is not taken into consideration, as its behaviour during the maturation of granulosa cells is not yet known. In addition, the amount of FSH is assumed to be sufficiently large so that its concentration is unaffected by binding to receptors.
4.2 Biochemical dynamics
The control of cAMP levels in granulosa cells involves both fast biochemical processes, occurring on a time scale of a few minutes, such as binding and desensitisation, and slower physiological processes lasting hours or even a few days, which mainly result in changing the efficiency of the enhancement of cAMP synthesis by stimulated FSH receptors via adenylyl cyclase activation. The design of our model follows from the interactions between these contrasting biochemical and physiological dynamics. The following system intends to render the dynamics of intracellular cAMP in an average granulosa cell in response to FSH:
| 8 |
| 9 |
| 11 |
| 12 |
| 13 |
are respectively the concentrations of free, bound-active, bound-inactive (phosphorylated) and internalised FSH receptors. EFSH is the concentration of activated adenylyl cyclase and cAMP the concentration of intracellular cAMP. are respectively the rate constants for FSH-binding, FSH-unbinding, bound-complex internalisation and receptor recycling to the cell membrane.
Equations (8), (11), and (13) result from applying the principle of mass-action. The concentrations of ATP and phosphodiesterase enzyme are assumed to be constant and non-limiting, so that their effects are included in the respective kinetic constants ω and kpde. Desensitisation through phosphorylation is assumed to be cAMP-mediated in a dose-dependent, increasing and saturated manner. It follows that the desensitisation rate ρ in equations (9) and (12) is a Hill function of intracellular cAMP:
The dynamics of the coupling variable EFSH, which we assimilated to activated adenylyl cyclase, incorporates specific features of FSH signal transduction in granulosa cells. It accounts for both FSH-dependent and auto-amplified settling and efficiency of the cAMP cascade through follicular development. The parameter acts as a time scale parameter. Whenever it takes a low value the changes in the coupling variable EFSH are slower than those of the other variables of the model. The σ parameter measures the degree of signal amplification and represents the average number of adenylyl cyclase molecules activated by one bound receptor at steady state.
Finally, equations (8) to (12) are subject to the conservation law
4.3 Control of FSH-induced cAMP levels
The cAMP modelling approach allows two meeting points with possible experimental investigations. The first concerns the influence of the model parameters on the cAMP steady-state level reached after exposure to constant FSH input, while the second concerns the pattern of cAMP dynamics in response to a given pattern of FSH input.
4.3.1 Control of FSH-induced cAMP steady-state levels (constant input)
The way cAMP steady state level (cAMP*) is influenced by a parameter can be analysed formally (see details in 〚12〛). This value is an increasing function of FSH input, the size of receptor pool RT, the rate constants and and the half-saturating cAMP concentration Conversely it is a decreasing function of the unbinding rate the hydrolysis rate and the saturation value λ. Interestingly, the γ parameter, which rules the rate of increase in the phosphorylation rate (the slope of the Hill function), has a non univocal influence on cAMP*, depending on the value of RT compared to a threshold value RThresh, given by:
For values of RT lower than RThres, cAMP* is an increasing function of γ, while it is a decreasing function for values higher than RThres. This means that, if the receptor pool is small, the cAMP steady-state level rather benefits from an almost all-or-nothing effect of cAMP level on the phosphorylation process, rather than from a progressive, smoother effect.
Beyond this qualitative study, quantitative dose-effect-like curves can be constructed, such as those displaid in Fig. 10. As variations in the model parameter values correspond to physiological, pathological or pharmacological alterations in the different steps of FSH signal processing by granulosa cells, these theoretical curves should be at least partly experimentally testable.
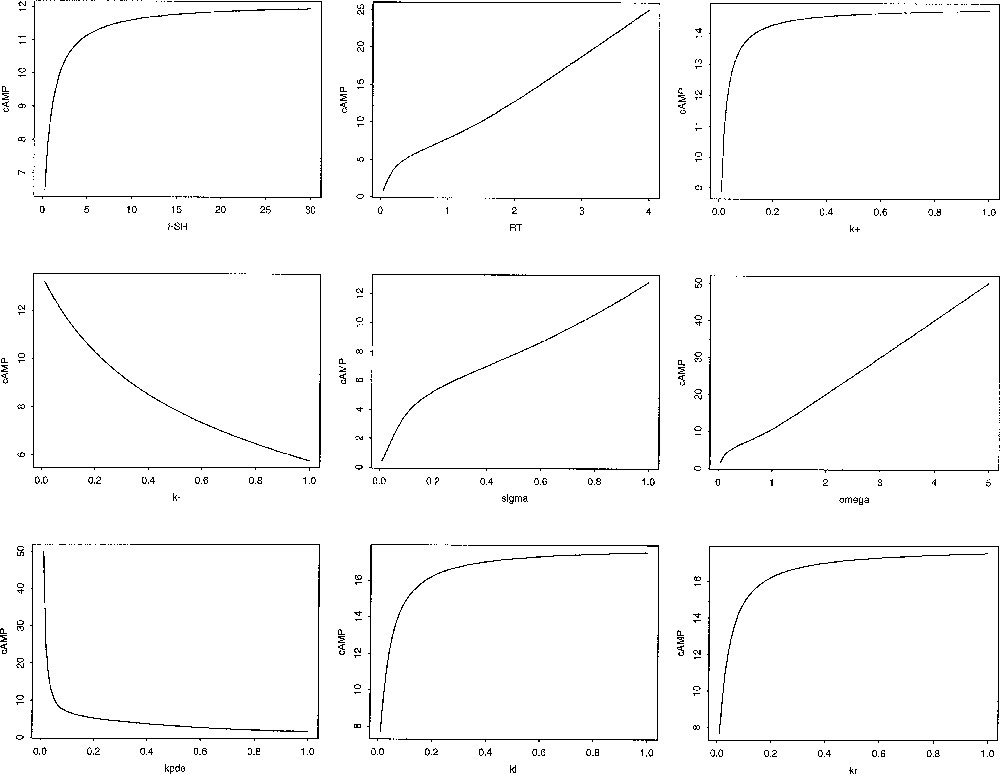
Control of cAMP steady-state levels. The different panels illustrate the influence of the FSH input (in M, left top panel), the size of the receptor pool RT (in 104 molecules/cell, middle top panel), and other parameter values: (dimensionless), and from left to right and top to bottom on cAMP steady-state level.
4.3.2 Control of FSH-induced cAMP transient levels
The model retraces the long-term behaviour of cAMP in granulosa cells in response to FSH alone. From any given FSH input, the cAMP output pattern can be predicted, such as it is illustrated in Fig. 11 with real FSH data 〚14〛. As cAMP is an accessible variable on the experimental ground, the predicted output could be confronted with experimental measures. On the contrary, the intermediary species (as the different states of FSH receptors) do not seem susceptible of easy measure on the long term, even if they have a direct biochemical meaning.

Response to non-constant FSH stimulation. From left to right and top to bottom: FSH input (M), changes in the levels (in 104 molecules/cell) of free FSH receptors, bound FSH receptors, activated adenylyl cyclase, cAMP, phosphorylated receptors, internalised receptors and in phosphorylation rate Time unit is
4.4 Possible experimental investigations
The most appropriate data would consist in repeated measurements of intracellular cAMP throughout the development of dynamically-monitored follicles. Concomitantly, FSH levels should be measured. To track cAMP production until the ovulatory stage, one need to be placed in controlled situations. As far as physiological situations are concerned, the luteal phase in ruminant species would be the most appropriate window of the ovarian cycle to harvest data. In such species, terminal follicular development during luteal phase is mainly FSH-dependent and thus fulfills the requirements for investigating FSH-induced cAMP production throughout terminal development. As far as pharmacological situations are concerned, appropriate conditions can be artificially reproduced by means of either previous desensitisation with GnRH agonists, or use of GnRH antagonists, and administration of recombinant FSH with known bioactivity. The most limiting point in both situations is the need for dynamical non-invasive measurements of intracellular cAMP. This might be achievable in the future through repeated ultrasound-guided follicular cell pick-up as follicular development progresses. In domestic animals, follicular fluid pick-up are already running well and technical progress of devices could render direct cell pick-up feasible in the medium term.
5 Further modelling and conclusion
Future improvement of the model could include the coupling of both FSH and LH signalling pathways and the design of a more biochemically-based formulation to the equation ruling the changes in the coupling efficiency. We intend to use the resulting cAMP dynamics as a control variable on the cellular transition rates, ruling the commitment of granulosa cells towards either proliferation, differentiation or apoptosis. As inadequate response of granulosa cells to gonadotrophin signals may have great repercussions on follicular development and may even lead to infertility, a realistic model characterising both physiological and pathological signal transduction would be very useful in simulating new therapeutic strategies.
Version abrégée
Tout au long de la vie reproductive des femelles de mammifères, l'ovaire est le siège d'un phénomène très particulier, appelé folliculogenèse, qui se définit comme l'ensemble des processus de croissance et de maturation fonctionnelle subis par les follicules ovariens depuis leur sortie de la réserve de follicules primordiaux jusqu'à l'ovulation. Sa finalité biologique est la production, lors de chaque cycle ovarien, d'un (pour les espèces mono-ovulantes) ou de plusieurs (pour les espèces polyo-ovulantes) ovocytes aptes à la fécondation et au développement. En fait, la plupart des follicules n'atteignent jamais le stade ovulatoire, mais subissent un processus de dégénérescence, l'atrésie. Le développement folliculaire terminal est sous le contrôle des gonadotropines hypophysaires, FSH (follicle-stimulating hormone) et LH (luteinising hormone), qui peuvent être considérées comme des entrées de commande agissant sur la fonction ovarienne. L'action des gonadotropines se faisant à l'échelle cellulaire, il est nécessaire de caractériser et de comprendre les changements qui s'opèrent au niveau des cellules cibles, au sein du tissu folliculaire appelé la granulosa.
Nous avons construit un modèle mathématique rendant compte des processus cellulaires de prolifération, différenciation et apoptose (mort cellulaire). Les variables en jeu sont, d'une part, les effectifs des différentes catégories de cellules (variables d'état) et, d'autre part, les taux de transition entre les différents états cellulaires (taux de sortie du cycle cellulaire et taux d'entrée en apoptose). Ces taux sont des variables de contrôle qui traduisent la réponse des cellules folliculaires aux signaux qu'elles reçoivent de leur environnement hormonal, et en particulier de FSH et LH. L'élaboration et les résultats de ce modèle ont fait émerger une notion nouvelle, celle de capital prolifératif folliculaire. Cette notion permet d'envisager une gestion optimisée de ce capital, à l'aide de thérapeutiques adéquates, à des fins cliniques (traitement de l'infertilité anovulatoire) ou zootechniques (superovulation). Elle permet aussi de proposer une hypothèse explicative pour les différences observées dans l'espèce ovine entre races mono- et poly-ovulantes quant à l'effectif cellulaire atteint au moment de l'ovulation. L'effectif plus faible en cas de poly-ovulation serait dû à un arrêt plus précoce de la prolifération cellulaire, lié à une sortie plus rapide du cycle cellulaire. Cette hypothèse a motivé la mise en place d'une expérience de mesure comparative de la fraction de croissance (proportion de cellules proliférantes parmi l'ensemble des cellules folliculaires) à différents stades du développement folliculaire chez deux races de brebis. Cette expérience a confirmé la cinétique différentielle de sortie du cycle en fonction du taux d'ovulation. L'importance de ce résultat doit être considérée sous l'angle de la physiopathologie comparée, si l'on sait que dans le syndrome des ovaires poly-kystiques, très fréquemment rencontré lors d'explorations pour anovulation chez la femme, on constate un blocage des follicules à un stade intermédiaire, qui pourrait lui aussi résulter de perturbations de la prolifération cellulaire.
La réflexion engagée se poursuit et concerne actuellement la compréhension du mécanisme d'action des gonadotropines sur les cellules folliculaires. En particulier, le contrôle de la production d'une molécule clé pour la transduction du signal hypophysaire, l'AMPc, fait l'objet des études en cours, tant sur le plan expérimental que sur celui de la modélisation. Nous disposons d'un modèle décrivant la dynamique de la concentration intracellulaire en AMPc résultant d'interactions entre des dynamiques lentes et rapides contrôlées par FSH. Les points de rencontre de ce modèle avec la démarche expérimentale concernent, d'une part, l'influence des paramètres du modèle sur les niveaux d'AMPc intracellulaires atteints à l'équilibre en cas d'exposition à un stimulus FSH constant et, d'autre part, la prédiction de la dynamique de production d'AMPc observée en réponse à un profil donné de l'entrée FSH. Une réponse inadaptée des cellules de la granulosa vis-à-vis de FSH pouvant avoir des répercussions dramatiques sur le développement folliculaire, un modèle réaliste, caractérisant à la fois la transduction physiologique et pathologique du signal FSH, devrait se révéler très utile pour simuler de nouvelles approches thérapeutiques.