

1 Introduction
In France, 7% of polluted sites (so-called black-points) come from non-ferrous metal industry [1]. These industrial complexes are often responsible for local depositions and diffuse contamination of surrounding agricultural lands [2]. Although less contaminated than soils of industrial complexes, the situation of pollution in agro-ecosystem is a matter of concern [3]. Nowadays, the regulation on heavy metal pollution only accounts for total content of trace elements [4] but estimation of the environmental risk requires more than an evaluation of the stock of pollutants. A comprehensive analysis of the response of different taxa that live directly in contact with polluted wastes is a way to evaluate the real risk. Considering the functional importance of the soil fauna [5], it is important to understand the effect of pollution on their community structure [6–8].
The aim of our study was to assess the effect of heavy metal pollution (Cd, Pb, and Zn) on soil macroinvertebrate species. We used a single species approach to identify which species displayed a clear response to pollution. In so doing, we aimed to find indicator species of either direct or indirect effects of heavy metal pollution. Beyond the simple segregation between sensitive and non-sensitive species, indicator species may allow us to identify the effects of pollutants, even when metal concentrations remain close to the background.
2 Material and methods
2.1 Site
The study was carried out in October 1999, at Mortagne-du-Nord (Nord-Pas-de-Calais, France), where a zinc smelter complex operated from 1901 to 1962 [9,10]. Sampling was carried out at five sites located within the metallurgical zone and nine sites at different distances away from this source of pollution, in the direction of the prevailing winds. Among the five sites within the metallurgical complex, two were located on a metallophyte grassland, and three on a poplar plantation. Among the nine sites of the agricultural perimeter potentially concerned by metal pollution, three grasslands, two fields, two poplar plantations and two forests were surveyed (Table 1).
Vegetation cover and edaphic parameters of the 14 investigated sites. Letters from A to N represent the site name. Numbers, from 1 to 6, represent the six groups of sites obtained by an a priori classification
| Site No | Group of | Vegetation cover of the 14 sites | Pollution status | Total content (ppm) | Litter status | Particularity | ||
| site No | of the 14 sites | Zn | Pb | Cd | ||||
| A | 1 | Metallophyte grassland | Highly polluted | 17 956 | 4720 | 79 | High quantity | C/N=23 |
| Armeria maritima ssp halleri | Undecomposed | Alluvial soil | ||||||
| Cardaminopsis halleri | (6 cm depth) | Metallurgical zone | ||||||
| B | 1 | Metallophyte grassland | Highly polluted | 35 116 | 8271 | 190 | High quantity | Alluvial soil |
| Armeria maritima ssp halleri | Undecomposed | |||||||
| Cardaminopsis halleri | (6 cm depth) | |||||||
| C | 2 | Poplar plantation | Polluted | 1112 | 616 | 12 | High quantity | Alluvial soil |
| Arrhenaterum elatius | Undecomposed | |||||||
| (pseudometallophyte) | (3 cm depth) | |||||||
| D | 2 | Poplar plantation | Polluted | 3499 | 401 | 26 | High quantity | Alluvial soil |
| Urtica dı̈oica | Undecomposed | Metallurgical zone | ||||||
| (3 cm depth) | Liming | |||||||
| E | 2 | Poplar plantation | Polluted | >1000 | >400 | >10 | High quantity | Alluvial soil |
| Urtica dı̈oica | Undecomposed | |||||||
| (2 cm) | ||||||||
| F | 3 | Poplar plantation | Unpolluted | 286 | 73 | 2 | Abundant | C=64.5 mg g−1 |
| hydromorphy | ||||||||
| G | 3 | Poplar plantation | Unpolluted | 104 | 63 | <1 | Abundant | |
| H | 4 | Forest | Unpolluted | 44 | 75 | <1 | Abundant | pH=3.7 |
| I | 4 | Forest | Unpolluted | 101 | 115 | 2 | Abundant | |
| J | 5 | Field | Unpolluted | 241 | 58 | 1.8 | Absent | pH=6.9 |
| Tillage/pesticids | ||||||||
| K | 5 | Field | Unpolluted | 241 | 58 | 1.78 | Absent | pH=6.3 |
| Tillage/pesticids | ||||||||
| L | 6 | Grassland | Unpolluted | Absent | ||||
| M | 6 | Grassland | Unpolluted | 300 | 85 | <1 | Absent | C/N=12 |
| N | 6 | Grassland | Unpolluted | 77 | 40 | <1 | Absent |
2.2 Sampling protocol
At each site, eight soil cores (25×25×15 cm) distributed every 2 m on two transects, were sampled, air-dried, sieved and mixed thoroughly to form a composite sample. The resulting soil samples were analysed to quantify soil pollution by Zn, Cd, Pb (NF X31-151, [11]). In addition, the following supplementary variables were measured: C and N contents, CEC, pH and granulometry (Table 1). Soil macro-organisms were sampled on the same transects. Soil macrofauna was extracted using a modified Tropical Soil Biology and Fertility protocol, which consists of an application of a 0.2% formaldehyde solution to the upper 10 cm of soil, followed by soil hand sorting. Individuals collected were immediately fixed in 4% formaldehyde for further identification. The macro-organisms were identified at the level of morphospecies. The identification of most adult specimens was done at the level of species, while the remaining adults and larvae were identified to genus, family or class on the basis of the morphological differences between individuals.
2.3 Data analysis
2.3.1 Species diversity and species richness
We have chosen to gather the 14 investigated sites into six groups, in function of our knowledge of pollution status and land use [12] (Table 1, Fig. 1). This a priori classification was very close to the site clustering obtained using the K-means clustering method applied to the three first axes of the PCoA of species abundance [13]. In each case, the observed species richness was recorded and the Shannon diversity index computed. The evenness was also determined as the ratio of the Shannon index to its maximum value, i.e. ln2(species richness) [14]. The estimator of species richness and its associated standard deviation proposed by Chao [15] were computed to compare with observed values. Computations were realised using the software EstimateS [16].

Dendrogram of sites. Sites (A to N) were distributed into six groups (defined in Table 1) according to their pollution status and the type of vegetation cover. Numbers represent the cluster level.
2.3.2 The indicator value
In order to identify indicator taxa, we used a method proposed by Dufrêne and Legendre [13]: the indicator value (IndVal). Sites are first gathered into groups, e.g. various levels of perturbation or different habitat types using either a hierarchical or a non-hierarchical method to form a site typology. A given indicator species is defined as a species mostly present in a single group of sites and present in the majority of the sites belonging to that group. There are thus two components interfering in the computation of the IndVal index: one accounting for the specificity of the species, and the second accounting for the fidelity of that species to the groups of sites.
The indicator value for the species i, IndVali is the largest value of IndValij observed across all groups j of the site typology. It is maximum (100%) when all individuals of a species are found in a single group of samples and when the species occurs in all samples of that group.
The statistical significance of each index is evaluated using a standard permutation test. Sites are randomly reallocated among site groups (clusters) and the indicator values computed for each species. For a given species, the rank of the observed value in the randomly generated distributions ordered in decreasing order produces a permutational probability.
The indicator values can be estimated for any given level of clustering, which constitutes a useful property of the approach. Species may have different indicator values according to the clustering level under consideration. Generalist (core) species have decreasing values of the indicator index from high level to lower levels of the typology. Specialised (satellite) species, on the contrary, display increasing indicator values from higher to lower levels of the typology. In addition, the method allows identification of species typical for intermediate levels of site hierarchy. Computations were realised using the software IndVal2 [13].
3 Results
3.1 Site typology
Sites presented in Table 1 were empirically grouped into six units, according to their pollution status and the type of vegetation cover (Fig. 1). The first level of the classification grouped all sites. The second level separated sites according to the litter layer depth and distinguished herbaceous unpolluted sites (low litter quantity) from unpolluted woody and polluted sites (rich in litter). Among sites rich in litter, level 3 distinguished polluted sites from unpolluted wood. Level 4 separated metallophyte grassland from the polluted poplar plantation. Depending on the management practice, herbaceous unpolluted sites were divided at level 5 into grasslands and crops. The last level separated unpolluted natural forest from unpolluted poplar plantation.
3.2 Species density, richness and diversity
A total of 339 morphospecies was found among the 112 sampling units, with a cumulative number of 3465 individuals. Oligochaeta, Hymenoptera, Coleoptera, Diptera larvae, Arachnida and Isopoda were the most abundant groups (Table 2). Oligochaeta [Lumbricidae and Enchytraeidae] had higher density than the other taxa in the majority of sites. Their density decreased principally according to the land use type from 428 ind m−2 to 57 ind m−2 in unpolluted poplar plantation and unpolluted crops respectively, and according to the level of soil pollution, from 342 ind m−2 in unpolluted grassland to 4 ind m−2 in polluted metallophyte grassland. Coleoptera, Arachnida and Hymenoptera were the most abundant taxa in this metallophyte grassland. Rare species were generally found in unpolluted sites.
Macroinvertebrate density (ind m−2) in each group of sites and total number of morphospecies. Letters from A to N represent the site name
| Total number of | Unpolluted | Unpolluted | Unpolluted | Unpolluted | Metallophyte | Polluted poplar | |
| morphospecies | grassland | poplar plantation | forest | crops | grassland | plantation | |
| (L, M, N) | (F, G) | (H, I) | (J, K) | (A, B) | (C, D, E) | ||
| Oligochaeta | 18 | 342.7 | 468 | 279 | 57 | 4 | 76 |
| Hymenoptera | 10 | 62.7 | 0 | 1 | 0 | 28 | 0.7 |
| Coleoptera | 131 | 60.7 | 29 | 115 | 28 | 75 | 40 |
| Diptera | 58 | 10 | 49 | 611 | 2 | 14 | 74.7 |
| Arachnida | 57 | 14.7 | 28 | 33 | 2 | 24 | 22 |
| Isopoda | 3 | 7.3 | 113 | 26 | 0 | 0 | 23.3 |
| Gastropoda | 20 | 2 | 56 | 3 | 0 | 2 | 60 |
| Lepidoptera larvae | 11 | 2 | 2 | 0 | 0 | 8 | 3.3 |
| Myriapoda | 18 | 1.3 | 37 | 57 | 0 | 13 | 37.3 |
| Thysanoptera | 2 | 0.7 | 0 | 0 | 0 | 0 | 0 |
| Trichoptera larvae | 2 | 0 | 16 | 9 | 0 | 0 | 0 |
| Hemiptera | 4 | 0 | 2 | 2 | 0 | 0 | 1.3 |
| Dermaptera | 2 | 0 | 0 | 5 | 0 | 0 | 0 |
| Homoptera | 2 | 0 | 2 | 0 | 0 | 0 | 0 |
| Neuroptera | 1 | 0 | 0 | 0 | 1 | 0 | 0 |
Species diversity analyses were performed using all the morphospecies (339). Results showed differences in species richness and diversity between the six groups (Table 3). Observed species richness was mainly affected by the type of land use and, to a lesser extent, by soil pollution. Cultivated plots had much lower species richness than grasslands and woody sites (21, 76–80 and 105–126, respectively). Polluted grassland had higher species richness than unpolluted grassland, even if the differences were not important. The same trend appeared for polluted and unpolluted poplar plantations. The Shannon diversity index was higher in the polluted poplar plantation than in the unpolluted forest or poplar plantation. In grasslands, a similar trend was observed, with 50% higher values in the polluted site than in the unpolluted grasslands. Patterns of evenness and the Shannon index were similar across sites, except for the unpolluted crop that had a high evenness index, but a low Shannon index. This means that this site had a low diversity, because of the very low species richness and rare or very abundant species were less frequent than in the other sites. The Chao index was linearly correlated to the observed richness and thus accounting for it did not change the between-site comparison. This species richness estimation accounts for occurrences of both singletons and doubletons, i.e. those species present in only one and two samples respectively [15]. Seemingly, the proportion of these species was of no effect upon the pattern of species richness across our sites.
Observed species richness and indices of diversity in the six groups of the site. Letters from A to N represent the site name
| Sites groups | Site No | Sample number | Observed species richness | Shannon index | Evenness | Chao estimator |
| Polluted metallophyte grassland | A, B | 16 | 80 | 4.05 | 0.64 | 130 |
| Polluted poplar plantation | C, D, E | 24 | 126 | 4.15 | 0.59 | 203 |
| Unpolluted field | J, K | 16 | 21 | 2.38 | 0.54 | 26 |
| Unpolluted grassland | L, M, N | 24 | 76 | 2.52 | 0.4 | 138 |
| Unpolluted poplar plantation | F, G | 16 | 105 | 3.09 | 0.46 | 156 |
| Unpolluted forest | H, I | 16 | 117 | 2.22 | 0.32 | 190 |
3.3 The indicator value index
To determine if a species was an indicator, we first examined the significance of the index and arbitrarily retained a threshold of 25%. This means that a characteristic species is present in at least 50% of one site group and that its relative abundance in that group reaches 50% ([13] (p. 356)). Two hundred fifty-seven species were encountered less than five times and were removed from indicator values analysis (i.e., 75% of the total). Among the 82 species examined, only 21 were indicator species at least at one level of the hierarchy, i.e. five Coleoptera, two Diplopoda, three Chilopoda, three Gastropoda, six Oligochaeta, one Diptera, and one Crustacea (Table 4). Among the 21 indicator species, three were generalists, i.e. the IndVal index was maximum for the lower hierarchy level. An example of such a species (Lithobius crassipes) is provided in Fig. 2A. Nine species were found to be specialised species (satellite) like the centipede (scolopendridae) Cryptops savignyi (Fig. 2B) or the diplopod Polydesmus complanatus (Fig. 2C). Nine species like the geophilid Haplophilus subterraneus (Fig. 2D), indicated an intermediate level of the hierarchical typology.
List of the indicator morphospecies and some characteristics of their ecology
| Broad groups | Family genus species | Ecology |
| Coleoptera larvae | Rutelidae hoplinae | Endogeic rhyzophagous |
| Coleoptera larvae | Elateridae | Endogeic rhyzophagous |
| Coleoptera larvae | Elateridae | Endogeic rhyzophagous |
| Coleoptera larvae | Staphilinidae | Endogeic predator |
| Coleoptera | Staphylinidae Habrocerus capillaricornis | Epigeic predator |
| Adult Crustacea | Oniscidae Philoscia muscorum | Epigeic saprophagous |
| Adult Diplopoda | Polydesmidae Polydesmus denticulatus C. Koch, 1847 | Epigeic saprophagous |
| Adult Diplopoda | Polydesmidae Polydesmus complanatus | Epigeic saprophagous |
| Adult Chilopoda | Lithobiidae Lithobius crassipes L. Koch, 1862 | Epigeic predator |
| Adult Chilopoda | Geophilidae Haplophilus subterraneus Leach, 1817 | Epigeic predator |
| Adult Chilopoda | Scolopendridae Cryptops savignyi Leach, 1817 | Epigeic predator |
| Adult Gasteropoda | Snail sp. 1 | Phytophagous |
| Adult Gasteropoda | Snail sp. 2 | Phytophagous |
| Adult Gasteropoda | Slug | Phytophagous |
| Adult Oligochaeta | Lumbricidae Aporrectodea caliginosa | Endogeic geophagous |
| Oligochaeta | Enchytreidae | Endogeic geophagous |
| Immature Oligochaeta | Lumbricidae apigmented | Endogeic |
| Immature Oligochaeta | Lumbricidae pigmented | Epigeic |
| Adult Oligochaeta | Lumbricidae Dendrobaena attemsi | Endogeic acidophile geophagous |
| Adult Oligochaeta | Lumbricidae Lumbricus castaneus | Epigeic, acidotolerant |
| Diptera larvae | Endogeic geophagous |
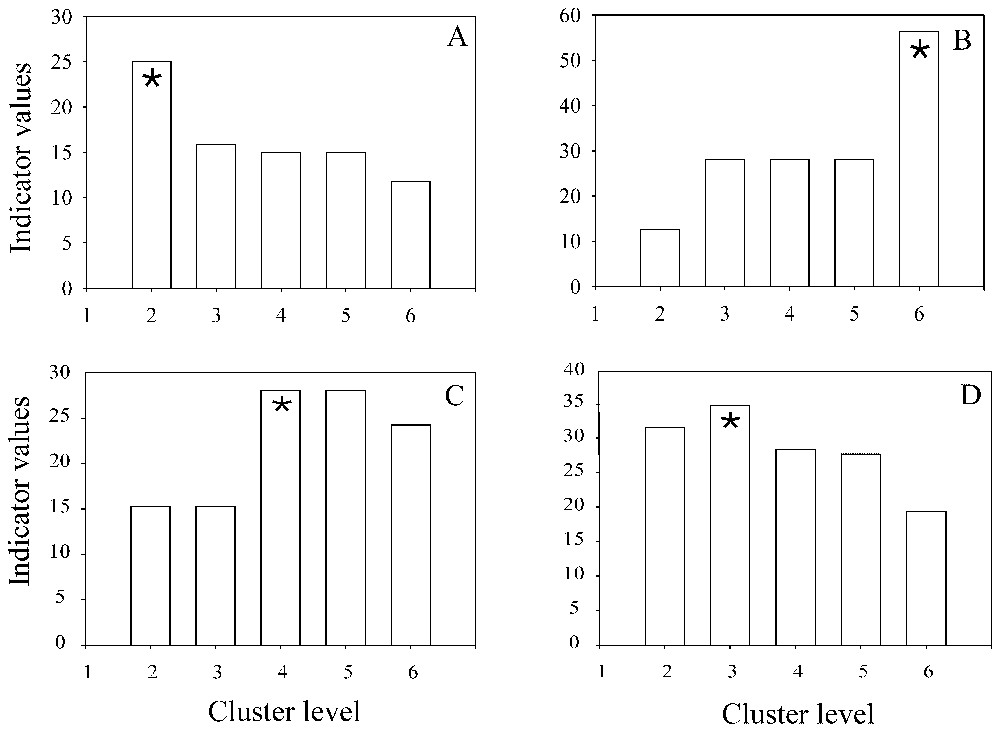
Changes in the IndVal index value from level 2 to level 6 of the cluster. (A) Lithobius crassipes. (B) Cryptops savignyi. (C) Polydesmus complanatus. (D) Haplophilus subterraneus. Star () indicates the higher value of the IndVal index.
Fig. 3 presents all the species that have a significant indicator value index larger than 25. Two immature pigmented and apigmented lumbricids had their indicator values as maximum for the first level of the hierarchy, i.e. all sites (level 1). At the second level, pigmented and apigmented immature worms and Aporrectodea caliginosa, appeared as indicators of the herbaceous unpolluted zone. At the next level, the unpolluted grassland group was characterised by the same three earthworm taxa plus two endogeic Coleoptera larvae (level 5). No indicator species was found for crops (level 5). Four epigeic taxa were indicators of sites with a thick litter system, with a maximum value for the centipede Lithobius crassipes (level 2). At level 3, seven taxa were indicators of unpolluted woods: Enchytraeidae (87.25), Philocia muscorum (49.29), Haplophilus subterranus (34.88), Lumbricus castaneus (30.85), Elateridae larvae (30.30), Diptera larvae (28.13) and Cryptops savignyi (28.13). Unpolluted woods were further divided into forest and poplar plantations (level 6). Forests were characterised by five specialist indicator species (one Diptera larva, 2 Staphilinidae, an earthworm and a millipede) and by two intermediate indicator species (Elateridae larvae and Enchytraeidae). Two gastropods, an earthworm and an Oniscida, were indicator species of poplar plantations (level 6). At level 4, polluted sites are characterised by three indicator species of the polluted poplar plantation: 2 Polydesmus sp. and a snail. No indicator species was found in metallophyte grassland.

Site typology and associated indicator species with indicator values in parentheses. Bold characters identify the highest IndVal index observed among clustering levels. Letters from A to N represent the site number (details in Table 1).
4 Discussion
The effect of soil pollution on macroinvertebrate diversity is rather complex. In this study, even if there were differences between polluted and unpolluted areas, diversity seemed to be more influenced by vegetation type than by pollution. Some studies showed a negative relationship between the Shannon index and heavy metal pollution [17], but for most studies, there is no correlation between these two parameters [18,19]. Furthermore, diversity indices are often described as very sensitive to various factors, e.g., the size of sampling unit, and are thus of limited predictive capabilities [20]. Cortet et al. demonstrated that diversity indices should be used carefully and only in extremely polluted sites [21].
The IndVal index [13] allows an evaluation of the indicator value of each species independently. Some problems may arise when considering the case of social insects like ants. Because these organisms are highly aggregated in space, their fidelity may be low, even in case of high specificity. This problem is obviously related to the standard sampling protocols that perform poorly for social insects.
We found three indicator species associated with polluted sites. These species were all epigeic (two Diplopoda and a snail) and this may be explained by the lower exposure of epigeic species compared to endogeic species [22]. However, both specificity and fidelity may also be favoured by the typical excess in litter observed in polluted sites due to reduction in decomposition rates [9,23]. As a consequence, distinguishing between direct and indirect effects of pollution is not straightforward.
However, direct effect of pollutant and the corresponding adaptation by species is well documented in some cases. For instance, snails are known to be able to develop heavy metal adaptation [24]. Some of them can survive high levels of metal in their food by modifying metal uptake and excretory rates [24]. Response of Diplopoda to metal pollution differs among species, as some species can be more abundant in polluted areas than in unpolluted sites [17,25]. Nevertheless, a recent study in comparable sites [6] showed the absence of correlation between Diplopoda density and soil metal content. This lucifugous group was probably favoured by the important quantity of litter and by moisture condition.
The results reported here suggest that in some cases species primarily respond to certain soil attributes rather than to the pollutant concentration, which is in accordance to the results reported by Grelle [6]. As an example in forest, soil pH was about 3.7 and the indicator value of Dendrobaena attemsi reached its maximum significant value. The species seems to be indicator of soil acidity rather than any other factor, in accordance with the description of the ecology of this endogeic worm proposed by Bouché [26]. Another earthworm species, Aporrectodea caliginosa, appeared to be an indicator of unpolluted grassland. Since this species is absent in cultivated plots, it may be affected by tillage and pesticide, as most earthworm species are [27]. On the other hand, this species is considered as very sensitive to soil pollution by heavy metals [28] and was absent from our polluted sites. This leads to a very important point regarding use of soil macroinvertebrates as bioindicators of soil perturbations. Since these species are very likely to respond to different environmental factors including direct effect of heavy metals there may be some confounding factors generating spurious relationships between the values of species as bioindicators and the pollution status that they are supposed to indicate. Extreme caution is therefore needed and field experimental testing should be promoted as often as possible.
Acknowledgements
The authors wish to thank Dr van Oort Folkert (‘Laboratoire de sciences du sol’, INRA, Versailles, France) for his assistance during fieldwork and soil analyses. We are grateful to Dr Claude Lattaud, Pr. Patrick Lavelle and Dr John Measey (University Paris-6 & IRD) for their valuable comments on an earlier version of the manuscript.