

1 Introduction
There are several technical approaches to a genome-wide analysis of gene expression, i.e., gene expression profiling. DNA microarrays [1], the most popular among related techniques, measures gene expression through hybridization intensity. Another technique named serial analysis of gene expression (SAGE) estimates gene expression levels from the frequency of cDNA tags generated by a complicated enzymatic process [2]. However, rare messages are difficult to be quantitated by these techniques. In spite of attempts to overcome this hurdle, application to real problems will still take some time.
RT-PCR has an apparent advantage of complementing the shortcomings of the above techniques. A recent comparison of RT-PCR with DNA microarrays demonstrated a clear advantage of RT-PCR in detecting rare messages [3]. However, RT-PCR has not been applied to large-scale analysis because of the tedious step of constructing calibration curves and internal standards.
Adaptor-tagged competitive PCR (ATAC-PCR) [4,5], an advanced version of quantitative competitive PCR, eliminates tedious steps for construction of calibration curves and internal standards. Consequently, it enables high-throughput gene expression analysis comparable to DNA microarrays. For three years, we have been applying this technique to various biological and medical problems including brain development [6,7] and cancer classification [8–10]. Through these works, we established ATAC-PCR as a matured gene expression profiling technique.
The vast amount of data obtained by expression profiling should give us information which cannot be obtained by conventional molecular biology. We have been studied biological processes in the mammalian nervous system to establish new approaches to biological systems. Our primary focus is to fill the gap between the genomic approach and knowledge obtained by molecular biology. We explored the relationships between gene expression patterns and functions in two systems: mouse postnatal cerebellar development and the polyglutamine-induced cell death in PC12. In the cerebellar work, we examined the usefulness of information in scientific literatures. In the PC12 work, we examined the functions by in vitro transfection experiments with genes selected by expression patterns.
2 Principle of ATAC-PCR
Adaptor-tagged competitive PCR (ATAC-PCR) is an advanced form of quantitative PCR designed for large-scale analysis. Each cDNA sample is digested with a restriction enzyme, and tagged with an adaptor cohesive to the end. cDNA samples are ligated with different adaptors: all the adaptors share a common sequence outside, and have a spacer region with a unique length. All the adaptor-tagged cDNA samples are admixed, and amplified with an adaptor-primer and a gene-specific primer. Amplified products are separated by polyacrylamide gel electrophoresis. Products derived from each cDNA sample are separated by the length of the spacer region, and the amount of each product represents the relative expression level of each gene.
Since we can use up to seven adaptors in the ATAC-PCR reaction, some (routinely three) are assigned as internal standards [5]. Three adaptors are attached to the same control cDNA samples. Different amounts of control cDNAs are added to the reaction mixture. A calibration curve can be constructed from the relationship between initial inoculated amounts and amounts of final products. With this calibration curve, relative expression levels in samples within the dynamic range are accurately quantitated. In addition, from the quality of the calibration curve, we can judge the quality of the assay itself. When 10, 3, and 1 equivalents of a control cDNA are used as control, the dynamic range of the detection is from 0.05 to 15–18 equivalents. Outside this range, quantitation is not accurate. Therefore, this technique is most suited for detecting small changes in gene expression around physiological levels of mRNA. An example of the assay is shown in Fig. 1.
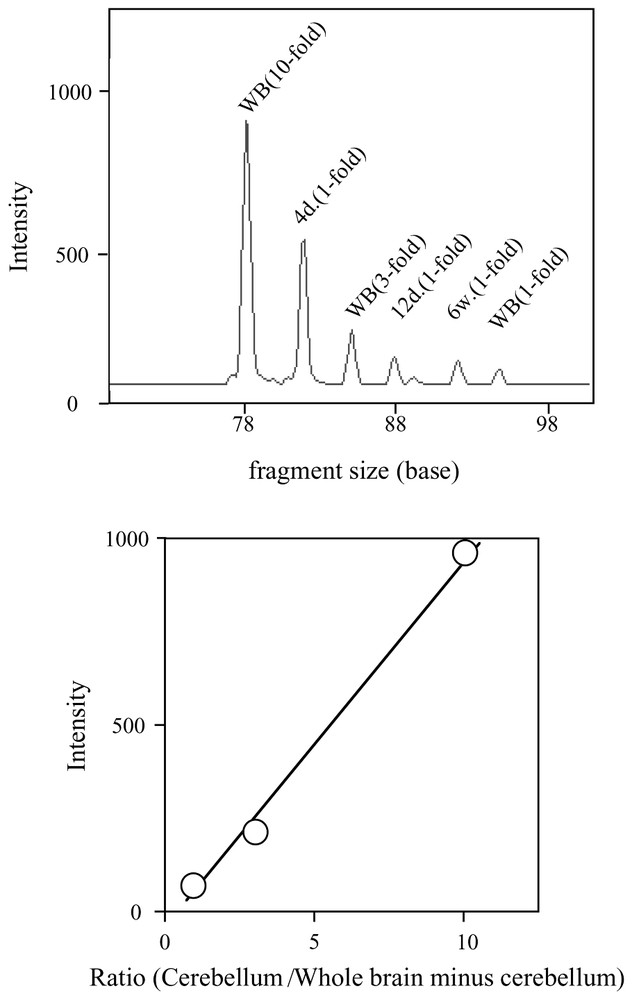
Quantitation of the stathmin gene transcript in mouse cerebellum by multiplex ATAC-PCR. MboI-digested cDNAs were made from 4-day (4d), 12-day (12d), and 6-week (6w) cerebellum RNAs and 6-week brain (WB). The WB cDNA was ligated to the MB-1, MB-3, and MB-6 adapters, and the 4d and 12d and 6w cDNA were ligated to MB-2, MB-3, and MB-5, respectively. The sequence of the stathmin gene-specific primer was 5′-AACCA TTCAA GTACA GTAGC-3′. The sequences of adaptors are available in the protocol posted at http://love2.aist-nara.ac.jp/laboratory/ATAC-PCR.html. (top) The electropherogram of multiplex ATAC-PCR. Each peak indicates the intensity of the PCR products amplified from the ten-fold (WB-10), three-fold (WB-3), and one-fold (WB-1) amount of the WB cDNA, one-fold amount of the 4d (4d-1), 12d (12d-1), and 6w (6w-1) cDNA, respectively. (bottom) The calibration curve made from the intensities of the WB-10, WB-3, and WB-1 products. Masquer
Quantitation of the stathmin gene transcript in mouse cerebellum by multiplex ATAC-PCR. MboI-digested cDNAs were made from 4-day (4d), 12-day (12d), and 6-week (6w) cerebellum RNAs and 6-week brain (WB). The WB cDNA was ligated to the MB-1, MB-3, and ... Lire la suite
The reproducibility of ATAC-PCR is quite high: when experiments are carefully performed, variations of measurements are within the range of 10%. The dynamic range of detection is very large. With RNA purified from a mammalian cultured cell line (PC12), the range of detection was over five orders of magnitude. With the budding yeast RNA, the range of detection is similar to that obtained by real-time PCR (T. Ito, personal communication). Cost of ATAC-PCR is similar to that of spotted micorarrays, although the speed of data production is less than one twentieth. The details of ATAC-PCR and its calibration obtained with synthetic oligonucleotide controls will be described elsewhere.
There are two related techniques of ATAC-PCR. One is introduced amplified fragment length polymorphism (iAFLP) [11]. The principle of iAFLP is the same as that of ATAC-PCR except for the use of oligo-dT vector-primer instead of biotin-labelled oligo-dT primer for cDNA synthesis. The other is a module shuffling primer [12]. With this technique, each adaptor has a unique sequence for the primer annealing region, but the sequence shares the same melting temperature and has the same amplification efficiency. The competitive PCR reaction is performed with a gene-specific primer and a mixture of module-shuffling primers with different fluorescent dyes.
3 Gene expression profiling of mouse postnatal cerebellar development
The cerebellar cortex is a classic model system in developmental biology, and has several advantages for gene expression profiling: (1) Because the granule cell occupies the majority of the cell mass, RNA purified from the cerebellar cortex may be regarded as that from the granule cell; (2) The postnatal development includes most of the events characteristic to nervous system development such as axon elongation, cell migration and synapse formation; (3) The developmental process is almost synchronous.
In rodents, the developmental process begins just after birth: the peak of granule cell proliferation is in the first week, and the peak of cell migration and axon elongation is in the second week [13]. The morphological changes are completed in the third week, and the slow maturation of synapses continues until about 6 weeks [13]. We analyzed this process in mice by gene expression profiling.
At first, 3′ end-directed cDNA libraries were constructed using RNA purified from mouse cerebellum at 4 days, 12 days and 3 weeks. More than 15,000 clones were sequenced, and 7728 unique sequences were obtained [14]. Then, more than 2500 genes were selected for primer design after the order of abundance, prioritizing known genes. The ATAC-PCR assay was performed using RNA purified from mouse cerebellum at 2 days, 4 days, 8 days, 12 days, 3 weeks and 6 weeks. The control was that purified from the cerebrum at 6 weeks. The sample at each time point was assayed at least twice with different calibrations, and complete expression data were obtained with 1869 genes.
After appropriate data processing, hierarchical cluster analysis was performed. Ward's method with standardized data was used for the clustering algorithm. Genes were classified by their developmental expression patterns. Clustering was truncated at 12 cluster levels, and a schematic representation is shown in Fig. 2. These 12 clusters were classified into three major groups: group A characterized by elevated gene expression at the earlier stage of the development, group B characterized by elevated gene expression at later stages of the development, and group C with miscellaneous expression patterns.
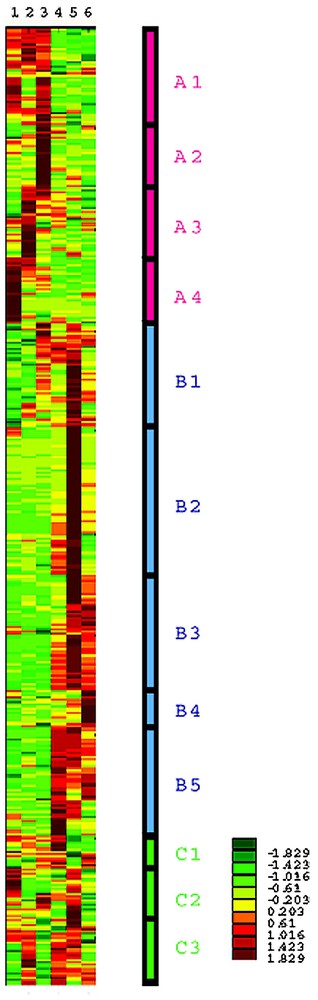
Cluster analysis of 1869 genes using their expression is standardized to z-score, i.e., converted to zero mean and unit variance, and schematically represented. Each row shows the expression pattern of each gene, and columns represent time points after birth: 2 days after birth (1), 4 days (2), 8 days (3), 12 days (4), 3 weeks (5), and 6 weeks (6). Expression levels are indicated by color, with scale shown in the right-bottom corner: dark red, yellow, and dark green represent high, middle, and low expression levels, respectively. Four clusters, A1-A4 are characterized by elevated expression at the early stages (from 2 days to 8 days) and decline; five clusters, B1-B5, are characterized by low expression at an early stage followed by elevated expression at later stages (from 12 days to 6 weeks); three clusters, C1-C3, are characterized by other complicated patterns. Masquer
Cluster analysis of 1869 genes using their expression is standardized to z-score, i.e., converted to zero mean and unit variance, and schematically represented. Each row shows the expression pattern of each gene, and columns represent time points after birth: 2 ... Lire la suite
We then tried to correlate gene expression patterns with their functions. Similar studies with the budding yeast use the functional classification by the Munich Information Center for Protein Sequences (MIPS) [15]. It is certainly useful for cellular functions, but not for the analysis of the mammalian nervous system. Our in-house EST collection contains more than 1600 known genes. To each gene, up to 4 keywords representing unique functions are attached. The total number of keywords is about 100 (A keyword list is available from our WWW site, http://love2.aist-nara.ac.jp/laboratory/download.html). There were 1053 known genes among the assayed genes, and we examined the correlation between gene functions and expression patterns using the distribution of the keywords. At the 12 cluster levels, 14 keywords were selected as significantly enriched in specific clusters (binomial test, p<0.01) [6]. Keywords ‘cerebellum-specific’ and ‘cerebellum-dominant’ are based on the ratio of expression levels between cerebellum and cerebrum: ‘cerebellum-specific’ means those whose ratio exceeds 20; ‘cerebellum-dominant’ means whose ratio is between 10 and 20. From the three-group classification (A, B and C), 11 keywords were selected (binomial test, p<0.05) (Table 1).
Functional categories enriched in specific groups of gene expression patterns during mouse cerebellar development. Each figure represents the number of genes belonging to each group and each functional category. Dark shade indicates statistically significant enrichment. Light shade indicates statistically significant rare cases
The correlation with gene functions was reanalyzed with the latest version of gene ontology (GO) terms (June, 2003) [16]. A total of 899 GO terms were attached to the above 1869 genes. Statistical analysis was performed on 109 GO terms associated with more than 10 genes. The GO terms significantly enriched in group A were mainly ribosome-related, i.e., RNA binding, protein biosynthesis, structure constituent of ribosome, ribosome biogenesis, cytosolic ribosome, and ribonucleoprotein complex (chi-square, p<0.05). The GO terms enriched in group B were ion transport and ion channel activity (chi-square, p<0.05). Although the GO term analysis was not as effective as the analysis by in-house keywords, the two methods of analysis captured similar characteristics in the data matrix.
These results clearly indicated that ribosomal proteins and cancer-related genes are highly expressed in the early stage of development. Those related to brain functions were highly expressed in a later stage of development or in the adult. In addition, genes involved in carbohydrate metabolism and RNA synthesis were elevated at a later stage of development. The results well agreed with the anatomical and physiological states at each developmental stage.
4 Gene expression profiling of cell death induced by polyglutamine
By interpreting the gene expression profile with literature information, we obtained an overview of the molecular events during development. However, the results are derived from previous information, and functional analysis of each gene or a group of genes is indispensable for a higher level of information. Although analysis of gene functions with animals is not an easy task, in vitro experiments with cultured cell lines offer a plausible solution.
As the first trial, we analyzed the cell death process using PC12 cell lines expressing polyglutamine as a model [17]. In this experiment, we examined whether the gene expression profiling could categorize genes working in the cell death process.
We developed stable PC12 cell lines which expressed exon 1 fragments of the HD gene with 23 or 74 polyglutamines driven by an inducible doxycycline-sensitive promoter (HD-23Q or HD-74Q, two lines each). We aimed to identify early perturbations induced by the mutation by studying expression levels of 1824 genes at 0 h, 5 h, 10 h and 18 h after induction, using ATAC-PCR. At these time points, the cells show no appreciable death or mitochondrial impairment. In order to identify genes showing changes which were likely to be due to the polyglutamine expansion, we selected genes whose expression levels exhibited similar significant changes in both HD-74Q cell lines but no significant changes in both HD-23Q cell lines. This selection process should have eliminated gene expression changes due to cellular effects of dox, activation of the promoter system, and cellular and genetic difference between individual cell lines. A total of 126 genes, including 69 known genes, exhibited statistically significant alterations in the HD-74Q cell lines but no changes in the HD-23Q lines. We tested 11 of these genes for their abilities to modulate polyglutamine-induced cell death in transiently-transfected cell models (Fig. 3). Five genes [glucose transporter 1 (Glut1), phosphofructokinase muscle isozyme (Pfkm), prostate glutathione-S-transferase 2 (Gstm2), RNA binding motif protein 3 (Rbm3), KRAB-A interacting protein 1 (Krip-1)] significantly suppressed cell death in both neuronal precursor and non-neuronal cell lines, suggesting that these transcriptional changes were relevant to the cell death pathway. The results indicated that gene expression profiling could categorize genes participating in the cell death under a careful experimental design.
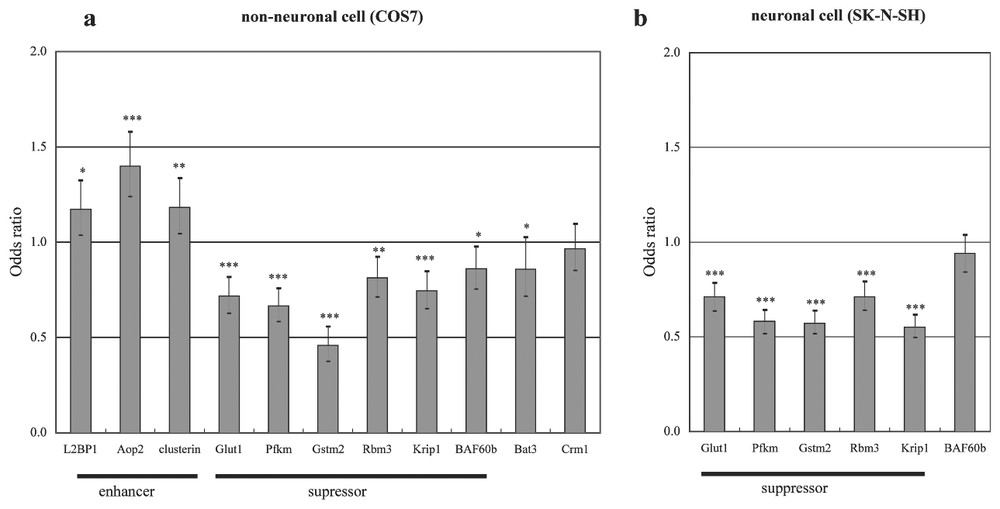
Effects of over-expression of various genes on polyglutamine-induced cell death in both non-neuronal and neuronal cells. (a) pEGFP-HD74Q was cotransfected into COS7 cells with an empty vector or with expression vectors carrying one of the selected eleven genes. After 48 h, cells were fixed and nuclei stained with DAPI and the proportions of dead cells were determined. Bars show the odds ratios (ORs) and 95% confidence intervals for two independent experiments in triplicate wells, relative to an OR of 1 for cells expressing the empty vector and the Huntingtin construct. (b) Genes that showed significant protection in COS7 cells were tested in SK-N-SH cells as described in (a)
Effects of over-expression of various genes on polyglutamine-induced cell death in both non-neuronal and neuronal cells. (a) pEGFP-HD74Q was cotransfected into COS7 cells with an empty vector or with expression vectors carrying one of the selected eleven genes. After 48 h, ... Lire la suite
5 Discussion
Unlike for DNA sequencing, there are no standard techniques for gene expression profiling. Each technique has its own merits and demerits, and researchers should select a technique for their purpose. Although not described in detail here, one of the merits of ATAC-PCR is the small amount and quality of RNA required for the reaction, which is about one hundredth of RNA required for microarrays, and is not susceptible to RNA degradation. Therefore, this technique is most suited for clinical samples. For biological problems, it is still uncertain whether ATAC-PCR has advantages over other techniques.
From the first report on hierarchical cluster analysis of gene expression patterns [18], gene expression patterns have been analyzed in correlation with gene functions. However, this kind of analysis has problems. Because there are too many terms or keywords representing functional categories, the identified correlation may be selected by chance. A more serious problem is that there are no good statistical evaluation methods for conventional cluster analysis such as hierarchical, k-means, and SOM. Because most studies use these methods, expression patterns identified by clusters are without statistical evaluation. Model-based cluster analysis offers grouping of genes with statistical assessment [9], but such grouping is usually conservative, and may not identify small clusters with biological importance. Consequently, this type of analysis may give hypothesis or suggestions for further studies, not a clear answer. In spite of these limitations, as demonstrated in our example, the analysis is useful to overview the data matrix.
In the above PC12 experiment, we selected genes by statistical criteria rather than clustering. We carefully designed experiments to select changes in gene expression only due to extended polyglutamine, and to eliminate those based on other factors. Eight out of eleven genes with expression patterns specific to the cell death process, exhibited functional activities for and against the cell death process. The high rate of finding functional genes suggests that such expression patterns are likely to be functionally correlated with the cell death. The main concern of this work is that the number of analyzed genes is too small for statistical evaluation.
Recently, two techniques for high-throughput cell transfection have appeared. One is reverse transfection [19] and the other is cell transfection array [20] using atelocollagen. These two techniques enable large-scale experiments of overexpression or suppression of genes (by siRNA). These techniques enable experimental analysis of the gene expression and function of genes, overcoming the limitations of small-scale studies. As commented recently in Nature [21], the majority of microarray data analysis is not statistically appropriate, and may have flaws. This implies that we need experimental methods to evaluate and utilize results obtained by gene expression profiling. High-throughput functional analysis should be one of the best methods for this purpose.