

1 Introduction
As France was celebrating the centenary of the 1895 Lumière projections, it appeared that the writings that aimed at recalling the founding principles of ‘photographic animation’ did scarcely more than repeat the 19th-century explanations based on ‘retinal persistence’. More recently (2004), one could read in an international journal that “the phenomenon of visual persistence lies at the heart of apparent motion”.
The following pages intend, if not to fill in the gap between today's state of knowledge and ideas that are still currently accepted, at least to try to display the ground which has been covered since Plateau and Faraday's days.
It will be noticed that this retrospect refers to the 20th-century cinematographic technique at the precise time when film is going to be superseded by digitalization, which leads to stating the problems in terms that will not be strictly the same.
2 Difficulty does not lie where one would expect it
2.1 The traditional tenet
“If, for one second, an image disappears and reappears ten times before our eye, we see it continuously and we are not in the least aware of its disappearances. If, instead of one image, ten images pass representing the same object in ten positions akin to one another, we will have perceived a single image, that of the object, but in its successive positions. Perceived in this way, with its momentary disappearances, a succession becomes for us, thanks to retinal persistence, an evolution, a movement.”
This explanation, provided by Marey1 in 1899 [1], had been formulated by Plateau [2,3], when he presented his phenakistiscope in 1833, and before by Faraday in 1831, as recalled recently by Nicholas Wade [4]. Helmholtz repeated it in 1866 and one often finds it in histories of the cinema [5]. It reappeared in 1995 in few texts celebrating the centenary of Lumière's public showings at the Grand Café. In the same text, Marey specified: “... the last image that has just imprinted itself on the retina remains there for an instant (about 1/10 of a second). And there, in this physiological law lies the secret of the illusion and the principle of the synthesis of movement.”
It is true that a few millisecond flash of light produces a sensation that lasts much longer. However, in spite of the apparent evidence and of a more than one-hundred-year-old tradition, to explain by visual persistence what happens when viewing a movie is the wrong answer to an ill-formulated problem.
2.2 Two functions, two requirements
Light is the raw material, so to speak, of the images that appear on the screen and one has to explain, on the one hand, the perception of a constant illumination, whereas the screen is actually half of the time in the dark and, on the other hand, the perception of perfectly linked movements which is created by a succession of frozen images.
2.2.1 The pressure of practice
These two perceptions correspond to two functions of the visual system, whose characteristics are highly different, and whereas this duality was ignored by the discourses about persistence, in the course of time, it imposed its demands to the movie technique. Thus, if a 24-frame-per-second filming, and therefore projection frequency, allows, still today, to perceive the movements on the screen at their natural tempo, in a jerkless continuity, the brightness and the area of the screens increasing, this frequency of 24 illuminations per second of the retina, applied in the years 1928–1930, became too low to avoid an unpleasant flicker.
To obtain a smooth perfectly steady visual sensation, one passed, later on to 48, then most often, to 72 illuminations per second. Consequently, when sitting in a movie theatre, we receive 24 frames per second, but each frame appears two or three times.
Thus in the cinematic conditions it is easier to obtain image continuity and apparent movement than brightness steadiness. The aim of the present paper is to study some characters of the history of the flickering brightness studies after examining the problem of the continuity of the cinematic images which can be perceived as static or as moving.
2.2.2 Static image persistence
The difference between images continuity and brightness steadiness is obvious in the experiment by van de Grind et al. [6]. A simple ring intermittently illuminated was presented on a dark background. Its brightness was modulated rectangularly in time, light and dark times equal. One determined the frequency at which the ring reached persistence of its contours. This frequency varied from about 3.8 to 4.8 Hz as the relative brightness varied from 1 to 1000. At these low frequencies, the brightness inside the contours continued flickering, the brightness fusion frequencies (not given) varying most likely from about 15 to 45 Hz, whereas the persistence of the pattern was not, or only slightly, dependent on the brightness level. Obviously, the two mechanisms seem very different.
Another case of static image persistence is the toy created by J.A. Paris in the late 1820s in London. His thaumatrope – as it was then called – is none other than the cardboard circle on which one draws on one side, for instance a cage, and on the other side a bird, so that, during the whirling of the card, the two images become superimposed and the bird appears inside the cage. In this toy as in the previous experiment the system results in a single static image or in superimposed static images, easily obtained, and in both cases, visual persistence is probably the main factor at play. Visual and not retinal: pattern or object identification is a cortical, not a retinal function.
2.3 Apparent movement
One often associates the thaumatrope to toys which were very successful at time as Plateau's phenakistiscope also invented by Stampfer in Vienna under the name of stroboscope and by Roget in London under the name of phantasmascope [4]. The great difference is that these toys create an illusion of movement.
While thinking about this illusion obtained with the stroboscope, psychologist Max Wertheimer was led to study apparent movement and to publish a voluminous paper on the subject in 1912 [7] regarded as the beginning of the Gestalt psychology movement. But, as Edwin Boring [8] very aptly expounds, the story begins earlier, and in that story, Exner's 1875 experiment, though quite simple, is rich in significance.
He presented two spatially separated, successive, electric sparks whose time order can be correctly perceived if the time interval between them is not less than 0.045 s. When the sparks are put closer to one another in space and the time interval reduced, the perception is no longer a succession, but the movement of a single spot from the earlier position to the later. For a correct perception of the direction of the motion the threshold was only 0.014 s. This interval is far too short to allow perception of temporal order, so Exner argued that the movement is an elementary sensation and not at all a complex of psychological processes.
Exner was not isolated, Mach's school sustained the same position and Boring also recalls G.H. Schneider's questioning in 1878: Why are objects so much easily noticed when they move a little than when they are at rest? For him also, movement is prior to the other conditions of sensations.
However, nothing further came of these ideas of the 1870s and 1880s. Helmholtz, who had come to Paris for the “Exposition internationale de l'électricité”, attended at Marey's home, in August 1881, the presentation of animated pictures by the American photographer Muybridge. Muybridge, Marey says: “Put end to end a horse race, taken by his cameras, and projected this series of pictures through a sort of phenakistiscope”. With a German interlocutor like Helmholtz, Marey was not likely to get any information about Exner's (who had been Helmholtz' student at Heidelberg) or Schneider's work. As for Helmholtz himself, persistence was sufficient to explain apparent movement. One had to wait for Wertheimer's intervention for psychological laboratories to start taking an interest in the problem of seen movement.
The numerical results of Wertheimer's many experiments are different from Exner's because the conditions were quite different: patterns instead of lights. In the case of two geometrical figures (rectangles for instance), with short intervals, inferior to 30 ms, both figures are perceived as in simultaneity. With intervals above 200 ms, they are perceived in succession and, between 30 and 200 ms, the optimum of movement perception is around 60 ms: a single moving object. Between optimal movement and succession, Wertheimer described a curious perception of pure movement that he named phi, “just a movement, not a moving across something”, said the subjects. As Boring wrote, “Wertheimer was following the tradition of Mach and Exner but he went further”.
2.4 Smooth and sampled motion
Aside from Wertheimer's neurophysiological hypothesis of a short circuit in the cerebral tissue, his experiments remain and his conception of movement as an immediate experience without reference to basic constituents came opportunely to counter the then prevailing associationism. And this conception retains its heuristic value: in 1986, David Burr, John Ross and Concetta Morrone [9] made reference to Gestalt movement and to Wertheimer in the introduction to a study in which this Australo-Italian team established the conditions (spatial frequency, temporal frequency, contrast) under which sampled motion of a drifting grating appears smooth to a human observer. Their results, added to those obtained since Burr's Cambridge thesis in 1978, broke down distinction between real and apparent motion. The variety of models was then what it is today, but the one they proposed was and is still particularly interesting. Their measurements for drifting gratings implied that “sampled motion is detected by exactly the same mechanisms as smooth motion, not by analysis of stationary images and changes in them from time to time”. Let us add that the concept of sampled motion is today currently used.
2.5 Seeing biological motion
We shall conclude with a new example of the pre-eminence of motion over the other components of visual perception, the stunning case of the perception of ‘biological motion’. Using the principle of Marey's method, small lights are fixed on the joints and, in the dark, a motion picture is made of the person sitting motionless in a chair and then rising and walking. When the motion picture is shown to naive observers, they are first mystified by a meaningless jumble of twelve dots, but as soon as the person rises and starts walking, the perception is of a human being [10]. In addition, this perception tuning seems to be in place before 5 months of age [11]. Not only the perception (the sensation) of motion, but especially of human motion, seems pre-programmed. It is more than what the nativist Mach, Hering or Exner would have hoped for.
As a conclusion, and without the arguments that would be provided by the study of the neurons of the visual system that are specifically sensitive to motion, it is obvious that the creation of motion on the screen, which amazed crowds of people in the late 19th century, has nothing to do with a retinal persistence and is actually less difficult to achieve than the disappearance of the unpleasant flicker created by repeating a brutal alternation of intense light and darkness. The history of flicker studies is evoked in the following pages.
3 From the duration of the light impression to the critical flicker frequency (CFF)
The problem arisen when trying to obtain a flickerless projection obviously did not exist before the beginnings of the movie industry. Originally, the researches aimed at measuring the “duration of visual sensation” and it seemed that the best way to obtain that was to use an intermittent luminous stimulation and to determine the interval between successive stimulations for which one obtained a continuous sensation. This interval was then supposed to correspond to the duration of the sensation.
We are faced here with one of the multiple examples of a research which, originally, was purely speculative and whose subsequent development fell largely within the framework of the laboratories of important firms linked with the movie industry and later with television.
3.1 The duration of the light impression and the duration of persistence
Plateau published in 1878 an Analytic Bibliography of the Principal Subjective Visual Phenomena from Ancient Times to the End of the Eighteenth Century [12], whose first section is headed: The persistence of impressions on the retina. The phenomenon was observed as far back as antiquity, but attempts at measuring it did not occur until much later.
Newton, in the Third Book of the Opticks [13], at Query 16, explains the circle of fire obtained by nimbly moving a burning coal, by the fact that “motions excited in the bottom of the eye by the rays of light are of lasting nature” and “continued about one second to cease”.
3.1.1 D'Arcy's experiments
Subsequently, the duration of the light impression was actually measured by the method of the red-hot coal by various individuals also quoted by Helmholtz [3] among whom one has to single out, ‘the knight’, Patrice d'Arcy, who presented to the ‘Académie royale des sciences’ of Paris in 1765 [14] a Memoir on the Duration of the Sensation of the Sight. Speaking as a physicist, he remarked that the duration of the visual sensation “may have an influence on the accuracy of our observations” and that it is thus interesting to know it. With this aim in view, he built a machine animated by a clockwork that rotated a steel rod, at the end of which he fastened the ember. He then determined the rotation speed for which an observer saw a closed circle of fire. The experiments were made in a garden by night, the observer watching from a dark room 50 m away. The result was or 133 ms as duration of one rotation. By varying the conditions of observation, he then came to “direct experiment which will remove all uncertainty”: he put a light behind the machine that rotated a large cardboard disc with an opening through which the light appeared at each rotation. In this experiment, one had a continuous sensation of light for a duration of about 145 ms between successive appearances. D'Arcy thus achieved what was probably the first experiment of intermittent luminous stimulation and we can say today that this frequency, in the order of 7 Hz, corresponds fairly well to what the device and the conditions allow to hope for.
3.1.2 Plateau and Helmholtz
In his doctoral dissertation, Plateau [15] in 1829, says that he used first an implement similar to that used by d'Arcy, a piece of white cardboard replacing the ember. But he then wanted to measure the total duration of the sensation “up to the moment when the impression gets barely perceptible”, he obtained 350 ms. In one of his other experiments, he used a disc with 12 white and 12 black sectors of equal width and rotated it in daylight. When a uniform grey was obtained, the duration of one revolution was 191 ms and he wrote that if one wanted to know “the duration of one undiminished impression”, one just had to divide 191 by 24. Curiously he does not do the division, the result of which, 8 ms, is surprisingly low (it corresponds to a frequency as high as 62.5 Hz, for a white paper in daylight... certainly in summer with a shining sun).
In the chapter headed Duration of the sensation of light in his Physiological Optics, Helmholtz [5], like Plateau, measured this duration with a rotating sectored black-on-white disc. He recalled Plateau's experiment, but probably confusing the duration of one revolution and the duration of the transit of a black sector, he commented that Plateau's result is “strikingly large” and he gave his own results: about 21 ms for the disc illuminated by the strongest lamplight and 50 ms in “the dim light of the full moon”.
3.1.3 Apparent persistence and total persistence
When d'Arcy wrote, “[...] if the impressions of objects are all the more lasting as they are more illuminated, the result will be [...]” he had scarcely any doubt about the answer, it had to be positive. But Plateau, then Helmholtz, had to notice that the duration measured with the rotating discs was, on the contrary, shorter when the stimulation was stronger. Helmholtz added: “[...] yet on the whole the effect persists longer”, whereas Plateau was more cautious when he wished that rigorous experiments showed that the total duration of the impression is longer when the impression is stronger. Since this time, a great number of these experiments have been performed, but, considering the great diversity of the procedures, it is impossible to draw a clear and definitive conclusion. In any case, with the flicker-technique it is evident that one certainly did not measure what one intended to measure. Augustin Charpentier, a physicist of Nancy, distinguished in 1891 total persistence from what he called “apparent persistence” [16].
3.2 Ambiguity in ‘the persistence theory’
“The leading fact here is that the intermittent light stimuli of a uniform kind, occurring with sufficient rapidity, produce the same effect on the eye as continuous illumination. For this purpose, all that is necessary is that the repetition of the impression shall be fast enough for the after-effect of one impression not to have died down perceptibly before the next one comes”.
Reading this Helmholtz' text [5], one cannot but understand that when the luminous stimulation, instead of being continuous, is intermittent, reducing the intervals is enough for the successive effects to follow one another and for one to recover the perception given by continuous stimulation. But this interpretation is immediately contradicted by what follows: “When a black disc with a bright white spot on it is rotated fast enough, a grey ring appears instead of the revolving spot. This ring looks everywhere perfectly uniform [...]. Of course it is not as strong as it would be if continuous white light fell on the retina; and so the ring looks grey instead of white.”
How can we reconcile the necessity for the effect of one impression not to have died down perceptibly with the fact that the resulting ring is grey and not white? In his criticism of what he called “the persistence theory”, O.F.F Grünbaum [17], in 1898 (at that time he was in Liverpool in the lab of Foster and Sherrington), points out the contradiction: “If the duration of exposure of the stimulus is sufficient for it to produce its maximum sensation, we should be led to suppose that the resultant ring would be as bright as its source [...]”.
Everything lies in this ‘if’ and Plateau in 1829 had already asked the question and given an answer: the ring is grey and not white, precisely because the duration of the successive stimulations is not long enough for it to produce the maximum sensation [15]. This explanation has been ignored by Helmholtz, and maybe by Grünbaum, and Plateau himself will not mention it until some years later, when the problem will be studied from quite a different angle by Talbot.
3.3 The Talbot–Plateau law
Henry Fox Talbot is well known for his invention of negative–positive system in photography (Talbotypes or calotypes), but he was actively interested in multiple subjects from mathematics to archaeology as well as photometry. In a paper read to the Royal Society in 1834 he said: “Photometry, or the measurement of the intensity of light, has been supposed to be liable to peculiar uncertainty [...]. I am persuaded, nevertheless, that light is capable of accurate measurement [...]” [18]. He explained that, when a white circle with one sector painted black revolves rapidly, if the grey tint which appears is uniform, it is because “in every point of the circumference, the white and black parts meet the eye during the same proportion of time.” Thus “the time may be employed to measure the intensity of light” and one can formulate this very simple law: if a luminary of a certain brightness is exposed intermittently, the regular intermittences being too frequent for the eye to perceive, the resultant brightness is to the actual brightness as the time of exposure to the total time of observation.
The following year, Plateau [19] objected that the uniform grey on the rotating disc shows that this grey depends only on the ratio but not that the ratio measures it. Therefore, he achieved a verification, matching the brightness of a black and white sectored disc for diverse widths of the white sectors against the brightness of a piece of white paper, in varying their respective distances from the flame of a stearine candle (on applying the inverse square law). He concluded that the law was exact and thus the Talbot law is also called the Talbot–Plateau law. Actually he varied the relative white duration in a rather narrow range (from 1/3 to 7/8) but subsequent verifications have confirmed the validity of the law. It is generally stated in the form:
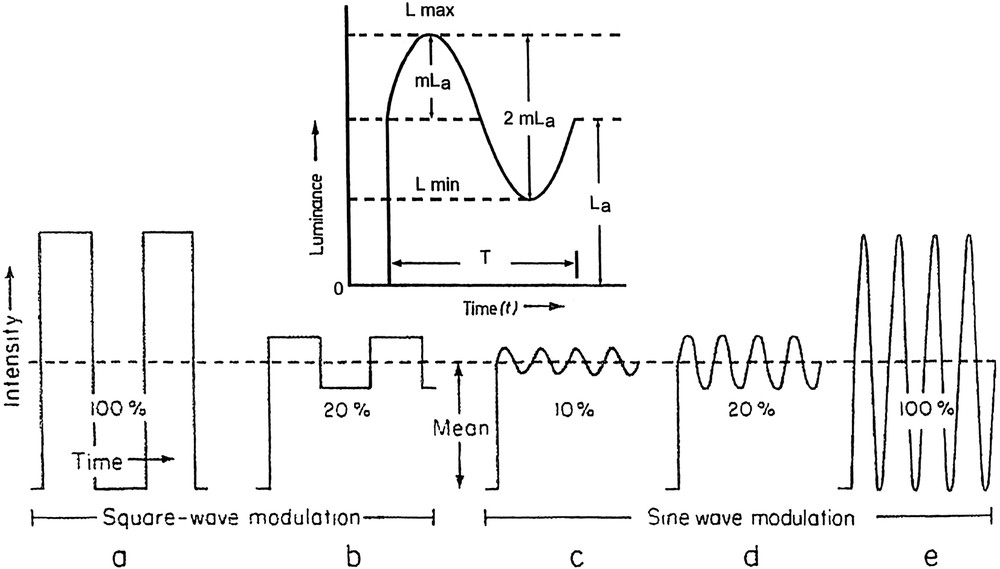
Examples of periodic stimuli. The curve on a represents the only stimulation used in the traditional works. In some of these works the relative duration of the light pulse (pulse to cycle fraction, PCF), of 0.5 on the figure, is varied. The percentages on the curves are the ratios of modulation amplitude to the mean. On the inset this ratio: , i.e. 50%. The period T=1/ƒ (Hz) or 2π/ω (radians) (from Abramov and Gordon [29] modified. With Permission from Academic Press, Elsevier).
3.4 The relation between persistence and brightness
3.4.1 Charpentier
In 1887, Charpentier used a rotating disc alternating opaque and cut out sectors in front of an adjustable light field and he claimed to have shown that the persistence duration varied inversely to the square root of the “luminous intensity” [20]. But his procedure was far from the classical one, he fixed one constant light time and 4 dark times and thus 4 frequencies and adjusted the light level so that the flicker ceased. In these conditions, the light-time fraction of the period varied from 0.0625 to 0.50. Unfortunately, these results were sometimes presented as if they had been obtained for a light-time fraction of 0.50.
3.4.2 Erwin Ferry
Erwin Ferry, in New York, some years later, in 1892, in order “to determine the principal factor producing persistence in vision”, plotted “curves showing the relation between the duration of the retinal impression of eye and the wave-length of light observed for spectra of different intensities” [21]. He used a diffraction-grating spectrometer and a rotating disc with two cut out opposite sectors of ninety degrees interposed between the lamp and the collimator.
He determined for each wavelength its relative luminosity and for a same wavelength he varied the luminosity. From the speed of rotation of the disc he deduced “the duration of the maximum impression on the retina”. He presented the tables of results and concluded “that color is at most a slight factor in retinal persistence and that luminosity is the all-important factor” and he proposed an approximate empirical law: “The duration of retinal impression is inversely proportional to the logarithm of the luminosity, or in the form of an equation: ”, adding that “it is interesting to note the similarity with Fechner's law [...]”.
From the equation of D one has drawn and whence (where ), the critical flicker frequency (CFF) is proportional to the logarithm of the luminosity. This is “Ferry's law” which Ferry, interested only in persistence, has never propounded. Additionally, he never plotted any curve showing the relation he proposed. His data, which covered less than two log units, if plotted on graphs of D in function of in all cases show some curvature.
Convinced that the phenomenon was related to Fechner's law, he preferred to follow this idea rather than linger over the experimental results; thus his name was given to a law that he had neither formulated in terms of frequency, nor actually demonstrated.
3.5 The relation between CFF and brightness
3.5.1 Porter's long work
The flicker logarithmic law was really established by the works of the Englishman T.C. Porter, published in 1898, 1902 and 1912 [22]. He used a rotating half-black, half-white disc whose illumination can vary in the range of a little more than 5 log units. Also he provided information that made it possible to calculate the absolute value of the stimulations and to compare his results with those of subsequent works. In 1902, he presented the table and the graphs of his data and proposed the equation . We have reproduced in Fig. 1 his 1912 graph, which included several data obtained after 1902, particularly in the range of low levels of illumination of the disc, where the slope of the curve is lower. Porter gave for this slope and for the slope of the main segment .

CFF as a function of log luminance of the disc. Porter's original figure (1912) modified: X and Y axes were Y and X axes on the original. Zero on X axis corresponds to a luminance of about 0.01 candelas m−2 (from Porter [22]).
His new data had fully confirmed the reality of two different slopes and Porter, who did not use an artificial pupil, verified that the break was not due to a lack of expansion of the pupil at the low illumination. Such was not the case and he left the problem unsolved.
It is interesting to note that in 1898, he was still calculating the duration of the impression on the retina. And when in 1902 he still commented about “The actual ‘last’ undiminished of the impression”, he used Plateau's (and Ferry's) vocabulary, he still belonged to the 19th century. However, when in the same text he gave his results as the number of revolutions per second, he belonged to the 20th century. Grünbaum had already adopted the term ‘frequency’ in 1898.
The transition from duration of the persistence to frequency was not motivated by theory only, because, with the appearance of the ‘cinematography’, the problem of the choice of the projection frequency was becoming important from a practical point of view. Porter had perfectly understood it. In 1902 he wrote: “Although the primary object of this research is to throw light upon the process of vision [...] we can easily determine [...] the number of pictures that must be projected on the screen per second in order that there may be no trace of flicker”. He roughly estimated it at 50 “where the arc light is used for projection, though half this number would probably be sufficient to prevent the flicker from being distressing”.
3.5.2 The authoritative works of Hecht's school
Apparently more physicist than physiologist, Porter had not made the link between the two slopes on his graph and the retinal ‘duplicity’ established some years earlier. One of the numerous contributions of Selig Hecht and his collaborators, in New York, from the 1920s to the 1940s, was to show that the first segment results from the activity of the rods and that the steeper segment results from the activity of the cones.
Fig. 2 assembles the curves that condense the results of the works of Hecht's school [23] on the variations of the Ferry–Porter law as a function of different parameters, eccentricity (in A), diameter of the test patch (in B) and wavelength (in C). For this last graph, the luminances of the different wavelengths have been equalized in photopic conditions (cones vision) and they become different in scotopic conditions (rods vision), this causes a separation of the curves at low values of I, although they are coincident at higher values.
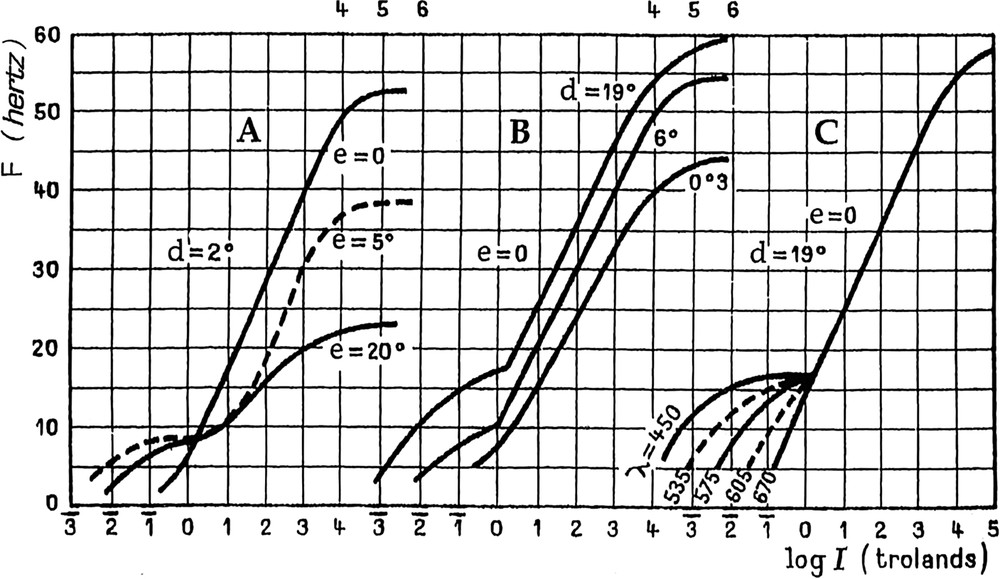
CFF versus log retinal illuminance I as a function of the eccentricity e (in A), the diameter of the test patch d (in B) and the wavelength λ (in C). The retinal illuminance I=LS, in trolands, is defined as the product of the luminance L of the stimulus (in cd m−2) and the area S of the pupil (in mm2). After Hecht [23].
Calculations show that the coordinates of the point of break on Porter's curve and on Hecht's curve in B are not far from each other. This break is not always observed and, from Porter's plots, it would be possible to draw a smooth transition from scotopic to photopic conditions. One also has to notice that at 60 Hz, Hecht's curve reaches its horizontal asymptote while Porter's plot at 65 Hz is still on the straight segment.
3.6 The situation in the mid-20th century
At mid-century, what was generally measured was the critical flicker frequency, CFF. In more than one thousand works, the brightness changed abruptly from zero to maximum in a more or less rectangular form.
The two main flicker laws had been in fact established very early, Talbot–Plateau's in 1834–1835 and Ferry-Porter's in 1902, the latter not always correctly interpreted as we will see. The subsequent works used the visual flicker response for practical and theoretical purposes. In his 1961 review, Piéron collected the results of various theoretical studies that formed the basis of his attempt at a general synthesis, in which “critical dark time” and “fusion” were among the prevailing notions [24]. For greater convenience, we still use this word of “fusion” although it suggests that, when frequency increases, dark time decreases and successive sensations get closer to one another and are then linked together to form a continuous sensation. Piéron entitled a paragraph of his review, From the notion of persistence to that of homogeneity. He was convinced that this homogeneity was coded by specific neurons in the visual system. If we add what he wrote in 1962 about the discussions on the role of harmonic phenomena in flicker, namely that they “are and will continue to be futile” [25], we can say that he perfectly represented the pre-1950 period.
What we call fusion is only the consequence of the incapacity of the visual system to ‘follow’ the periodic stimulation beyond a certain frequency. Then the correct question is not “what is the frequency at which we reach fusion?”, but “what is the frequency at which we become unable to perceive flicker?”
This reversal opened the way for new problematics, which led, in the 1950s, to a conceptual revolution in flicker studies.
4 System analysis and visual processes
4.1 Hendrik de Lange's approach
4.1.1 System analysis applied to visual processes
In 1952, the Dutchman Hendrik de Lange, an electronic engineer, published the first article about his experiments on flicker [26]. He presented in Delft, in 1957 in his dissertation [27], a synthesis of researches whose spirit was at complete odds with former works. He was writing in 1952: “Considering the fact that the eye retains the received image for a moment, the disappearance of flicker at a high rate of intermittence is normally explained by the ‘filling in’ of the dark phases. However, this approach to the explanation of the phenomenon does not lend itself to calculations and closer formulation.”
As a good engineer, he thus applied to the visual system the method classically used in the study of systems, the setting up of input–output relations. The task becomes simpler if one is lucky enough to be dealing with a linear system (one in which the input–output relations are described by linear equations) because, in such a case, if the input varies following a sine function, the output is also a sine wave of same frequency, but whose amplitude and phase are a function of the frequency.
We shall confine ourselves to variations of amplitude. If for various frequencies, we measure the attenuation, the ratio between the input and output amplitudes, on plotting attenuation values as a function of frequency, both on a logarithmic scale, as is usual in electric filter technique, we obtain the Bode diagram of the system or, in our particular case, its temporal modulation transfer function.
But we cannot generate an input sin ωt (positive–negative oscillation) with a luminous flux, contrary to what is possible with an electric current and the visual sinusoidal stimulus (Fig. 3) can be described as with a ‘dc’ component, , and an ‘ac’ component of amplitude , and frequency . is the time-average value and therefore the adaptation level of the eye. One can deduce from the figure that and that the amplitude and thus that the ratio of the ac-to-dc components, called here modulation .
Now, two questions remain: about the linearity and about the output, which is not a sine wave but the perception of a flicker.
Is the visual system or more specifically the brightness system, linear?
According to the Ferry–Porter law, the response is no. However, the situation is not hopeless: according to the Talbot–Plateau law, the luminance of a dark and light alternation at and above fusion is proportional to the light-time fraction of the period, not to its logarithm, that is to say that the system works then linearly.
The output amplitude problem is solved by de Lange [28], as follows: “The need for estimating the amplitude of the brightness variation as psychological output quantity is avoided by using the eye as zero instrument.” The result is given by the modulation value corresponding to the disappearance of the flicker. We thus proceed at constant output and it is the input amplitude that varies according to frequency.
In many traditional works as in the experiments of Ferry, of Porter and in those of Hecht concerning the curves of Fig. 2, the light-time and the dark-time fractions were equal. Fig. 3a shows the luminance variation over time thus obtained: a square wave modulation of 100%. It is obvious that, in this type of experiment, the mean luminance or adaptation level and the absolute amplitude of the light stimulus are linked. The dc and ac components of the stimulation are not dissociable and therefore in the classical procedure it is impossible to analyse the respective role played by each component.
But it becomes possible if one uses de Lange's procedure of which the sequence of graphs c, d, e on Fig. 3 shows the principle: mean luminance and modulation amplitude are independent and by choosing a value for the mean , one can apply a sinusoidal modulation varying in amplitude and determine the corresponding frequencies. By repeating the operations, with different values of , one obtains a family of curves from which it is possible to analyse how the system works.
4.1.2 Procedure and results
After using the sectored rotating discs, de Lange had opted for Polaroids (one fixed and one spinning). His test field of only 2° diameter was surrounded by a 60° field having the same brightness . He used a 2.8-mm-diameter artificial pupil.
Fig. 4 shows the results obtained with one observer for seven levels of mean retinal illumination. As is usual for the attenuation characteristics of linear systems in control and communication engineering, the rate of modulation m (called here ) on Y axis grows downwards (thus the sensitivity grows upwards). The 0.375-trolands (called here photons) level stands at the limit usually established between mesopic vision (cones and rods) and scotopic vision (rods only), which accounts for the position of the curve on the graph.

“Attenuation characteristics of the brightness system for white light from 0.375 to 10 000 photons, for observer”, L.H. de Lange's original figure and caption (1957). At the time one used ‘photon’ for ‘troland’, c/s for Hz and de Lange used r % for the modulation ratio threshold (increasing downwards) (from de Lange [27]).
In the lowest frequency region the curves run horizontally and for the 3.75-td to 1000-td curves, the value r at 1.5 Hz varies little, from 1.1 to 1.7%. With a period as long as 0.67 s, perception is more like simple detection of luminance variation than the perception of flicker. The quasi-equal relative threshold amplitude for various luminance levels illustrates the Weber law (1846), according to which the relative threshold amplitude vs. is constant (at least for medium levels). Thus it is obvious that up to 2 or 3 Hz, the brightness system is not linear.
As the frequency increases for the curves above 1 td, a peak appears, increasing towards higher sensitivity and slipping towards higher frequencies as the mean luminance increases. Above 2 or 3 Hz, the frequency increase results in an increased sensitivity of the system. At 375 and 1000 td, the amplification increases up to about 9.10 Hz, for higher frequencies it decreases and only then does a smoothing effect occur. At first, de Lange called the peak phenomenon a resonance effect and later a pseudo resonance.
After the peak, as the frequency increases, the attenuation increases very markedly for a small change in frequency, and de Lange considers that this part of the curves can be regarded as giving attenuation characteristics, for the brightness system, of a low-pass filter.
4.2 Herbert Ives, a forerunner with no following
As G. Sperling very aptly remarks: “The advantage of using sine-wave-modulated stimuli is that, if the system is linear, the analysis is completed; if it is not linear, the sine wave reveal this fact better than any other stimulus.” [30] But in hundreds of experiments that, since Plateau, have been modulating the stimulation with sectored rotating discs, the temporal profile of the light impulses was not a sine, but a rectangular wave, and the question that arises is that of the influence of the form factor of the intermittent illumination on the CFF.
Ives seems to have been the first, in 1922, to study this influence [31] and he arrived at the conclusion that, above about 9–10 Hz, the CFF for all waveforms was determined by the amplitude of the fundamental, i.e. the first periodic term of the Fourier analysis representing the waveform.
In his first experiment, in 1952, H. de Lange reaches the same conclusion as Ives, specifying that the influence of the fundamental over the CFF was exclusive only for ripple ratios >2%, but he does not refer to Ives' work [26]. Only in his thesis as a comment on the numerous traditional works he wrote: “Only Ives (1922) has used a sinusoidal variation. This was later suggested by Cobb (1934), but he himself never applied it, nor have others.”
For thirty years the way opened by Ives was disregarded by the students of flicker.
4.3 The renewal initiated by de Lange's works
The title of Donald H. Kelly's Ph.D. thesis presented at UCLA's Department of Engineering, in 1960, System analysis of the human visual process, would have been suitable for de Lange's dissertation presented three years earlier.
Kelly took up de Lange's method [32] and, as he, established the modulation threshold curves at various levels of retinal illuminance, but his experiments differed from de Lange's in the nature of the stimulus field presented to the observer, an ‘edgeless’ 68° circular field. The luminance was uniform out to a full field of 50° and, in the remaining ring it fell gradually and smoothly to zero.
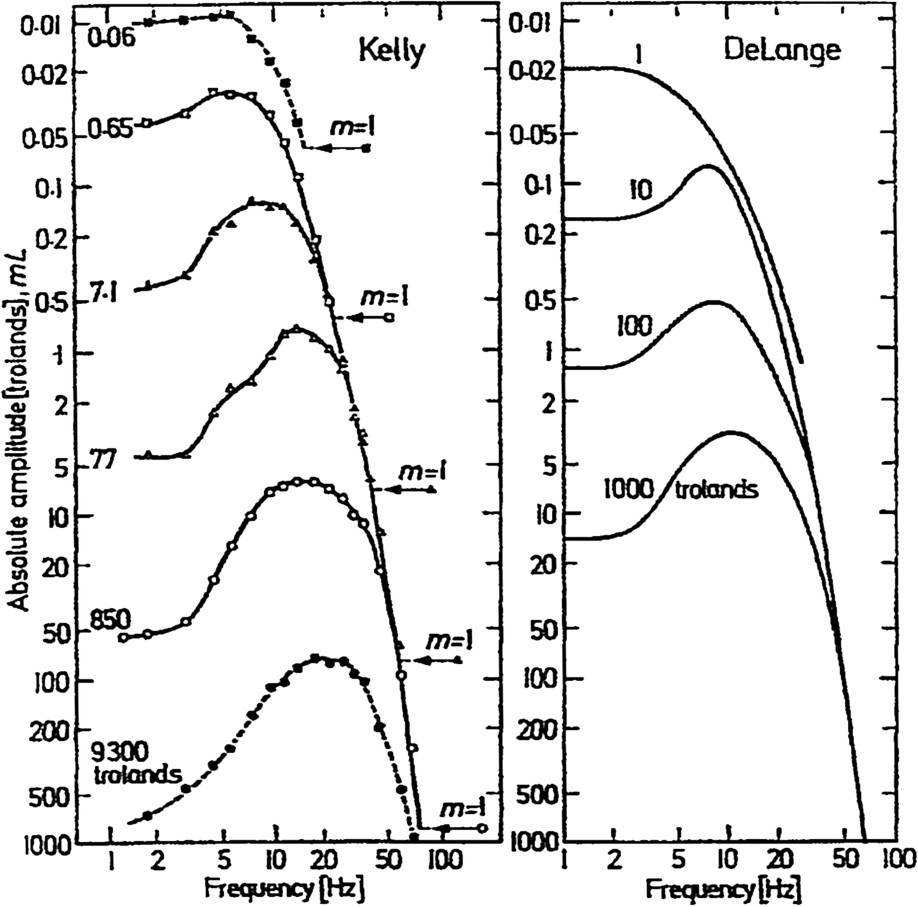
Fig. 5 shows the curves obtained at six levels of mean illuminance. Its general aspect is the same as Fig. 4. Gradually, as the level increases, the peaks shift towards higher frequencies and the sensitivity increases. The low position of the curve at 0.06 trolands suggests the intervention of the scotopic system and, as on de Lange's graph, at all other retinal illuminance levels the curves converge towards a common threshold value at the lowest frequencies. However, this threshold is less than 2 percent in de Lange's small field and more than 6 percent in Kelly's wide field case. And de Lange's stimulation differed from Kelly's not only because the flickering area was smaller but also because a sharp edge was near the fovea. In 1969, Kelly [33] resuming his analysis of the differences, thanks to modulation measurements, showed that patterns effects, as opposed to area effects, are confined to frequencies below 10 Hz and can be explained in terms of the temporal characteristics of lateral inhibition.
“Relative amplitude sensitivity versus modulation frequency for observer DHK at six adaptation levels, in logarithmic coordinates”, Donald Kelly's original figure and caption (1961). Threshold amplitude m, on the left Y axis, is the dimensionless modulation expressed Fig. 4 in %. On the right Y axis, amplification is equivalent to relative sensitivity. (From Kelly [32]. With permission from the Optical Society of America.)
4.4 Adaptation level and linearity
For de Lange, the light stimulus depends on two parameters, the adaptation level determined by the average luminance of the test field and the ripple ratio r (or m), which, in the case of a sinusoidal modulation, is its amplitude divided by the average luminance. The realization of this duality constituted an important advance. The curves in Figs. 4 and 5 attest to it.
As we have seen on these figures, in the lower part of the frequency band, the brightness system obeys the Weber–Fechner law and, as concerns its linearity in the higher frequency range, the main argument was the Talbot–Plateau law.
On the one hand, the modulation thresholds depend on the adaptation levels but, on the other hand, if a system works linearly the input–output ratio is independent of the input level. As Kelly [34,35] pointed out: “[...] if the high-frequency flicker thresholds are really governed by a linear filtering process, then the response to the ac component must be independent of the dc component (i.e. adaptation level).”
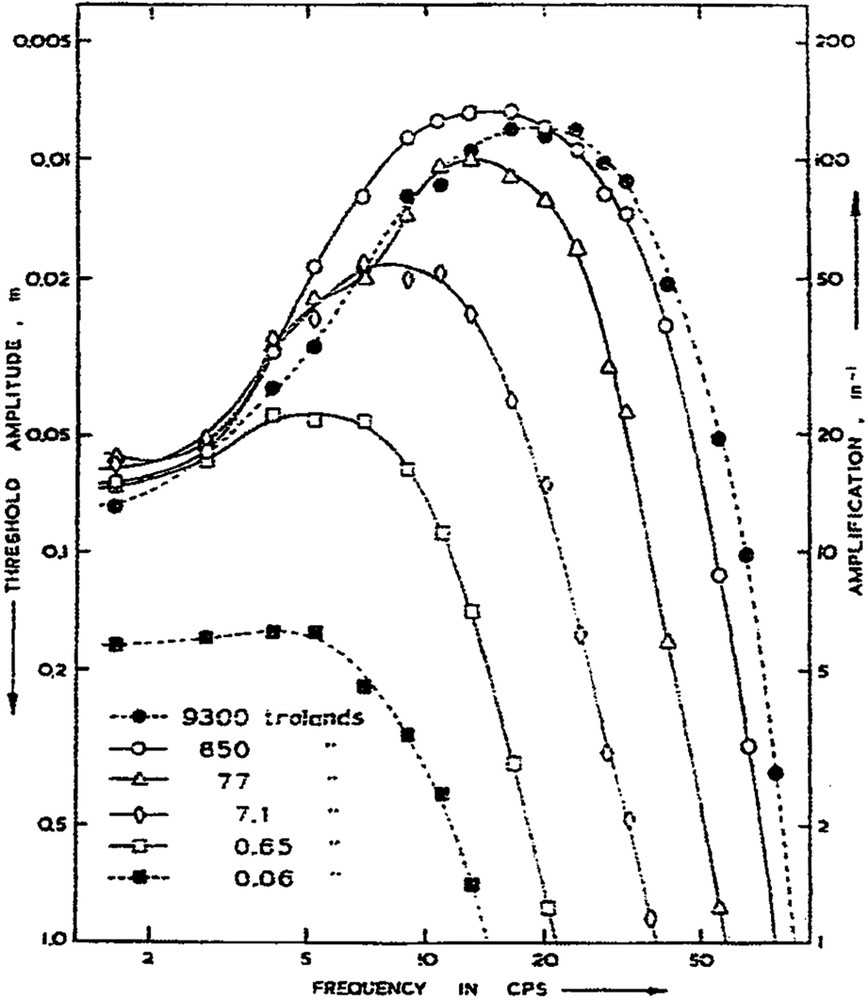
To test this statement Kelly [32] plotted on the Y axis instead of m (dimensionless) the product (in trolands), absolute amplitude of the modulation. If the threshold values of these inputs are really independent of the dc component, we should have only one response curve in the high-frequency range. Fig. 6 shows that it is the case for values from 0.65 to 850 trolands and for modulation value m greater than a few percents (just where the first periodic Fourier component for other waveforms is alone at play).
The curves from Fig. 5 (Kelly) and Fig. 4 (de Lange) replotted in terms of absolute retinal illuminance amplitude mL in trolands. mL is in Fig. 3. (Kelly [35], reproduced from Kelly [32] and Levinson and Harmon [36]. With kind permission from Springer Science and Business Media.)
Some months later, John Levinson and Leon Harmon [36] replotted de Lange's data in the same way. One of the advantages of logarithmic coordinates is that each curve in Figs. 4 and 5 is merely shifted downward by an amount proportional to the logarithm of , its shape is unchanged. As shown in Fig. 6, the result was the same and Kelly pointed out that the small field and the large field flicker thresholds, different at low frequencies, are practically identical at high frequencies. Also, regardless of field size, the amplitude thresholds in Fig. 6 are independent of the adaptation level at high frequencies and approximately proportional to it at low frequencies. Between these two obvious behaviours, the generation of resonance or pseudo-resonance peak is more difficult to explain.
Another remark of Kelly is of fundamental importance: according to the traditional formulation of the Ferry–Porter law, the CFF is proportional to the logarithm of the luminance (or retinal illuminance) and implicitly (and often explicitly) this luminance is that of the adaptation level, the dc component of the stimulus. This interpretation is erroneous: the stimulus frequency, along the common asymptotes in Fig. 6, varies with the logarithm of the absolute amplitude threshold, the ac component of the stimulus, and is independent of the dc component, and Kelly said: “It is merely an accidental artefact that the two quantities where usually related by a constant factor” (e.g., for the traditional square-wave stimuli).
Kelly [35] also observed that the high-frequency envelope of the flicker thresholds is continuously downward curving, that is to say that the equation of the curve is not a power function. But when the frequencies were put on a linear scale this envelope became continuously upward curving, that is to say that the relation does not obey exactly a logarithmic law. Consequently, “the inevitable conclusion is that, although the high-frequency envelope of the sine-wave flicker is not a power function, it is not exactly exponential either: i.e. at least to the extent that the CFF is governed by a linear process, the Ferry–Porter law cannot be rigorously true [...] Obviously the desired relation must be close to the Ferry–Porter Law, but not so close that it fails on the ground of physical realizability.”
4.5 Flicker thresholds and harmonic analysis
4.5.1 The opposition
We have seen that, as early as 1922, Ives had to come to the conclusion that for the various light stimulation temporal profiles that he was using, the CFF was determined by the fundamental frequency amplitude. It is not impossible that this assertion rather than to turn the flicker studies towards the right way, is partly responsible for the harmonic analysis being neglected until de Lange's work, whose importance was, once more, not always understood.
Thus, in 1961, Henri Piéron [24] to whom de Lange had sent a copy of his dissertation, wrote: “We have just mentioned the research of de Lange who employed sinusoidal stimulation. This is a method that has been used more and more frequently.” He was sceptical about explanations that would be based on the wave form and the harmonics, according to him, these problems “are to be sought in the distribution of the amount of photons delivered and not in the wave theory”, adding in a footnote: “Ives appealed to Fourier analysis, but, in a practical sense, only the fundamental is operative.”
If such is the case, why trouble oneself about harmonic analysis? All the more so, as according to some authors, the classical stimulation abruptly alternating dark and light may have seemed the simplest method: the sinusoidal modulation, more difficult to carry out seemed uselessly complex and harmonic analysis seemed a superfluous luxury. As Horace Barlow [37] reminds us, it is not easy to accept the fact that one can represent a transient event, such a sharp click, by a set of superimposed sine waves of indefinite duration, and leading mathematicians disbelieved Fourier, in 1807, when he stated the principle of harmonic analysis which was to prove so useful in a great variety of fields.
4.5.2 Usefulness of harmonic analysis, first example
Fig. 7 from the excellent Visual Perception, by Tom Cornsweet [38], intends to show that harmonic analysis is not a useless luxury. It allows us to understand the behaviour of the brightness system when the intermittent stimulus is the classical square-wave with equal duration of light and dark. In this case the square wave can be represented by the sum of the odd harmonics:

Analysis of the behaviour of the brightness system when stimulated with square-wave intensity modulation at mean level 7.1 trolands. First column: plots of intensity versus time for the flicker stimuli from 10 to 40 Hz. Second column: plots of the Fourier periodic components of these stimuli, [sin(nωt)]/n, n=1,3,5,7,9; they constitute the input spectra. Third column: plots of the relative amplitude of the components of the input spectrum, multiplied by the sensitivity of the brightness system to sine-wave at those frequencies as read from the curve for 7.1 trolands in Fig. 5; they constitute the output spectra [38]. From Visual Perception, 1st edition by Cornsweet ©1970. Reprinted with permission of Thomson Learning: http://www.thomsonrights.com. Fax: 800 730-2215.
The square-wave synthesized by the full series has an amplitude 0.785 (i.e. ) times that of the fundamental sine wave and thus the amplitude of the fundamental is 1.273 times that of the square wave.
As the frequency of the stimulation increases, the frequencies of the harmonics also increases and, the cut-off frequency at 7.1 trolands being about 40 Hz, only at the lowest frequency, 10 Hz, the second harmonic is present in the output spectrum (with a very small amplitude). At frequencies of 20 and 30 Hz, there is only the fundamental, and nothing at 40 Hz.
4.5.3 Harmonic analysis; some basic notions applied to the case of ‘pulse-to-cycle’ fraction
With the sectored rotating disc, it was easy to vary the angular value of the white or the cut-out sector, and a considerable number of studies were devoted to the influence of the rectangular pulse-to-cycle-fraction (PCF) on the CFF. Bartley [39], Landis [40] and others had commented on the chaos resulting from the whole, chaos in the data and in the attempted explanations.
Once more, harmonic analysis was the right way to clarify the situation, as shown by Kelly [41] in a short but pertinent and useful paper.
In this article, Kelly explained how the form of the function relating CFF (i.e. high-frequency flicker threshold) to PCF “can be understood in a very simple manner.” It consists in analysing the rectangular waveforms into their fundamental frequency components.
Fig. 8 shows the essential results of Kelly's analysis. The two curves represent the lower and upper bounds for the first harmonic amplitude as a function of the pulse-to-cycle fraction R.

Upper and lower bounds for the fundamental amplitude as a function of pulse-to-cycle fraction. The upper curve represents Eq. (4); is expressed in multiples of constant average illuminance ; the lower curve represents Eq. (2), is expressed in multiples of constant maximum illuminance [35,41]. With kind permission of Springer Science and Business Media.
The lower curve represents the usual case of a constant maximum illuminance , guaranteed by a small artificial pupil. The equation of is then:
| (1) |
| (2) |
The upper curve represents the case of a time-average illuminance held constant and for that . The equation of becomes:
| (3) |
| (4) |
From these equations we can calculate first the absolute amplitude of the fundamental frequency and then predict the CFF from, for instance, Hecht's curves.
The upper curve could also represent the case of constant and the time-average retinal illuminance held constant thanks to the pupillary reaction. But actually the compensation is not complete and the true curve would fall within the intermediate shaded area. In this area are also the numerous curves in the literature which are neither perfectly symmetrical nor exactly in accordance with the upper curve, the conditions (with an artificial pupil) or not having been strictly respected.
4.6 Going back to the past
It is interesting, in the light of these rudiments on the PCF–CFF relation, to examine how this relation was treated during what van de Grind et al. [6] humorously called the pre-sine wave age, an age of the complete extinction of which one may very well question.
4.6.1 Plateau's good observation and Helmholtz' error
Plateau [15] rotated the discs A and B reproduced on Fig. 9 and he is probably the first to observe that – in terms of today – complementary PCFs have the same CFF. For him, this result confirms that a weak impression (the one produced by the narrow white sectors) decreases more slowly than a strong one. The constant illumination of both discs is the same and the case is the one of Eq. (2) and lower curve Fig. 8: in A and 0.85 in B on the approximate drawing and for A and B.

A, B, original drawings of Plateau's complementary discs. PCF is about 0.15 on A and 0.85 on B. The third disc is Helmholtz' one, on which PCF values are 0.25, 0.50 and 0.75 [5,15].
Because of a certain ambiguity in Plateau's text, Helmholtz [5] misinterpreted it: “Plateau noticed, by the way, that when the ratio between the width of the white and black sectors is changed without altering the number of sectors, the period of revolution needed to get a uniform impression is the same.” And he thought he had demonstrated it with the third disc on Fig. 9. “With increasing the speed of revolution, the flicker ceases all over almost at the same time.”
Actually, on the three concentric rings on his disc the white sectors respectively took, from the centre to the edge, 1/4, 1/2 and 3/4 of the period. We are also in the case of Eq. (2), constant maximum illuminance and for , 0.50 and 0.75, the corresponding ratios are 0.450, 0.637, and 0.450. Between the middle ring and the two others, the difference is therefore of 0.15 log unit and not more than 1.5 Hz for a probable coefficient of about 10. Considering also the conditions of observation, it was certainly difficult to perceive some difference in the CFFs. Thus Helmholtz was right in saying he did not really see any difference, but he was wrong when he asserted that the difference did not exist. [In the edition of Physiological Optics by the Optical Society of America [5], p. 214 a cross-reference to Fig. 42 (the disc with the three values of R) instead of Fig. 40 (a disc with one period of 360°, two of 180° and four of 90°) makes the text completely incoherent].
4.6.2 Porter's formula and Piéron's opposition
Porter [22] noticed in 1898 and exposed in details in 1902 that, in his experiments – with our symbols – when and when and therefore, for constant illumination, CFF “is likely to be a function of the product” and he showed that his experimental curves of CFF in function of R were symmetrical, with a maximum for .
Ives [42] in 1922, although he was the initiator of the use of harmonic analysis to deal with the problem, accepted Porter's empirical expression and admitted that “is practically equivalent” to . Nevertheless, the first formula is the result of an abstract mathematical game, whereas the second concerns the concrete amplitude of a sine wave as we have seen with Kelly.
About this symmetrical lower curve of Fig. 8, but referring to Porter, Piéron [43], in 1928 made the curious claim that he was still sustaining in the 1961 [24], that it is “a fundamental error” to admit the equivalence between the rapid succession of black and white areas (alternation) and the periodic interruption of the vision of a luminous area (intermittence). With the black and white disc, “there is an alternation of perceptual qualities [...], this is not at all identical to the flickering light perceptions.” For him, the symmetric curve is only valid when a black and white disc is used.
Periods of uncertainty are not lacking in hazardous assertions: Porter, in his first paper, in 1898, on observing that the curves that he was obtaining were not perfectly symmetrical, wrote: “The writer believes that this is due to the fact that the black sector is not completely black.”
4.6.3 Bartley's “decisive theoretical test”
We shall end with the case which gave to Kelly [41] the opportunity to explain his statement on the relation between PCF and CFF. It concerned a paper in which Howard Bartley with Thomas Nelson [44], in 1961, presented experiment with constant at four levels, but without an artificial pupil. The curves of CFF in function of PCF were quasi-symmetric at low level and more and more asymmetric as the level of increased. The authors explained the diversity of the curves by Bartley's theory, which brings into play the responses of the retinal ‘off’ ganglion cells; an electronic model confirmed this hypothesis. They concluded: “As a total, the present findings and the interpretations made solve many puzzles inherent in the diverse results reported during the past several decades.”
Actually, Kelly showed that is it possible to reproduce the Bartley–Nelson curves by including the effect of pupillary adaptation in the calculation of the retinal illuminance amplitude of the fundamental harmonic. This effect attempts to keep constant the retinal illuminance when the stimulus luminance increases, but the compensation is not complete and the shape of the resulting curves, falling in the shaded area of Fig. 8, are intermediate between those of the extreme limits of this shaded area. And Kelly commented: “These results appear to indicate that the main features of PCF data, which Bartley and Nelson regarded as a ‘decisive theoretical test’ of a rather involved neurophysiological hypothesis, are primarily artifacts of the stimulus waveform chosen for the experiments.”
5 Conclusion
Herbert Ives' lack of success in 1922, when he proposed to use harmonic analysis in flicker studies, and the fact that Hendrik de Lange's work in the 1950s was ignored outside of the circle of specialists, are not explained simply by the apparent obstacle of mathematical formalization. In some works of the pre-sine wave age the problem is to explain the ‘filling in’ of the dark phase. Also, Henri Piéron, who was a representative spokesman of this age, intended to go “from the notion of persistence to that of homogeneity” [24].
It is interesting to compare the definition of CFF given by Bartley [39] and by Abramov and Gordon [29]: in 1951 according to Bartley: “The critical flicker frequency is the flicker rate in flashes per second at which the field just becomes steady” and in 1970 for Abramov and Gordon, CFF is the “maximum frequency at which flicker can be detected”. This last definition is extracted from a chapter entitled Temporal modulation transfer function and obviously such a concept cannot help to solve the problem of filling in the dark phase.
The same phenomenal situation is observed in the two following examples one concerning the tactile vibratory sensitivity, the other the visual spatial resolution.
We appreciate the roughness of a surface thanks to the Pacinian corpuscles, sensitive to the vibration provoked by sliding the fingertips on this surface. The craftsman considers that a board is perfectly smooth and needs no more sanding down when, moving his fingertips on its surface he no longer feels any roughness.
It is the same in the case of printed pictures: when upon looking at a coloured screened plate without a strong magnifying glass, we do not see the thousands of points present on the blue sky or on the yellow wall. This spatial discontinuity is invisible to the naked eye and we perceive these areas as uniform.
What can appear to be stating the obvious is, in fact, the expression of a fundamental principle: namely that smoothness or uniformity is a property inferred from the absence of perceptible discontinuity. In the same way, the perceived steadiness of a light flickering at 100 Hz is not, strictly speaking, the effect of a fusion but the absence of perception of the oscillations of brightness. As remarked by de Lange [45]: “[...] observation of the point where flicker disappears is an attempt to discriminate the transition of something into nothing.”
If, when watching a movie, we do not perceive the 48 or 72 intermittencies, it is not because of a providential ‘retinal memory’ filling in the gaps but, more simply, because the time constants of our brightness system do not allow it to ‘follow’ such frequencies.
As de Lange had expected, thanks to the use of harmonic analysis, a more thorough study of flicker phenomenon had been possible and problems were solved which could not be treated by the traditional methods. But, curiously, interest in temporal modulated phenomena seemed, in the late 1970s to turn towards spatial modulation. It would nevertheless be regrettable that the passage into the ‘sine wave age’ should not find the place that it deserves in the history of flicker studies.
Acknowledgements
I am most grateful to Claudine Briane, Kathleen Chanliau, and Marie-Laure Valleron for their participation in the achievement of this paper.
1 The reader interested in É.-J. Marey's studies will find more details in a 2006 issue of C. R. Palevol, devoted to the French physiologist's death centennial [46].