

1 Introduction
Non-invasive preclinical imaging opens new possibilities for long-term follow-up in mice models of cardiovascular diseases. The transfer to small animal of human medical imaging techniques as ultrasound, magnetic resonance imaging (MRI), X-ray-computed tomography (micro-CT), positron emission tomography (micro-PET), planar scintigraphy and single-photon emission computed tomography (micro-SPECT) offers new possibilities for in vivo mouse quantification of ventricular function and cardiac metabolisms [1–4]. Transthoracic echography using a high-frequency probe allows us to obtain at a low cost images of selected 2D slices of the left ventricle (LV) in real time with high spatial and good temporal resolutions with pixel size of and slice thickness of 1 mm at 15 MHz, while acquiring 9–20 images per cardiac cycle, depending on the acquisition conditions [5]. Nevertheless, this method is not accurate for volume measurements due to the necessity of a geometrical modelling of the ventricle, and some authors proposed the development of 3D echography obtained by 2D image acquisition conjugated with mechanical translation of the mouse holder or transducer [6,7]. High-field 2D cine MRI allows for high spatial resolution measurements of murine left cardiac function with temporal resolution of 12–25 phases per cardiac cycle and in-plane voxel sizes of 0.1–0.3 mm with slice thicknesses ranging between 1 and 2 mm [8–10]. 3D isotropic cine MRI at 7 T was successfully investigated recently (voxel size of and 12 time bins per cardiac cycle) at the expense of a long acquisition time [11]. However, high costs and necessity of a skilled staff limits the widespread use of high-field MRI. An experimental ECG gated micro CT device, where the mouse was placed vertical in a rotating holder, has also recently shown superior isotropic spatial resolution for murine LV function (voxel size of and eight phases per cardiac cycle) after administration of a long-lasting blood-pool contrast agent [12,13]. In comparison with the previous techniques, nuclear imaging has been also applied in mice offering isotropic millimetre and submillimetre image resolution available with devices using different pinhole configurations [14–16]. First-pass planar radionuclide ventriculography has been used in early studies for monitoring LV ejection fraction in mice using a short-half-life isotope (178Ta) and a single pinhole multi-wire gamma camera [17]. After feasibility studies of perfusion gated SPECT in mice [18], it has also been shown by our group that global and regional LV function and wall perfusion can be measured via cardiac quantification and interpretation packages that are clinically used for humans with a voxel size of and 8–12 time bins per cardiac cycle [19]. Furthermore, blood-pool gated SPECT demonstrated recently that murine LV volumes assessment is feasible with high voxel and temporal resolutions (voxel size and 8–16 time bins per cardiac cycle) [20].
But contrary to the multiple imaging methods available for analysis of the left ventricle, the assessment of right ventricular (RV) volumes in living mice is a more challenging task, which may be due to the unique aspect of the mouse heart's anatomy, with the particular size and morphology of atrium chambers, RV and great vessels preventing an easy ventricle separation [21]. As a consequence, very few preclinical imaging methods were explored for accurate measurements of right ventricular volumes. It should be noticed that right ventricle imaging is limited with 2D transthoracic echography as well as with transoesophagal echography with the manual pull-back of the ultrasound probe [22]. However and as for LV, the RV can be accurately explored for anatomy and function using high-field MRI, but with the same limitations as those previously mentioned [23]. Addressing the RV structure and function is important because it could broaden the field of the investigation of mice models of increased right ventricular pressures and pulmonary hypertension.
Finally, establishment of quantitative functional normal data should be a prerequisite before applying pinhole gated SPECT imaging in murine models of cardiac diseases. Therefore, we investigated in this paper the ability of pinhole blood-pool ECG gated SPECT for the establishment of right and left ventricular volumes and function in living healthy mice.
2 Material and methods
2.1 Mice preparation, anaesthesia and tracer administration
Eleven normal adult mice (CD1, four females and seven males, Mouse Clinical Institute, Illkirch, France) weighing 21–47 g, were analyzed according to the French regulations concerning experimentation on small animals (authorization No. A 67-482-20). For 2D transthoracic echography and blood-pool gated SPECT, mice were anaesthetized with a gas mixture (air and 1–1.5% isoflurane). For blood-pool gated SPECT, mice preparation, conditions and routes of tracer administration were always conducted in the same manner. One extremity of the mice holder for SPECT was attached to a respiratory tube connected with a small animal anaesthesia device able to deliver the heated gas mixture (air and 1–1.5% isoflurane) as illustrated in Fig. 1 and able to maintain the temperature of the animal at 36 ± 1 °C. The caudal vein was catheterized for intravenous delivery of 550 MBq of 99mTc human albumin (Vasculocis® Cis-Bio International, Paris, France). Care was taken to keep the volume of injected tracer under 0.2 ml to avoid significant changes in whole blood volume of mice.
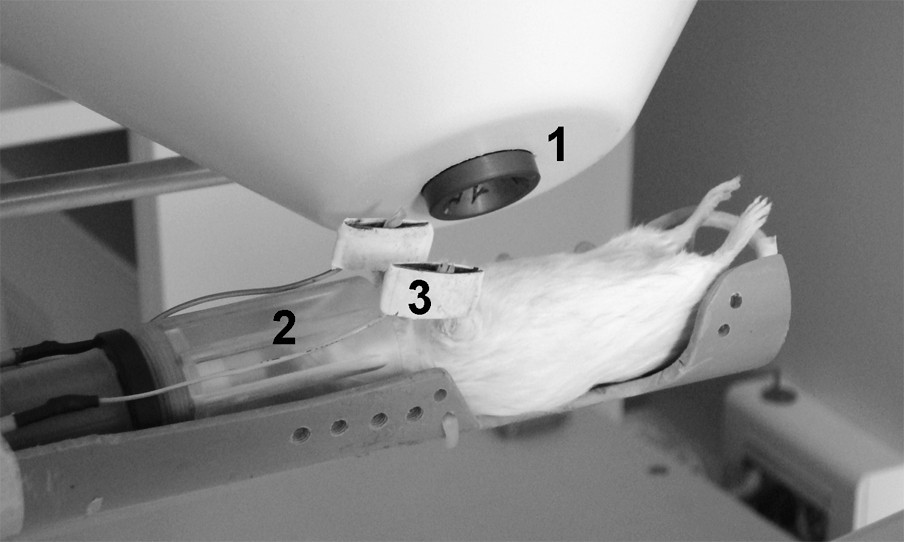
Close-up view of the single-pinhole SPECT camera (1), the anaesthesia mask delivering heated gas mixture (2), and the paddle ECG electrodes (3).
2.2 Blood-pool data acquisition with ECG gating
A small-animal one-head dedicated gamma camera (Gaede Medizinsysteme GMBH, Freiburg Germany) with a 6.5-mm-thick NaI(Tl) crystal equipped with 25 photomultipliers and a small field of view of 17 cm × 17 cm was employed in this study. The camera was equipped with a pinhole collimator of 12 cm in focal length and a tungsten insert of 1.5 mm in diameter (Fig. 1). The computer-driven circular rotation of the camera permitted to test the accuracy of the centre of rotation, and pre-processing correction was applied on the projection images before tomographic reconstruction using the line source method described in [24]. Cardiac acquisitions were started 30 min after injection of the radiopharmaceutical. The camera radius of rotation was adjusted as close as possible within the mouse thorax (2.5 cm in our case) to improve projection images magnification, corresponding in that case to a zoom factor of approximately 5. A 20% window centred on the 140-keV photoelectric peak of the 99mTc was used. Mouse leading supine, a circular ventral 48-projection step and shoot acquisition over 180 ° with word images from the left lateral to the right lateral side of the thorax was always used. For ECG gating, we used two paddle electrodes connected to an electrocardiograph (Physiogard RSM 784 ODAM, Wissembourg, France) and 350 cardiac beats were registered for each projection in a forward-backward mode with a 20% temporal window of the mean RR time and eight time bins per cardiac cycle. At the end of the exam, data were transferred to a computer (G4, Apple, Cupertino USA) for image reconstruction.
2.3 Blood-pool gated SPECT images reconstruction
The EAR method (Efficient Algebraic Reconstruction) used for images reconstruction was developed in our laboratory and is described in details elsewhere [25]. The number of voxels and the dimensions of the field of view permit to predetermine the isotropic tomographic reconstructed voxel size, set in our case at . The physical parameters, as attenuation and diffusion, were not taken into account in this study, but could be introduced in the algorithm. Before reconstruction, image projections were corrected for radioactive decay of 99mTc due to long time acquisition. Previous studies of our group have shown that using the EAR algorithm and the pinhole gamma camera described before, a SPECT spatial resolution of 1 mm and a volume calibration linear relationship in the range 10–100 μl can be achieved with a 1.5-mm pinhole [19,25].
2.4 4D harmonic analysis of blood-pool gated SPECT images, ventricles segmentation and volumes calculation
A 4D amplitude and phase analysis was applied to blood-pool gated SPECT images in order to separate the kinetic behaviour of atrium and ventricles chambers during the cardiac cycle. Matrix manipulation, measurements, thresholding and automatic contouring procedures were written using ImageJ software (W.S. Rasband, ImageJ, U.S. National Institutes of Health, Bethesda, MD, USA, http://rsb.info.nih.gov/ij/, 1997–2007) following four steps illustrated in Fig. 2.

Pinhole ECG gated blood-pool end-diastolic and end-systolic mid-left-ventricular slices (upper left part) and corresponding amplitude and phase images (upper right part). A – The phase histogram is calculated from masked phase volume. Auricular (1) and ventricular peaks (2) are clearly visible. The user-defined phase ventricular window is shown above the second peak (arrows). The corresponding ventricular mask outlines are drawn (lower part). B – Inter-ventricular separation is based on septum area detection. The transverse region of interest (box) profile line shows the right ventricle (1), the left ventricle (2) and the septum area (3), automatically detected as the valley between the peaks. C – Left and right masks are calculated from previous steps and applied to all volume bins before automatic isolevel contouring.
2.4.1 Step 1: volume reorientation and filtering
Reconstructed volumes were manually reoriented according to the left ventricle axis. Three successive rotations were applied along three orthogonal axes and the same geometric transformations were applied to all volume bins. Spatial filtering was performed using a matrix filter. Temporal filtering was then applied to all bins using a matrix.
2.4.2 Step 2: atrio-ventricular separation
The left ventricle centre was defined manually. A mark was placed into the left ventricle chamber using the end-diastolic dataset. This mark was kept constant for all bins and amplitude and phase volumes were calculated from Fourier first harmonic. The phase histogram shown in Fig. 2A was obtained from whole 3D phase volume. The mean ventricular phase was measured for all animals using a voxels region of interest including the manually defined LV centre. Then, voxels included into the volume mask were defined by a measured phase belonging to the ±25° phase window around the mean ventricular phase (Fig. 2A) and an amplitude threshold defined as maximum amplitude × 20%. This phase selection only retained voxels with a close temporal behaviour corresponding to ventricular areas, whereas amplitude thresholding avoided the influence of background noise for further contouring steps. Selection mask was then applied on all bins and the mean phase ±25° window was kept constant for left and right ventricles.
2.4.3 Step 3: inter-ventricular separation
End-diastolic masked HLA volume slices were summed along the z axis. The corresponding 2D matrix was used for inter-ventricular boundary definition. Profile lines were calculated for each line and the septum area was defined as the local minimum between both ventricular peaks (Fig. 2B) following Vanhove et al. [26]. Finally, masked datasets were split into left and right ventricles datasets for each bin (Fig. 2C).
2.4.4 Step 4: definition of left and right boundaries and volumes measurements
A unique threshold level was defined for both ventricles. Isolevel automatic contouring was applied on both left and right datasets for all bins. The threshold level was kept constant through all bins and was chosen as 50% of both ventricles' maximum intensity pixel. Right and left volumes were measured for all 3D volume bins as the sum of the voxels within the contouring lines.
2.5 Statistical analysis
A paired Student's t-test was used for direct comparison of LV an RV volume measurements. Linear regression analysis was used to test for correlation of LV and RV stroke volume measurements. Bland–Altman analysis was carried out by comparing differences in assessed RV and LV volumes with the mean of RV and LV volume comparisons. All results are given as means ± SD. Values of were considered significant.
3 Results
The heart rate was for blood-pool gated SPECT experiments and all mice survived the experiments and recovered quickly after the end of anaesthesia. For blood-pool gated SPECT, eight time bins per cardiac cycle were acquired and average study duration, including the experimental set-up and mouse preparation, was less than one hour. Fig. 2 illustrate typical mid ventricular blood-pool slices at end diastole and end systole with corresponding 4D amplitude and phase images allowing for atrium and ventricle chambers separation and segmentation, as demonstrated. Table 1 reveals individual results of LV gated blood-pool parameters. Table 2 illustrates the individual results of gated blood-pool for RV volumes, ejection fraction and cardiac output and, as expected under physiological conditions, left and right cardiac outputs showed nearly identical values: versus , respectively. Both tables also show the average value of the standard deviations of intra- and inter-observer volume measurements varying from 0.3 to 2.6 ml. Fig. 3 illustrates the average right and left ventricles' volume curves determined by blood-pool gated SPECT. Corresponding average ejection fractions were and , respectively. Consistently with physiology, right end diastolic and end systolic volumes were significantly higher compared with the corresponding left ventricular volumes ( each). We found a good linear correlation between the right and left stroke volumes (, ) and Bland–Altman analysis for assessment of the agreement between RV and LV stroke volumes for each mouse studied revealed a mean difference of 0.06 μl between RV and LV stroke volumes with close limits of agreement (±3 μl) representing ±2 SD, as illustrated respectively in Figs. 4 and 5. There were no differences between male and female mice for both right and left gated blood-pool SPECT values of ventricular volumes, ejection fraction and cardiac output.
Left ventricle pinhole gated blood-pool SPECT measurements. In parenthesis are listed the average of intra and inter observer standard deviations. M: male, F: female, HR: heart rate, EDV: end diastolic volume, ESV: end systolic volume, SV: stroke volume, EF: ejection fraction, CO: cardiac output
| Mean HR (bpm) | Left ventricle | |||||
| EDV (μl) | ESV (μl) | SV (μl) | EF (%) | CO (ml/min) | ||
| M1 | 420 | 59.2 (0.5) | 19.6 (0.4) | 39.5 | 66.8 | 16.6 |
| M2 | 495 | 55.8 (0.2) | 19.3 (0.7) | 36.6 | 65.5 | 18.1 |
| M3 | 480 | 56.2 (0.3) | 24.9 (0.3) | 31.3 | 55.7 | 15.0 |
| M4 | 335 | 61.1 (1.1) | 21.5 (0.5) | 39.6 | 64.8 | 13.3 |
| M5 | 345 | 58.4 (0.5) | 19.4 (0.6) | 38.9 | 66.7 | 13.4 |
| M6 | 315 | 56.9 (0.4) | 13.0 (0.4) | 43.9 | 77.1 | 13.8 |
| M7 | 330 | 53.1 (0.5) | 20.5 (0.4) | 32.6 | 61.4 | 10.8 |
| F1 | 380 | 53.4 (1.3) | 17.9 (0.9) | 35.5 | 66.5 | 13.5 |
| F2 | 420 | 51.0 (1.0) | 17.7 (0.6) | 33.3 | 65.3 | 14.0 |
| F3 | 450 | 53.3 (2.1) | 20.6 (0.4) | 32.6 | 61.3 | 14.7 |
| F4 | 366 | 53.3 (1.2) | 19.4 (1.3) | 33.9 | 63.6 | 12.4 |
| Mean value | 394 | 55.6 | 19.4 | 36.2 | 65.0 | 14.1 |
| Standard deviation | 63 | 3.1 | 2.9 | 3.9 | 5.2 | 2.0 |
Right ventricle pinhole gated blood-pool SPECT measurements. In parenthesis are listed the average of intra and inter observer standard deviations. M: male, F: female, HR: heart rate, EDV: end diastolic volume, ESV: end systolic volume, SV: stroke volume, EF: ejection fraction, CO: cardiac output
| Mean HR (bpm) | Right ventricle | |||||
| EDV (μl) | ESV (μl) | SV (μl) | EF (%) | CO (ml/min) | ||
| M1 | 420 | 70.3 (1.2) | 31.8 (2.0) | 38.5 | 54.7 | 16.2 |
| M2 | 495 | 68.4 (0.6) | 32.1 (0.7) | 36.3 | 53.0 | 18.0 |
| M3 | 480 | 71.1 (0.9) | 40.0 (0.9) | 31.0 | 43.7 | 14.9 |
| M4 | 335 | 74.7 (0.6) | 37.3 (0.6) | 37.4 | 50.0 | 12.5 |
| M5 | 345 | 72.5 (0.5) | 33.2 (0.6) | 39.3 | 54.2 | 13.6 |
| M6 | 315 | 70.3 (0.7) | 27.2 (0.8) | 43.1 | 61.3 | 13.6 |
| M7 | 330 | 67.6 (0.5) | 33.7 (0.3) | 33.9 | 50.1 | 11.2 |
| F1 | 380 | 67.8 (0.3) | 29.6 (0.4) | 38.2 | 56.4 | 14.5 |
| F2 | 420 | 65.5 (1.1) | 33.5 (0.9) | 32.0 | 48.8 | 13.4 |
| F3 | 450 | 68.4 (0.5) | 33.5 (0.9) | 34.9 | 51.0 | 15.7 |
| F4 | 366 | 69.2 (2.6) | 35.3 (0.9) | 33.9 | 49.0 | 12.4 |
| Mean value | 394 | 69.6 | 33.4 | 36.2 | 52.0 | 14.2 |
| Standard deviation | 63 | 2.6 | 3.5 | 3.5 | 4.7 | 1.9 |
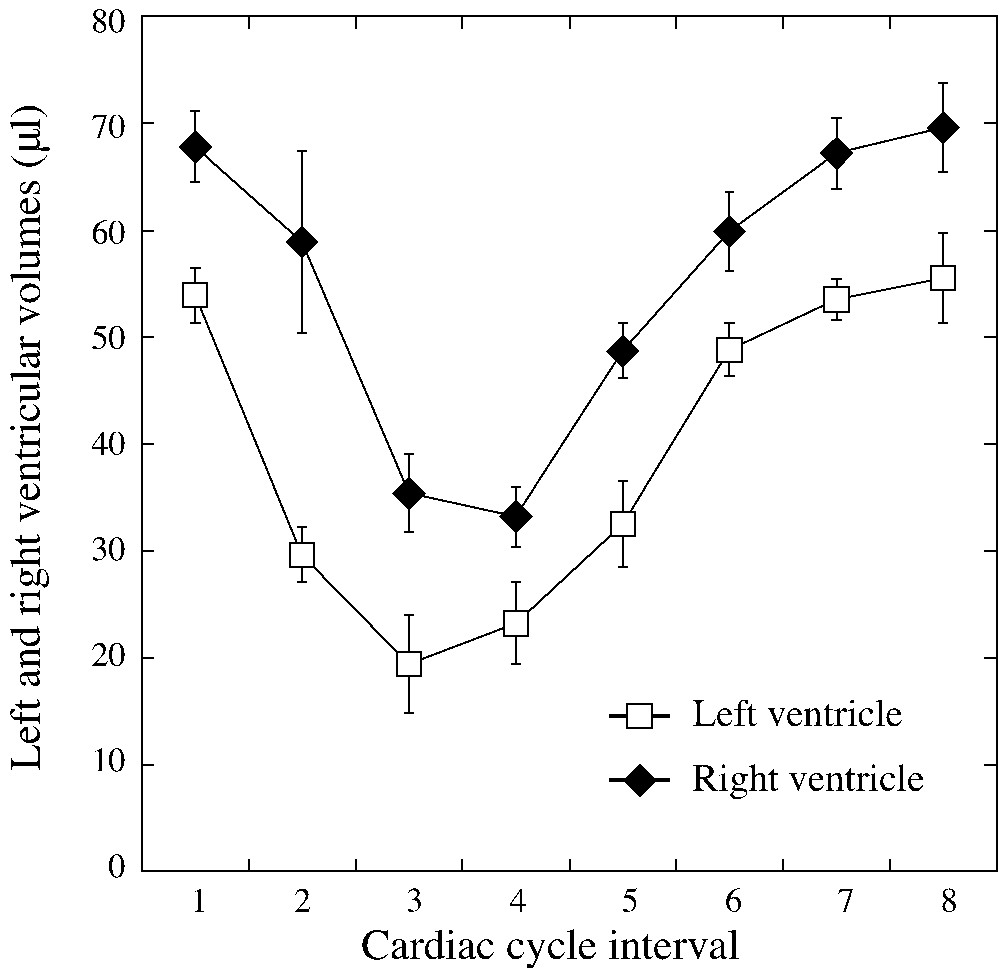
Average right and left ventricular volume curves of the n=11 mice studied.
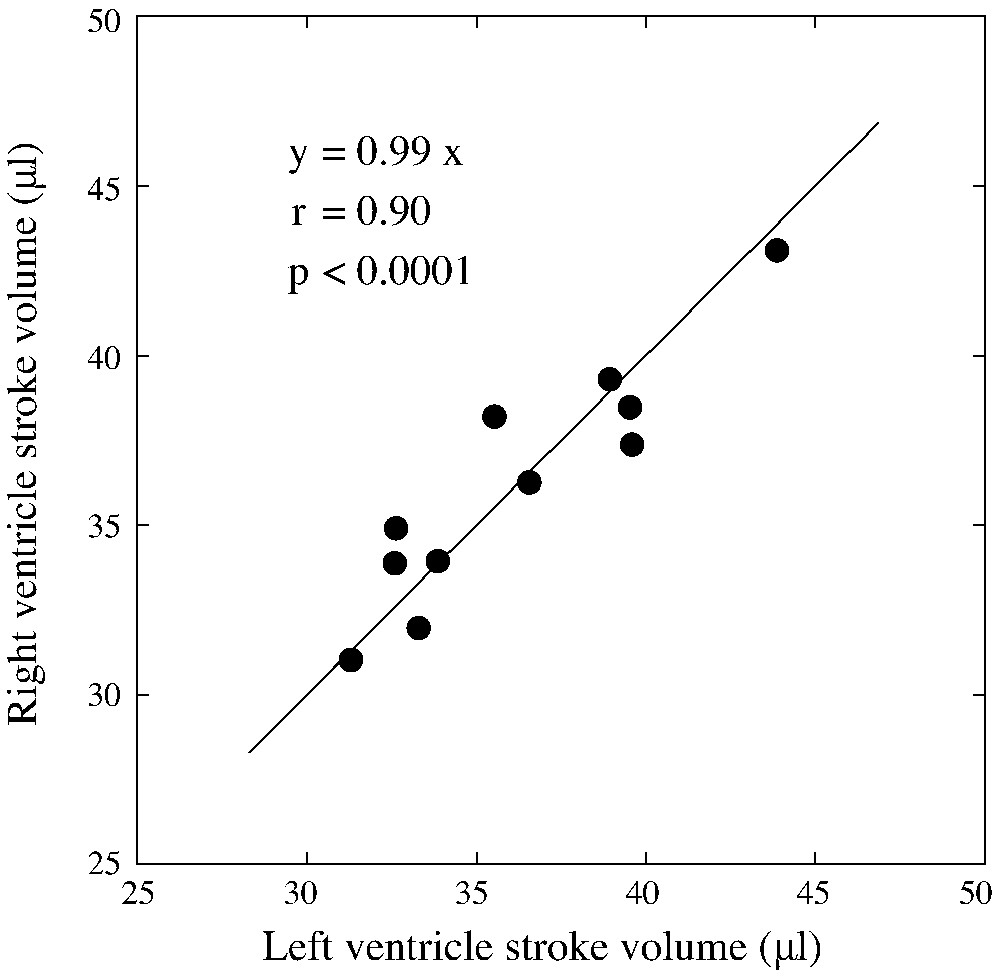
Regression analysis of the comparison between right and left stroke volumes as assessed by blood-pool pinhole gated SPECT.
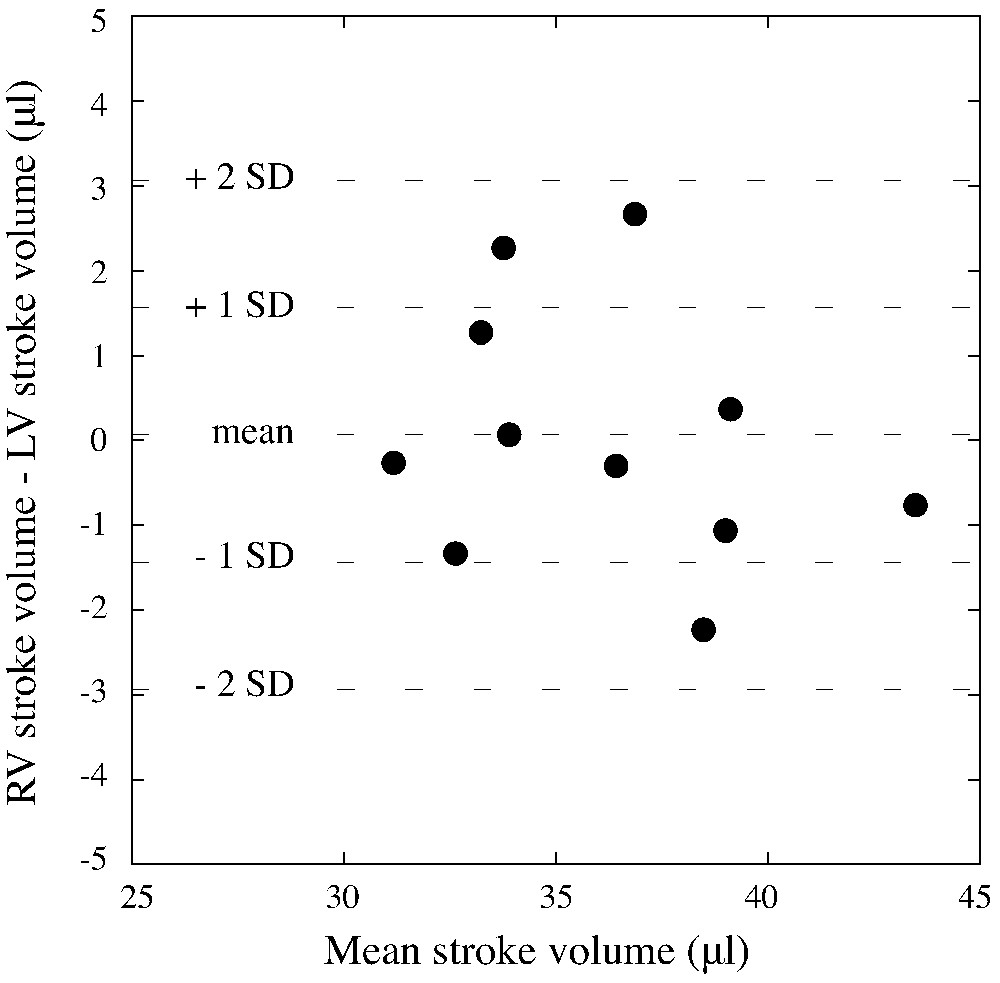
Bland–Altman analysis assessment of the agreement between RV and LV stroke volumes represented as the difference between right and left stroke volumes for each mouse studied (y-axis) versus the mean of the right and left stroke volumes for each mouse (x-axis).
4 Discussion
4.1 Spatial and temporal resolutions of blood-pool gated SPECT images
In our experiments, an isotropic spatial resolution of 1 mm was obtained by pinhole SPECT with a 1.5-mm pinhole and a reconstructed voxel size of , which has to be compared to the 0.75-mm spatial resolution with pinholes of 1 mm and a triple head camera with a reconstructed voxel size of obtained by Chin et al. [20]. However, isotropic spatial resolution of 0.5 mm can be actually achieved with different commercial small-animal-dedicated SPECT devices, leading in the future to a better delineation of the ventricles [27]. Regarding the time resolution that can be obtained in gated studies, we were able to measure eight time bins per cardiac cycle for a total acquisition time of 48 min with a simple pinhole gamma camera. As the sensitivity of the recently proposed multi-detector and/or multi-pinhole SPECT cameras is greatly improved compared to our single pinhole device, 16 phases per cardiac cycle are expected with reasonable acquisition times [3,14,16,20]. However, it is also important to remind for comparison that planar radionuclide ventriculography was able to provide ejection fraction curves with a high time resolution (up to 160 frames/s), as it was shown by Hartley et al. [17] in first pass studies using the short half live 178Ta and a specialized multiwire gamma camera.
4.2 Blood-pool gated SPECT ventricular analysis compared to other imaging methods
Adult healthy mice values of both left and right ventricular volumes, ejection fraction and cardiac output measured in vivo by different imaging methods spread out over a wide range according to the literature. This dispersion depends on the imaging techniques involved (2D/3D echography, MRI, CT, SPECT), but manual or automatic images analysis employed for contouring endocardial borders and ventricles' volume modelling using ventricular diameters or cross-sectional measurements are also concerned. Mice strains and reduced heart rates due to adverse impact of anaesthesia could also influence these values [28]. This is illustrated in Table 3, where for left ventricle volumes it can be observed in the literature that average heart rates are in the range 331 to 600 bpm, while average EDV and ESV vary from 18 to 68 μl and 4 to 24 μl, respectively. This dispersion is even more pronounced for the right ventricle with average EDV varying from 34 to 84 μl and ESV from 18 to 36 μl, as there is less corresponding imaging data available.
Literature-based mean values and standard deviations of ‘normal’ left and right volumes and function in adult anaesthetized mice. EDV: end diastolic volume, ESV: end systolic volume, SV: stroke volume, EF: ejection fraction, CO: cardiac output, NA: not available. References are in parenthesis. Imaging techniques are indicated as follows: MRI (magnetic field in Tesla), CT: computed tomography, 2D or 3D echography, Gated-SPECT, TEE: transoesophagal echography. Mice strain and type of anaesthesia are indicated
| Left ventricle | ||||||
| (Reference) | Heart rate (bpm) | EDV | ESV | SV | EF | CO (ml/min) |
| Technique | Anaesthesia | (μl) | (μl) | (μl) | (%) | |
| Mice strain | ||||||
| (9) | 360±19 | 68±3.5 | 23.5±4.4 | 40.2±2.7 | 64.6±3.5 | 14.3±0.5 |
| MRI (7T) | Isoflurane | |||||
| C57BL6 | ||||||
| (12) | 507±20.9 | 49±17 | 24±3.8 | 25±6.3 | 50.9±2.8 | 12.62±2 |
| CT | Isoflurane | |||||
| C57BL6 | ||||||
| (8) | 417±16 | 52.7±5.7 | 21.8±5.8 | NA | 69±2 | 13.5±1 |
| MRI (7T) | Isoflurane | |||||
| C57Bl6 | ||||||
| (33) | 417±16 | 49.8±5.2 | 16.3±2.6 | 33.2±2.9 | 69±2 | 13.5±1 |
| MRI (7T) | Isoflurane | |||||
| C57Bl6 | ||||||
| (32) | 366±39 | 45.2±9.3 | 14.6±5.5 | 30.5±4.6 | 68.6±6.6 | 11.2±2.4 |
| MRI (7T) | Isoflurane | |||||
| C57Bl6 | ||||||
| (19) | 331±35 | 50±8 | 20±6 | 29.5±6 | 60±9 | 9.6±1.6 |
| G-SPECT | Isoflurane | |||||
| CD1 | ||||||
| (11) | NA | 44±3 | 13±2 | 31±3 | 71±5 | NA |
| MRI (7T) | Isoflurane | |||||
| Black Swiss | ||||||
| (28) | 519±47 | 45±13 | 14±7 | 31±7 | 71±7 | 16±4 |
| MRI (4.7 T) | Isoflurane | |||||
| C57Bl6 | ||||||
| (6) | 500±25 | 28±3 | 9±2 | NA | 63±5 | NA |
| Echo 3D | Isoflurane | |||||
| C57Bl6 | ||||||
| (30) | 600±50 | NA | NA | 31±7 | NA | 20±4 |
| Echo 2D | Conscious | |||||
| Swiss | ||||||
| (31) | 426±52 | 18.2±7.5 | 4.1±5.6 | 14.1±4.9 | NA | NA |
| Echo 2D | Urethane | |||||
| CD1 | ||||||
| Right ventricle | ||||||
| (23) | 461±14 | 84.1±4.1 | 36.4±2.8 | 47.7±2.5 | 57±2.2 | 21.9±1.5 |
| MRI (7T) | Isoflurane | |||||
| C57BL6 | ||||||
| (11) | NA | 43±2 | 15±5 | 28±4 | 65±11 | NA |
| MRI (7T) | Isoflurane | |||||
| Black Swiss | ||||||
| (22) | 523±74 | 34±11 | 18±6 | 16±5 | 47±6 | 7.9±2.7 |
| TEE | Ketamine | |||||
| NA | Xylazine |
4.3 Left ventricle
The mean values and standard deviation of left ventricular EDV, ESV, EF and cardiac output that we obtained are in close agreement with those published by Chin et al. [20], confirming the robustness of the blood-pool gated pinhole SPECT method.
Echocardiography based on high-frequency transducers is widely used and is able to measure internal left ventricular diameters in systole and diastole in 2D selected short- and long-axis views as in apical 4-chamber view. After manual tracing of LV diameters and cross-sectional surfaces, functional parameters could be derived using different formulas (shortening fraction on the one hand and Teicholz, prolate ellipsoid or Simpson's rule for volumes estimation on the other one) [5]. Tissue and colour Doppler are also added values for diastolic and flow parameters. The advantage of echocardiography is an excellent time resolution [7,29]. 3D echography by controlled translation of 2D probes, or in the future real time 3D echography, should be able to overcome the current limits of 2D echocardiography, entailing assumptions of left ventricular shape for direct volumes measurements but at the expense of a relative loss of resolution in two directions [6]. However and not surprisingly, echography, based on two different formulas and methods (Teicholz and Doppler), frequently overestimates the left cardiac output and shows also important differences on a mouse-per-mouse basis, illustrating the inaccuracy of 2D transthoracic echography for volumes assessment [30,31]. In comparison, blood-pool gated SPECT has an intrinsic isotropic spatial resolution enabling left volumes' measurement without any ventricular shape assumption. Cardiac cine magnetic resonance imaging (bright or black blood MRI) for assessment of left ventricular volumes and function in mouse are currently based on 2D multi-slice techniques with 12–16 bins per cardiac cycle and acquisition times ranging from 15 to 60 minutes for in-plane resolutions of 0.1–0.3 mm and slice thicknesses of 1–2 mm depending on the imaging protocols used [8,9]. The left ventricular volumes measurements are then obtained after manual delineation of endocardial borders of consecutive 2D slices encompassing the heart [32,33]. 2D multi-slice MRI techniques are limited by the necessary trade-off between high temporal resolution and high in-plane spatial resolution, leading in some experiments to the acquisition of only one mid ventricular slice with a thickness of 1 mm, but 30 images per cardiac cycle and pixel size [10,34]. The values of the left ventricular function we obtained in normal mice by blood-pool gated SPECT are in the range of MRI results obtained by different groups [8,9,30,33]. Cine MRI was recently improved by 3D isotropic gradient echo sequences yielding at 7 T a voxel resolution of and 12 time bins per cardiac cycle at the expense of a very long acquisition time (around 3 h), but leading in the future to more accurate left ventricle volumes' measurements [11]. However, an important hurdle to widespread implementation of MRI for small animal cardiac studies compared to echography and pinhole camera used in this study is the cost and availability of clinical or small-animal-dedicated high-field MR imagers [35]. Using a custom-built set-up, with the mouse placed vertical in a rotating holder and a delayed enhancement double-contrast protocol after administration of a long-lasting blood-pool contrast agent, cine micro-CT has recently shown a superior isotropic spatial resolution, with voxels and 15 ms of time resolution resulting in eight phases per cardiac cycle for a total acquisition time of about 8 min [12,13]. As for cine micro CT and isotropic 3D cine MRI, pinhole gated SPECT can provide the four-dimensional data (3D isotropic volumes over time) that are required for cardiac function in mice. Moreover, perfusion and blood-pool tracers with different isotopes (201Tl and 99mTc-blood pool) can be used with pinhole gated SPECT, as in dual-isotope human protocols, to simultaneously analyze wall perfusion and function of the left ventricle in a single exam [36].
4.4 Right ventricle
Addressing the RV structure and function is a difficult task and the invasive assessment of right ventricular volumes using the manual pull back of a transoesophagal ultrasound probe has shown significantly higher intra- and inter-observer variability, limiting therefore its application [22]. As previously described, isotropic 3D cine MRI at 7 T has recently demonstrated his efficacy for accurate measurements of right ventricular volumes despite longer acquisition times compared with 2D cine MRI [11]. To our knowledge, there are no data about RV volumes measurements by blood-pool contrast micro CT. We show for the first time, to our knowledge, that blood-pool pinhole gated SPECT is able to measure RV volumes in mice without any volume shape assumption. Values of RV volumes found are in the range of published data using other small animal imaging methods in healthy mice, but keeping in mind that very few data are available (see Tables 2 and 3). However, and as expected, we found on the one hand that left and right cardiac outputs we measured were not statistically different and on the other hand that right and left stroke volumes were linearly correlated. These results are in agreement with physiology and were also demonstrated using high-resolution MRI at 7 T by Wiesmann et al. [23].
4.5 4D harmonic analysis
For the particular anatomy and size of mice cardiac chambers, the use of a 4D harmonic analysis is a useful preliminary step for automatic atria and ventricles separation before functional ventricular analysis. We chose to apply temporal harmonic analysis on the reconstructed blood-pool voxels instead of temporal Fourier filtering of the gated projections before slice reconstruction because the amount of memory needed is actually not critical [37]. However, a reduction in noise in the images could be expected if temporal Fourier filtering of the projections is applied before reconstruction. 4D harmonic analysis of blood-pool gated images had also the potential of being a useful tool for qualitative analysis of impaired left ventricular wall motion [20].
4.6 Amount of radioactivity used
Contrary to intuition, the amount of radioactivity used in this study was similar to that employed for humans, despite important differences in body mass between mouse and man. This is due to the size of the image voxel, which corresponds to mice scale, as well as to the low sensitivity of the single pinhole employed in this study. However, the amount of radioactivity we used was similar to that of Chin et al. [20]. Recent commercial multi-pinhole SPECT devices are now expected to dramatically lower this amount of radioactivity due to the large number of pinholes employed, while keeping a high spatial resolution, in order to reduce mice organs and whole body absorbed doses, which is an important issue in case of longitudinal examinations [14,15].
4.7 Limitations of this study
The principal limitation of this study was the lack of direct comparison of left and right volumes measured by ECG gated blood-pool SPECT with another method such as high-field MRI. However, for left ventricular volumes and global function in healthy mice, our results are in good agreement with previous data of our group on perfusion gated SPECT and those of Chin et al. [20] with a comparable technique and also with high-field MRI. For right ventricular volumes and function, further investigations are needed to confirm and validate the ECG gated blood-pool pinhole SPECT in mice by direct comparison with MRI or contrast ECG gated micro CT [13]. In this study, we used radiolabelled human albumin as a vascular tracer, instead of in vivo radio labelling of red blood cells, with the benefit of using only a single injection, but the disadvantage of potentially inducing an immune response.
5 Conclusion
We demonstrate that in a reasonable acquisition time compared to other available preclinical imaging methods, we were able to obtain a four-dimensional data set with sufficient spatial and time resolution for accurate measurements of right and left ventricular volumes and corresponding global functions in living mice using ECG-gated blood-pool SPECT with a single-pinhole gamma camera.
Acknowledgements
General Electric Healthcare and Covidien laboratories are gratefully acknowledged for their support.