

1 Introduction
Ascorbate is an abundant metabolite in plants where it plays major roles for various aspects of plant life. Besides its well-studied role in photo protection and stress response, ascorbate is involved in the regulation of several aspects of plant development such as cell division and cell expansion. Intake of Vitamin C (L-ascorbic acid or AsA) is also crucial for humans, who have lost the ability to synthesize this compound. Indeed, like some other primates, humans carry a loss-of-function mutation in one of the obligatory steps of ascorbate biosynthesis. As a consequence, humans have to find vitamin C in their foodstuff, in particular by eating fruits and vegetables. Many fruits (e.g. the citrus and the kiwifruit) are rich in ascorbate. However, in many countries, tomato (Solanum lycopersicum) is the major source of vitamin C because it is consumed regularly and in large quantities. Tomato is also a model for fleshy fruits, allowing the development of methodologies, approaches and knowledge that can later be transferred to other species of edible fruits. To meet the health requirements and the growing demand of consumers for food items with high nutritional value, it is desirable to monitor and, if possible, to increase the tomato fruit content in vitamin C. Tomato fruit ascorbate content depends on a combination of genetic factors (various cultivars display large variability in ascorbate content), environmental factors (cultural practices and environmental conditions will affect ascorbate accumulation in the fruit), and postharvest storage conditions (changes in antioxidant capacity and fruit firmness of the fruit are closely linked in the stored fruit).
The major ascorbate biosynthesis pathway has been recently described [1]. Starting from mannose-1-P, it includes several successive steps catalyzed by GDP-mannose pyrophosphorylase (GMPP), GDP-mannose--epimerase (GME), L-galactose guanyltransferase [2], galactose dehydrogenase and L-galactono-1,4 lactone dehydrogenase (GalLDH). This pathway is directly connected to glycolysis through glucose-6-phosphate and fructose-6-phosphate. It is also connected to cell wall biosynthesis since GDP-mannose and GDP-L-galactose are intermediates of the major ascorbate biosynthesis pathway and precursors for the synthesis of non-cellulosic cell wall polysaccharides such as (galacto)glucomannans. Other alternative minor pathways connected at different levels to the major pathway have been demonstrated [3,4]. In addition, a specific ascorbate biosynthesis pathway using the galacturonic acid resulting from cell wall degradation of ripening fruit as a precursor has been found in strawberry [5]. Since vitamin C is present as three forms showing different oxidative states (ascorbate, monodehydroascorbate, dehydroascorbate) in plant tissues, the activities of the ascorbate recycling enzymes such as ascorbate oxidase (AO) and monodehydroascorbate reductase (MDHAR) also play a major role in determining the level and physiological role of ascorbate.
Despite their importance in plant biology, pathways and networks implicating ascorbate remain poorly known. Interconnections between ascorbate metabolism and major plant metabolic pathways may participate in the modulation of plant growth in response to ascorbate. In addition, the various forms of ascorbate participate in redox signalling in the plant and may therefore regulate a wide range of biological processes. Top–down systems biology approaches have recently emerged as very powerful tools in plant and animal sciences for the discovery of genes or networks regulating metabolic pathways or developmental processes such as those involving ascorbate [6–8]. Recently, we have generated transgenic tomato lines altered in key steps of ascorbate biosynthetic pathway (GME, GalLDH) and recycling (AO, MDHAR) ([9,10] and unpublished results), thus opening the way for the comprehensive study of the regulation of ascorbate biosynthesis and of its crosstalk with other developmental and metabolic pathways in tomato fruit.
In our study, we have: (i) generated phenotypic and genomic data (transcriptome, proteome, metabolome) on fruit from tomato transgenic lines altered in ascorbate biosynthesis and recycling by RNAi strategy targeting the GME, GalLDH, AO and MDHAR enzymes; (ii) developed and implemented statistical and bioinformatic tools necessary to store, analyse and integrate experimental data in a Web application called VTC Tool box; and (iii) used these tools to give insights into the relationships between ascorbate and fruit metabolism. For this, we acquired phenotype, transcriptome (using tomato TOM2 microarrays), proteome (using 2D gels and LC-MS/MS) and metabolome (using proton NMR and LC-DAD) data from wild type and transgenic tomato fruit harvested at two different stages of development displaying different patterns of ascorbate accumulation and redox state: growing fruit at 20 DPA and ripening fruit at Orange stage. Clustering transcriptome and metabolome data through Kohonen's self-organizing maps (SOMs) enabled us to confirm the clear difference between the various transformants with respect to fruit composition and gene expression. By visualization of pair-wise Pearson correlations between e.g. metabolite and transcripts or proteins and by simultaneous viewing of transcript/protein metabolite levels for the major metabolic pathways using the MapMan tool [11,12], this approach further allowed us to uncover major relationships between ascorbate and other metabolic pathways and regulations and to highlight common genes and pathways altered in response to the modification of ascorbate biosynthesis and/or redox state.
2 Materials and methods
2.1 Plant material and growth conditions
Cherry tomato [Solanum lycopersicum cv West Virginia 106 (WVa106)] wild type and transgenic plants were grown in Autumn 2006 in a greenhouse located in Avignon (INRA Montfavet, France). Individual flowers were tagged on the day of anthesis (flower opening). The fruit number per truss was limited to 10. The fruits were further selected according to size and position on the truss (elimination of the first and last fruit of the truss) and harvested at two stages of fruit development: 20 days post-anthesis (20 DPA) and Orange stage, according to fruit color. For each genotype and developmental stage, three pools of 30 fruits were harvested from 10 plants (20 plants for wild type). For each pool, the carpel wall from the fruit (pericarp) was collected, frozen rapidly and ground in liquid nitrogen, and then stored at −80 °C or lyophilized and then stored at −80 °C.
2.2 Effect of light on ascorbate in fruit
The fruit shading treatment was initiated at 7 DPA. The shading treatment consisted in covering the trusses of different plants for 21 days with a perforated silver screen which transmitted only 29% of incident radiation (Lee Filter: n° 271; Andover, Hampshire, UK).
2.3 DNA constructs and tomato genetic transformation
Hairpin RNA constructs designed for silencing GME, GalLDH, AO and MDHAR by RNA interference (RNAi) strategy were obtained as described in [9]. Briefly, 3′ UTR gene-specific DNA fragments or fragments targeting conserved regions in different members of multigene families were PCR-amplified from reverse transcribed tomato RNA using specific primers. Genbank accession numbers were AB080690 (GalLDH), SGN-U314898 (SlGME1) and SGN-U314369 (SlGME2), SGN-U581990 (AO), and SGN-U573751 (MDHAR). The purified DNA fragment was cloned as an inverted repeat under the control of the CaMV35S promoter using the Gateway cloning system described by [13], first into the entry vector (pDONR™ 201), then into the destination vector (pK7GWIWG2(1)). This construct was checked by sequencing and introduced into cherry tomato (WVa106) plants by Agrobacterium tumefaciens strain GV3101. Polyploid plants were excluded from further analyses. Following characterization of first generation plants (>10 T0 plants), one homozygous line was selected for each target gene and used in the present study.
2.4 Experimental design
The transcriptome, proteome and metabolome analyses were carried out on three biological replicates corresponding to the three fruit pooled samples for one target gene (one transgenic line) or wild type (WT) and one stage of fruit development. In addition, transcriptome analyses included two technical replicates with the dyes reversed (dye swap) per biological replicate, i.e. a total of 6 slides for one comparison of transgenic line vs wild type plant. Proteome analyses were performed on the three biological replicates. Proteins from each pool were extracted independently and separated on one 2DE-gel. Three gels per genotype x stage were obtained and compared by image analysis. For all metabolite analyses, two extractions (technical replicates) were also performed to measure the metabolite concentration of each biological replicate; the mean of three biological replicates was then calculated. Mean comparison between transformant and WT for each stage of development was done using a Student's t test with SAS software version 8.01 [14].
2.5 Transcriptome analysis
The TOM2 cDNA microarray (CGE, Boyce Thompson Institute, Cornell University, http://bti.cornell.edu/CGEP/CGEP.html) contains 11860 different 70-mers oligonucleotides. Briefly, one μg of DNA-free total RNA [15] was used in one cycle of linear amplification with the MessageAmpTM aRNA Ambion Kit (Ambion/Applied Biosystems), the amplification products were subsequently labelled using the CyScibe Post-Labelling Kit (catalog #RPN5660X, GE Healthcare) and the cy3- and cy5-labelled cDNAs were hybridized to TOM2 microarrays using an automatic hybridization station HS 4800 (Tecan) as described by [8]. Microarray slides were scanned with a Genepix 4000 B fluorescence reader (Axon Instruments) using Genepix 4.0 Pro image acquisition software. The photomultiplier tube voltage was adjusted to 640 V for Cy3 and 700 V for Cy5. Spot flagging was done by Genepix (missing spots) and by visual inspection of the images in order to exclude saturated and heterogeneous spots.
The raw data were then submitted to LIMMA R Package v2.12.0 [16] for data visualization, normalization and statistical analysis, including multiple test adjustments (FDR) as described in Alhagdow et al. [9]. Background was first subtracted from the raw median intensities values using normexp function. To allow the comparison of the expression levels of the transcripts, we successively applied two normalization algorithms to the raw data [17]: print-tip loess (default parameters) as within-array normalization, followed by quantile normalization (default parameters) as between-array normalization.
2.6 Proteome analyses
For each stage of fruit development, three independent protein extractions corresponding to each pool were performed and proteins were analyzed by 2-DE gel as described by [18]. At least three gels per sample were stained with colloidal Coomassie blue. Protein spot detection and quantification were obtained using the image-analysis software Progenesis SameSpots v2.0 (Nonlinear Dynamics Ltd.). Spot volumes were normalized according to the total spot volumes per gel to avoid experimental variations among 2-DE gels. For statistical analysis, spots volumes were submitted to ANOVA . For protein identification, spots showing significant variations were excised from the gel, digested by trypsin and peptides were analyzed by LC-MS/MS as previously described [18].
2.7 1H-NMR analysis of polar metabolites
For NMR profiling, polar metabolites were extracted with a series of hot ethanol/water and quantified by 1H-NMR as previously described [19]. For extract preparation and NMR acquisition parameters, special care was taken to allow absolute quantification of individual metabolites through addition of ethylene diamine tetraacetic acid sodium salt solution (EDTA at 5 mM final concentration) to improve the resolution and quantification of organic acids, adequate choice of the NMR acquisition parameters, and use of an electronic reference for quantification [20]. Unknown compounds were quantified in arbitrary units. The 1H-NMR spectra were recorded on each dried titrated extract solubilised in 0.5 mL D2O added with sodium salt of (trimethylsilyl)propionic-2,2,3,3-d4 acid (TSP) at a final concentration of 0.01% for chemical shift calibration, at 500.162 MHz on a Bruker Avance spectrometer using a 5 mm inverse probe. Spectra were acquired using a 90° pulse, 20 or 25 s relaxation delay for 20 DPA or Orange stage respectively and 32 scans of 64 k data points.
2.8 LC-DAD determination of phenolic compounds
Phenolic compounds were analyzed as described in [21].
2.9 Determination of ascorbate
Ascorbate analyses were performed by using a microplate method according to [22].
3 Statistical analysis of the data sets
3.1 Kohonen's maps
The parameters were chosen according to Kohonen's advice [23] as follows: flat rectangular maps were selected; the neighborhood kernel was written in terms of a Gaussian function; the number of iterations was 500 times the number of the map units with 2000 iterations for the ordering phase of the learning. Maps of different size were constructed to modulate their resolution strength. Then each map was read considering the relative positions of the samples and their comparison. Moreover, the chemical and transcript composition of each virtual tomato sample was used to display the distribution of each metabolite or transcript on the organized map on which real samples were plotted. This two-dimensional representation can be considered as a “component sliced” version of the SOM. A grey shade gradient was used to represent metabolite or transcript levels.
3.2 Pearson correlation
For transcriptome, proteome and metabolome data integration, Pearson correlation coefficients were calculated for the two developmental stages (20 DPA and Orange) and the 5 genotypes, either on each biological replicate or on the mean of biological replicates for each data type using the PHP function stats_stat_correlation.
3.3 Database management system and programming languages
Database was developed under MySQL Relational Database Management system v5.0.24 and is hosted on a Linux server equipped with two Intel(R) Xeon(R) CPUs 5110 and 2 GB of RAM. Scripts and web interfaces were developed with Perl v5.8.8 and PHP v5.1.6. Correlation graphs were performed using jpgraph v2.3.3.
4 Results and discussion
4.1 Top–down plant systems biology approach for deciphering the interactions between ascorbate and fruit metabolism and development in tomato
In this project, our main objective was to set up a top–down systems biology approach allowing the discovery of genes involved in the regulation of ascorbate biosynthesis and in the responses to ascorbate modifications in tomato fruit. Though examples in plants remain scarce as compared to animal, a series of recent studies have emphasized the wide interest of co-expression analyses for identifying genes regulating various biological functions e.g. plant development [6,24]. Combining transcriptome (or proteome) and metabolome data through correlation and clustering analyses [25] may further help to discover links between genes and metabolic pathways, as was done for the discovery of transcription factors regulating glucosinolate biosynthesis in Arabidopsis [26,27]. Results may also be represented as networks of relationships between genes and metabolites [7,8,28–30] allowing the discovery of novel associations [31]. The incredible pace at which new plant genomes and EST datasets, including crop species, are currently being sequenced and the rapid development of tools permitting large scale identification of transcripts and metabolites now pave the way for integrative biology approach aimed at unravelling the interactions between signalling molecules, genes and metabolites.
Top–down systems biology approaches have recently emerged as very powerful tools in animal and plant sciences for the discovery of genes or networks regulating metabolic pathways or developmental processes [6,7]. Getting insights into the complex process of ascorbate biosynthesis and function in planta requires (i) the generation of large amounts of biological data (plant phenotype, large scale genomics data and, ideally, metabolic flux measurements) from plants altered in ascorbate biosynthesis and recycling and (ii) the creation of tools allowing the integration, analysis and interpretation of these data. Though tomato genome is not yet fully sequenced, a wealth of genomic data and tools to explore tomato transcriptome, proteome and metabolome are available in this species [15,19,28,32–36], making it highly suitable for top–down systems biology approach on fruit ascorbate. Combined transcriptome-metabolome analysis of various fruit traits, including ascorbate content [9], have been undertaken [8,31]. However, to date, no systems biology approach on fruit using large scale genomic approaches on mutants affected in several steps of a metabolic pathway has been undertaken.
As shown in Fig. 1, such an approach proceeds through successive phases of (i) data acquisition, (ii) data storage and integration, (iii) data correlation and causality [37]. Last, when main components have been identified and validated, models of the system can be established and used for prediction of model behaviour and for the identification of targets e.g. for improving fruit ascorbate content. In order to study the system, it is usually necessary to provoke some perturbations in it and observe how the whole system behaves in response to these changes. There are several possible ways for modifying ascorbate accumulation in tomato fruit e.g. by manipulating the level or activity of the enzymes involved in ascorbate biosynthesis by using existing natural or artificially-induced genetic variability [38,39] or by modifying environmental conditions e.g. the incident light and irradiance [40]. Alteration in any of them is prone to affect ascorbate in the fruit. Because ascorbate biosynthesis is connected to other metabolic pathways [1,4] and that ascorbate itself plays a major role in the regulation of a number of metabolic and developmental processes [41], it is indispensable to observe the system on the largest possible scale.
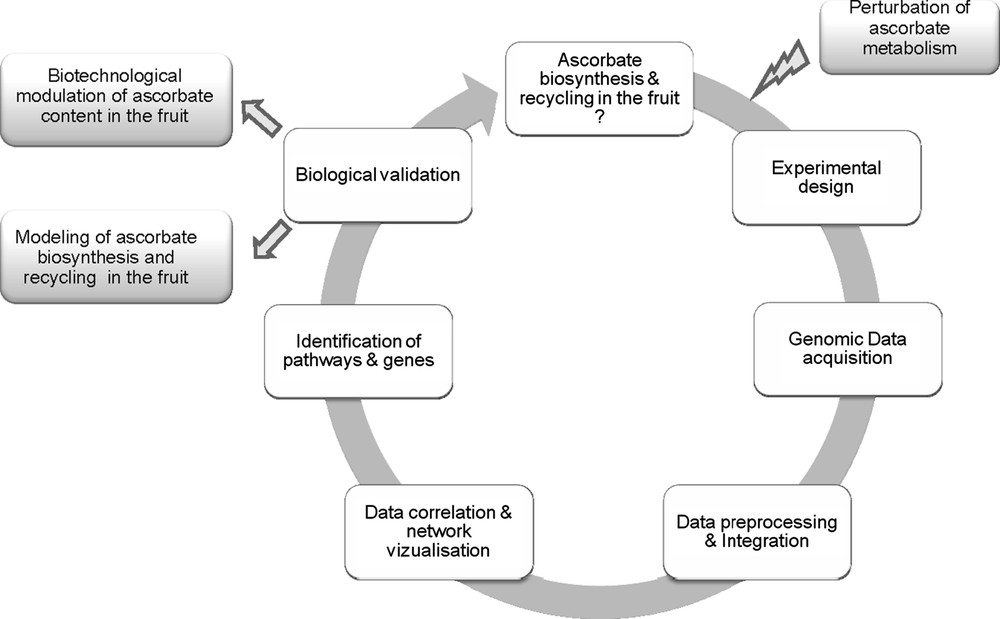
Top–down systems biology approach for studying ascorbate/fruit interactions in tomato.
4.2 Perturbation of ascorbate accumulation and composition in the fruit
Since fruit ascorbate may be synthesized in vegetative tissues and then transported to the fruit or mainly synthesized in the fruit [39], we first verified that fruit was the main site of biosynthesis of fruit ascorbate. To this end, we modified the amount of incident light. This was indeed the case as presented in Fig. 2, which shows the decrease in total and reduced ascorbate of the fruit upon fruit shading. In contrast, shading plant leaves did not affect fruit ascorbate content [39]. This result indicates that fruit can indeed be considered as an isolated system with respect to ascorbate biosynthesis and recycling, thereby allowing the acquisition, comparison and analysis of genomic datasets related to ascorbate metabolism and action on the fruit.
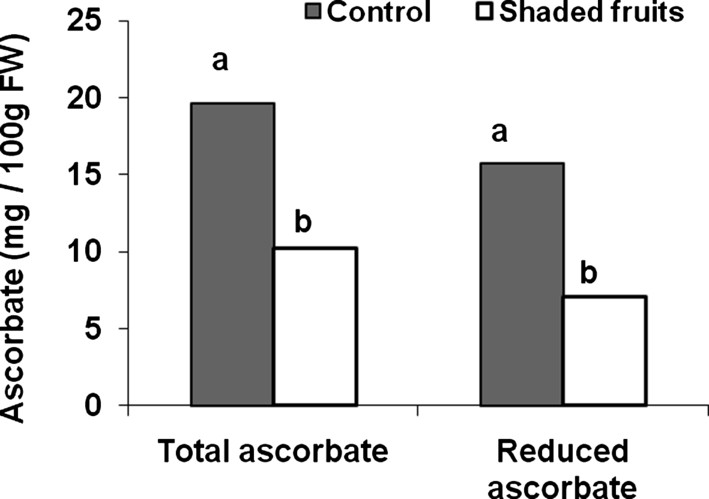
Impact of fruit shading on fruit ascorbate content (total and reduced ascorbate) in fruit harvested at green mature stage (28 DPA). Differences between means (assessed by a Tukey test) are indicated by different letters.
We then introduced perturbations in the fruit/ascorbate system through the alteration of ascorbate biosynthesis and recycling in tomato plant. This was achieved by down-regulating ascorbate metabolism genes in tomato transgenic plants by a RNAi strategy. Towards this end, we screened tomato EST databases (http://www.sgn.cornell.edu and http://compbio.dfci.harvard.edu/tgi/) for identifying tomato cDNAs encoding GDP mannose--epimerase (GME), Galactonolactone dehydrogenase (GalLDH), Ascorbate oxidase (AO) and Monodehydroascorbate reductase (MDHAR). As shown in Fig. 3, which illustrates the major biosynthesis and recycling ascorbate pathways in plants, the GME and GalLDH enzymes are involved in ascorbate biosynthesis while AO and MDHAR are implicated in ascorbate recycling. We then generated transgenic plants expressing tomato SlGME, SlGalLDH, SlAO and SlMDHAR – specific RNAi fragment under the control of the CaMV35S promoter. As previously described for the SlGalLDH and SlGME transformants [9,10], we selected for each target gene in this study one transformant with strongly reduced transcript abundance (data not shown) among >10 independent primary transformants. As shown in Fig. 4A, all the genotypes were grown side-by-side in one unique location, allowing direct comparison of transgenic and wild type tomato plants in closely similar environmental conditions. Plant and fruit phenotypes were affected in several transgenic lines as exemplified in Fig. 4 showing delayed plant growth (Fig. 4B) and leaf bleaching (Fig. 4C) of SlGME RNAi-silenced transgenic lines. Accordingly, in SlGME transgenic line, both total and reduced ascorbate content were strongly reduced in 20 DPA and Orange fruit (Fig. 4D) in agreement with our previous results [10]. However, in SlGalLDH line, in contrast to our previous observations which showed a change of the reduced to total ascorbate ratio in 20 DPA fruit but no changes in total ascorbate content when compared to WT fruit [9], we observed at this stage of fruit development a slight increase in total ascorbate content but no change in ascorbate redox status (data not shown). This result emphasizes the sensitivity of ascorbate biosynthesis and recycling processes to changing environmental conditions. It also points out the absolute requirement of identical plant culture conditions allowing comparison of the different genotypes when undertaking a systems biology approach on ascorbate, as was done in this study.
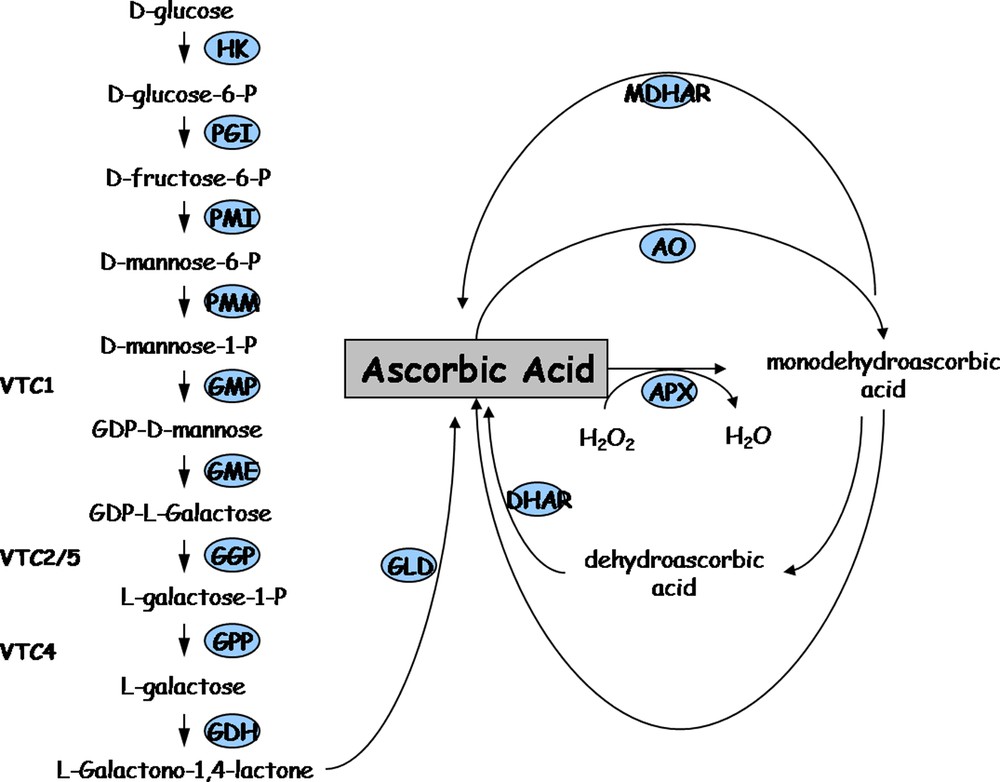
Major ascorbic acid synthesis and recycling pathways in plants. HK: hexokinase, PGI: phosphoglucose isomerase, PMI: phosphomannose isomerase, PMM: phosphomannose mutase, GMP: GDP mannose pyrophosphorylase (vtc1); GME: GDP mannose-3′,5′-epimerase; GGP: GDP-L-galactose phosphorylase or L-galactose guanyltransferase (vtc2/5); GPP: galactose-1-P phosphatase (vtc4); GDH: galactose dehydrogenase; GLD: galactono-1,4-lactone dehydrogenase; MDHAR: monodehydroascorbate reductase; AO: ascorbate oxidase; APX: ascorbate peroxidase; DHAR: dehydroascorbate reductase.
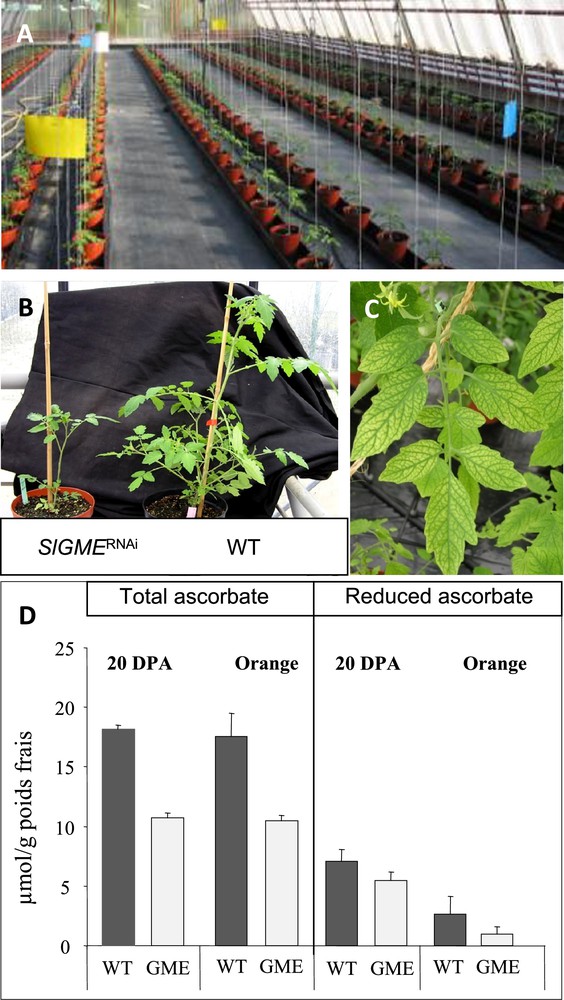
Experimental conditions for modifying ascorbate content and redox state in tomato via transgenesis. (A) Greenhouse culture allowing the comparison side-by-side and in identical conditions of tomato transgenic plants altered in ascorbate content and/or composition. (B) Delayed plant growth of GME RNAi-silenced. (C) Leaf bleaching of GME RNAi-silenced line. (D) Ascorbate content of 20 DPA and Orange fruit from GME RNAi-silenced line.
5 The VTC fruit project
Using the top–down systems biology approach described in Fig. 1, the specific aims of the VTC Project were: (i) to acquire at two different stages of fruit development (20 DPA and Orange stage) large experimental datasets (transcriptome, proteome, metabolome) from tomato lines altered in ascorbate biosynthesis and recycling (RNAi transgenic lines for GME, GalLDH, AO, MDHAR), other phenotypic data related to plant and fruit phenotype were also collected and stored; (ii) to develop tools allowing the storage of data from different origins (transcriptome, proteome, metabolome) in a common database; (iii) to develop a toolbox integrating already existing or newly developed tools to extract, compare and interpret the data using statistical and data visualization approaches; and, if possible, (iv) to identify pathways and processes connected to ascorbate, and key genes regulating either ascorbate biosynthesis and recycling or fruit responses to changes in ascorbate content and redox state. These different steps (i) to (iv) are illustrated in Fig. 5.
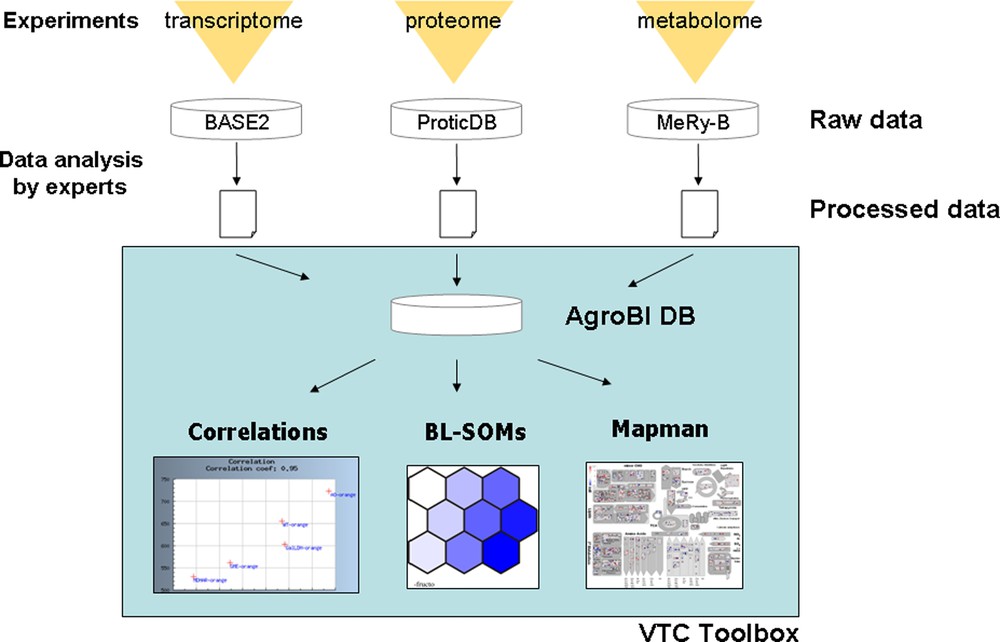
The VTC Tool Box.
5.1 Experimental design for transcriptome, proteome and metabolome analyses and data acquisition
All plants were grown in one location (INRA Avignon) at the same period in order to minimize any effect of changing environmental conditions. Large scale genomics (transcriptome, proteome, metabolome) analyses were carried out at two stages of fruit development (20 DPA and Orange stage) on homozygous T2 plants, which were also characterized for visual phenotypic aspect and ascorbate content. The two developmental stages studied correspond to the cell expansion phase (20 DPA) and to the ripening phase (Orange stage). For each line (SlGME, SlGalLDH, SlMDHAR, SlAO) and WT, all Omics analyses were carried out on three biological replicates. Each biological replicate consisted of three pooled fruit samples. In addition, for each biological replicate, two technical replicates were included for transcriptome and for metabolome analyses. The mean of three biological replicates was then calculated. For transcriptome, 525 differentially expressed genes were identified at 20 DPA and 156 at Orange stage using an adjusted P-value <0.05 and ratio threshold of 0.8 (preliminary results). For proteome, at 20 DPA 30 spots were differentially expressed and among them 18 proteins were identified. At orange stage 41 spots were identified among 78 varying spots. For metabolome data, 30 metabolites at 20 DPA and 29 metabolites at Orange stage were quantified using 1H-NMR and 6 compounds were quantified using LC-DAD.
5.2 Data storage and integration
The raw data obtained by Omics analyses were stored in three already existing different databases namely BASE2 [42], ProticDB [43] and MeRy-B (http://www.cbib.u-bordeaux2.fr/MERYB/) for transcriptome, proteome and NMR metabolome data, respectively (Fig. 5). In a first step, the study of the effect of environmental conditions on ascorbate accumulation in the fruit was restricted to wild type plants (see [34]). Because the integration of such large amounts of data from different origins requires the automation of statistic calculations and visualization tools, we developed a database to store the normalized data generated by experts for each Omics analysis and the functional annotations of the genes. Each oligonucleotide spotted on the TOM2 tomato microarray and each peptide identified from fruit proteome analysis was associated to one or more tomato unigene as defined by the Solanaceae Genome Network (SGN) database. When available, the corresponding functional annotations were also included in the database. Each metabolite was associated to its MapMan name [11,12]. Classification in functional categories of each element (oligonucleotides, peptides and metabolites) was done according to tomato MapMan [12].
Web interfaces were developed, allowing the end-user to: (i) retrieve processed data (tomato transcripts, proteins and metabolites) according to their functional classification and to several criteria that can be selected: identifier or threshold value; (ii) visualize pair-wise Pearson correlations between a metabolite and/or a transcript and/or a protein using a correlation threshold that can be selected. In addition, functional categories can also be selected. It is thus possible to focus on the correlation between a given metabolite (e.g. ascorbate) and a functional category (e.g. transcription factors) or a metabolic pathway (e.g. ascorbate biosynthesis); (iii) export data to other tools such as statistical tools (PCA and large correlation analysis) and MapMan visualization tool.
5.3 Data correlation and visualization for the identification of pathways and genes in ascorbate-altered tomato transgenic lines
In order to analyze and interpret the meta datasets generated by the VTC Fruit project, we have adapted several existing data analysis and visualization tools (Kohonen's SOMs, MapMan) in addition to other statistical tools (Pearson correlations, Principal Component Analyses).
5.3.1 SOMs
To explore the transcriptome and metabolite multidimensional data set, we first used an unsupervised statistical method, the self-organizing map (SOM) algorithm [22] that is a particular application of Artificial Neural Networks. The Kohonen network consists of two layers of neurons: the first layer (input layer) is connected to each vector of the data set (i.e. one vector is a real tomato sample with 44 standardized metabolites and 156 transcripts) and the second layer (output layer) which is the Kohonen's map, forms a two-dimensional array of neurons arranged on a hexagonal lattice (Fig. 6). For this purpose, in each hexagon, a reference vector is considered. The reference vectors correspond to virtual tomato samples with metabolites and transcripts to be computed. In the output layer, the units of the grid (virtual tomato samples) give a representation of the distribution of the tomato samples in an ordered way. The modifications of the virtual tomato samples are made through an Artificial Neural Network and computed during a training phase by iterative adjustments. For learning, only input units are used, no expected-output data is given to the system: this is referring to as unsupervised learning. In this work, the parameters were chosen according to Kohonen's advice [22] as described in Section 2.
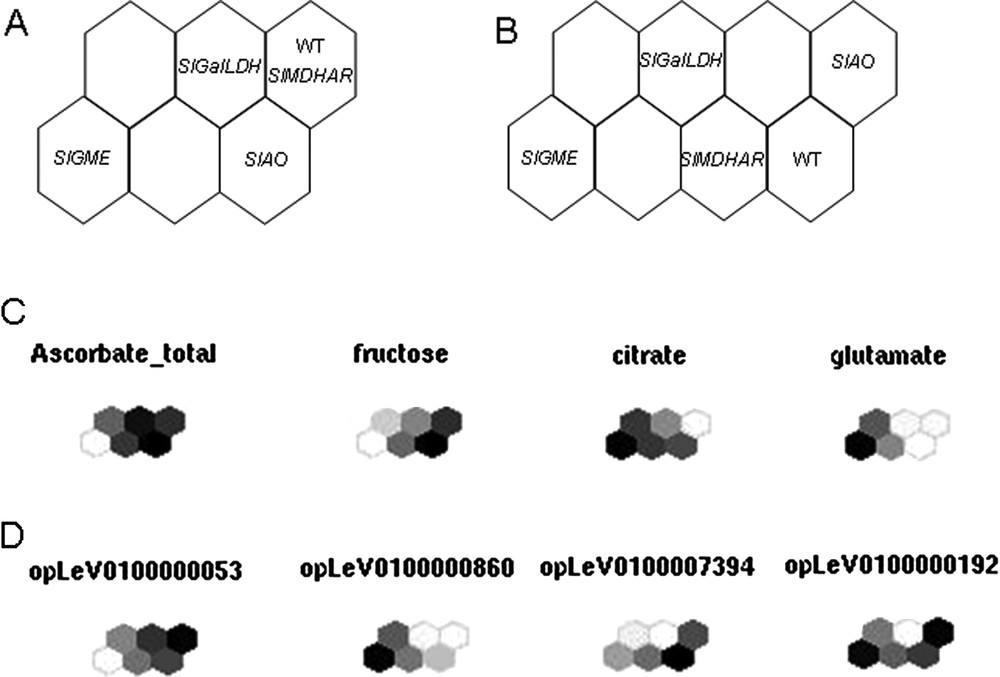
Kohonen's maps. Distribution of the five lines at Orange stage on a six-unit (A) and eight-unit (B) SOM for absolute levels of metabolites measured by 1H-NMR and normalized levels of expression of transcripts. The samples are coded as follows: WT for Wild type, SlGME for SlGME RNAi line, SlGalLDH for SlGalDH RNAi line, SlMDHAR for SlMDHAR RNAi line and SlAO for SlAO RNAi line. Maps were calculated on mean-centered data scaled to unit variance of the pool mean value of each sample. (C) and (D) show a component plane representation of some divergent metabolites (C) and transcripts (D).
Within the VTC Fruit project, a new tool has been created as an R package (SOMVTC) to cluster data (transcripts or proteins and metabolites) according to the SOM algorithm. It provides graphical user interfaces to perform SOMs. The dataset is loaded via a csv file or a R data-frame and different parameters can be adjusted to calculate the maps (e.g. choice of the variables in the dataset to consider, size of the map). After learning phase, result interface gives direct access to topographic and quantization error, ordination map and variables map. Additionally, new data can be loaded and mapped on existing ones, and the entire project can be saved. This tool will be eventually included in the toolbox. It has already generated the first maps for the VTC database. As shown in Fig. 6A, distribution of the 4 transgenic lines plus WT lines (Orange stage) on a six-unit SOM (Fig. 6A) allows separation of the SlGME, SlGalLDH and SlAO transgenic lines from WT while eight-unit SOM (Fig. 6B) allows separation from WT of all the transgenic lines, including SlMDHAR. The distribution of individual metabolites and transcripts in the six-unit SOMs allows the visualization of the differences between each line with respect to the given metabolite or transcript studied, as exemplified in Figs. 6C and 6 D. It clearly appears from Fig. 6C, for example, that the WT and SlGalLDH lines are not much different with respect to total ascorbate. In contrast, the SlGME line is clearly different from WT, as already indicated in Fig. 4.
5.3.2 MapMan
MapMan is a very intuitive tool allowing the biologist user to display genomics data sets onto diagrams of metabolic pathways and other biological processes. First developed for Arabidopsis [11], it has later been adapted to Solanaceae [12] and continuously been up-dated since then at MPI-Golm to include new data (sequences, microarrays, functional classifications) for that species. Metabolite data and transcriptome and/or proteome data extracted from the VTC Tool box can be loaded onto MapMan in order to visualize differences in transcripts, proteins and metabolites for specific pathways and biological processes. As shown in Fig. 7, the MapMan representation of nucleotide sugar converting genes expressed in WT and SlGME transgenic line clearly indicates that silencing the GDP-mannose--epimerase (GME), which catalyses the conversion of GDP-mannose to GDP-L-galactose, has important consequences on several steps of the cell wall biosynthetic pathway since a large number of genes involved in cell wall biosynthesis were up- or down-regulated.
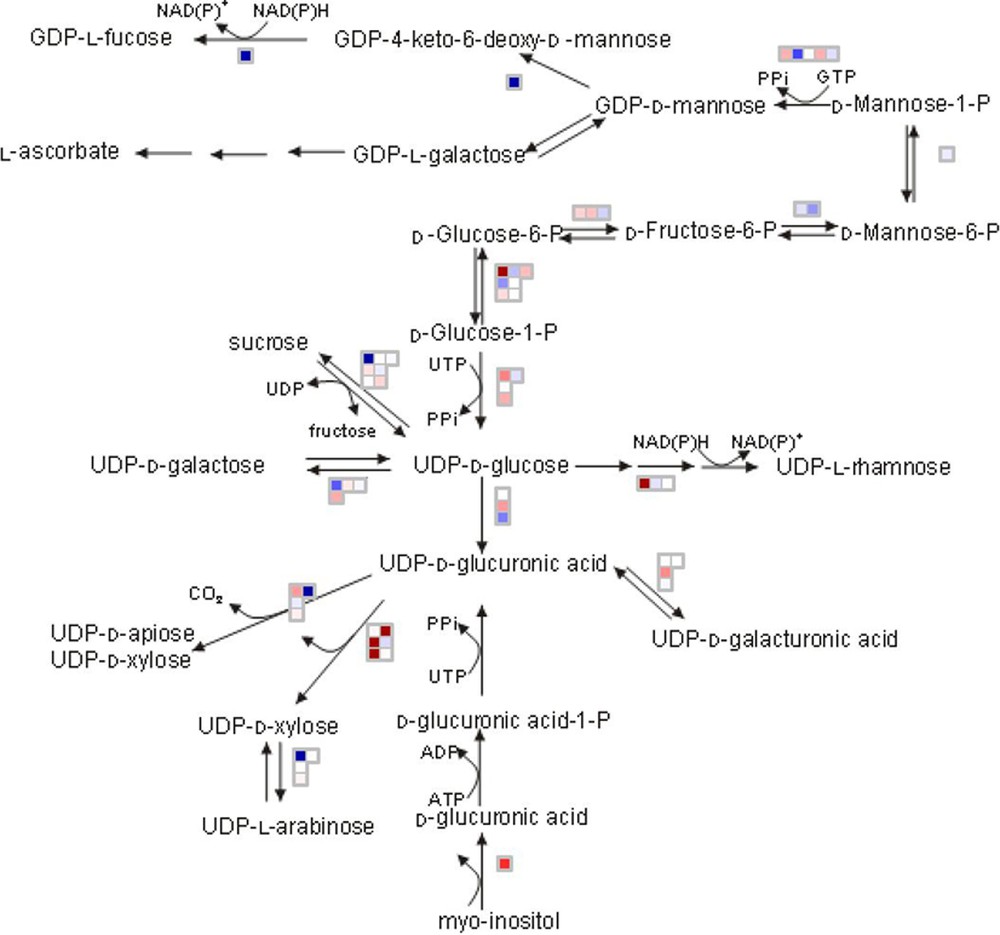
MapMan representation of the expression of the genes involved in biosynthesis of the cell wall in SlGME line relative to Wild type at Orange stage. Data are the ratio on a log2 scale of the mean value of the three biological replicates. Transcripts with increased abundance in SlGME line are represented in blue and with decreased abundance are represented in red. The selected scale gives an intense coloration at log2 ratio = 0.6.
5.3.3 Pearson correlations
Pearson correlation coefficients were calculated for each or the two developmental stages (20 DPA and Orange) and for the 4 transgenic lines plus WT. In addition, correlations corresponding to a coefficient with were examined using scatter plots and network reconstruction (data not shown). As already shown in potato [24] and recently in tomato tissues [8], correlation analyses can be powerful tools to identify the contribution of individual genes to the control of developmental processes or metabolites. Though the assumption of a correlation between a metabolite and a gene does not absolutely prove gene-metabolite functional relationships and does not indicate the direction of the interaction, several of the correlations highlighted in this study are worth to be studied more in detail by functional approaches. As an example, Fig. 8A shows the correlation between total ascorbate content of the different lines and the transcript abundance of a WRKY transcription factor (Fig. 8A; ) and of a 1,4 beta mannan endohydrolase (Fig. 8B; ). Though these data are still preliminary and that correlations shown in Fig. 8 were calculated from the means of biological replicates for only one stage (Orange) of fruit development, the correlations shown are biologically relevant. The WRKY transcription factors have known roles in plant defense and response to various biotic and abiotic stresses. Accordingly, their expression can vary with changes in the redox status of the plant which can be triggered by the modifications in total ascorbate content or reduced/total ascorbate ratio [9,44] such as those occurring in the transgenic lines. The correlation between total ascorbate levels in the various transgenic lines and the differential expression of a beta mannan endohydrolase in the transgenic lines studied is very interesting because ascorbate biosynthesis pathways and cell wall biosynthesis pathways share common precursors such as the nucleotide sugars GDP-mannose and GDP-galactose [45] and that the SlGME silenced lines are affected in both ascorbate and cell wall biosynthesis [10].
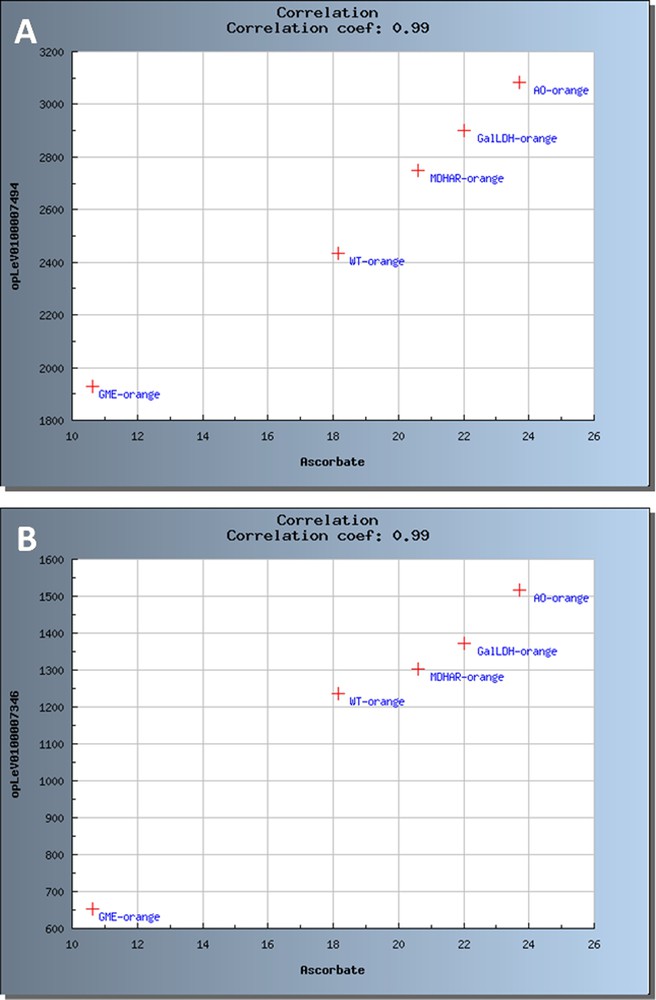
Scatter plots representing significant correlations between ascorbate and transcripts at Orange stage. The samples are coded as follows: WT for Wild type, GME for SlGME RNAi line, GalDH for SlGalDH RNAi line, MDHAR for SlMDHAR RNAi line and AO for SlAO RNAi line. (A) Correlation with WRKY transcription factor. (B) Correlation with 1,4 beta mannan endohydrolase.
5.4 Towards biological validation of candidate genes and biotechnological modulation of ascorbate in the fruit
Preliminary analysis of the meta datasets generated within the VTC Fruit project and stored in the VTC Tool database confirm the link between ascorbate biosynthesis and cell wall biosynthesis and modification, as indicated by the changes in the expression of genes implicated in the cell wall precursor (i.e. nucleotide sugar) biosynthesis pathway in the SlGME transgenic as visualized using MapMan (Fig. 7) and by the positive correlation between ascorbate level and expression of 1,4 beta mannan endohydrolase (Fig. 8B). We recently showed that the severely silenced SlGME lines exhibited strong changes in plant phenotype, with an increased fragility of the plant and a modification of fruit firmness. These phenotypic changes were linked to modifications in cell wall composition, among which an increased mannan content [10]. The results presented herein comfort these observations and further suggest that not only cell wall biosynthesis but also cell wall modifications may be regulated by alteration in ascorbate biosynthesis and recycling pathway.
As exemplified for the ascorbate and cell wall interactions, the results already obtained in the VTC Fruit project demonstrate that, even on crop species for which genome-wide datasets are not yet available (tomato genome is not yet sequenced and full genome microarrays are not available), the top–down systems biology approaches can lead very rapidly to the discovery of target genes possibly involved in the control of biochemical pathways or biological functions in plants and give some hint on the co-regulated pathways. In the short term, we plan to implement in the VTC Tool box several statistical tools allowing other correlations such as Spearman correlation or multifactorial analysis. The long-term objectives are, in addition, to introduce additional perturbations of ascorbic acid content in the fruit through alteration of fruit and plant environment (light, temperature) and of storage conditions (chilling), in order to characterize the behavior of transgenic fruits, to validate the potential candidate genes identified through the VTC Fruit project and, if possible, to modify fruit ascorbate content by targeting candidate genes using natural or artificially-induced genetic variability [36].
Acknowledgements
This work was principally funded by the INRA AgroBI program, the Région Aquitaine (L. Gilbert) and the Région Aquitaine/Midi-Pyrénées cooperative program. The transcriptome and metabolome analyses were done on the Genome-Transcriptome and Metabolome-Fluxome Facilities of Bordeaux Functional Genomics Center. For proteins, the mass spectrometry was done at the proteomic platform of INRA le Moulon (Gif-sur-Yvette, France).