

1 Introduction
Rice is the grain that has shaped cultures, diets and economies of billions of Asians. For them, rice is more than a food; it is an inseparable part of life. It alone is a staple food for one-third of the world population [1]. It is a crop that is planted in a very wide range of solar radiation values ranging from around 300 to more than 600 MWh cm−2 per day [2]. Through the centuries of cultivation and selection, thousands of rice cultivars have been evolved, which are well adapted to the local environments. Many of those also possess good taste and qualities and are preferred by the people. A group of such rice characterized by the presence of scent in it and often slender in shape is termed as aromatic rice [3,4]. The International Fine Grain Aromatic Rice Nursery (IRFAON) suggested that aromatic rice should have aroma and an elongation ration of 1.95 [5]. These rice emit aroma in fields, at harvesting, in storage, during milling, cooking and eating [6]. Aroma development is influenced by both genetic factors and the environment. Pleasant aroma is a result of a large number of compounds present in specific proportion. In Bangladesh, aromatic rice varieties are normally transplanted in rainy season (T. Aman) and most of them are popularly grown in a specific location. This is believed to be due to the variations of agro-ecological conditions.
Biomass accumulation or biological yield of a rice crop is dependent on the conversion efficiency of light energy into dry matter. Economic yield is the product of aboveground biomass and harvest index. Previous experience indicated that a further increase in grain yield potential will be attained mainly by increasing biomass production, since increasing harvest index for cereal crops is difficult [7,8]. Photosynthetic efficiency is not the only determinant for grain yield; however, a higher photosynthetic rate is an obvious prerequisite for higher yield [9,10]. Canopy net photosynthetic rate is a function of LAI, canopy structure and single leaf photosynthetic rate [11]. Crop growth rate and NAR are important parameters that indicate the level of photosynthetic efficiency. In general, aromatic rice genotypes are low yielding in nature. For the improvement of aromatic rice, it deserves the investigation of growth parameters and hence photosynthetic efficiency of available germplasm. With this view, an attempt was initiated to study the growth parameters, dry matter production and energy use efficiency of aromatic rice genotypes of native and exotic sources.
2 Materials and methods
2.1 Crop management
The experiment was conducted at the farm of Bangladesh Rice Research Institute (BRRI), Gazipur in T. Aman season (July to December), 2005. A total of 40 rice germplasm composed of 32 local aromatic, five exotic and three non-aromatic rice cultivars as standard checks were selected for this research (Table 1). Among the three non-aromatic varieties, BR28 is a modern Boro, BR39 is a modern T. Aman variety and Nizersail is a local improved variety and are popularly grown in farmers’ fields. The exotic genotypes were collected from Pakistan (Basmati PNR346), Nepal (Sarwati and Sugandha-1) and Iran (Khazar and Neimat). The rest of the genotypes represented their distribution throughout Bangladesh. Forty rice genotypes formed the treatment variables and were assigned randomly to each unit plot of 5 m × 2 m dimension.
Leaf area index and growth parameters of forty rice genotypes (average over three replications).
| Name of genotype | Leaf area index | CGR (g m−2 per day) | RGR (mg g−1 per day) | ||||
| At PI | At heading | At PI | At heading | At PI | At heading | ||
| 1 | Badsha bhog | 0.91 | 3.46 | 13.98 | 10.55 | 84 | 15 |
| 2 | Baoi jhak | 0.67 | 3.56 | 13.98 | 8.43 | 99 | 12 |
| 3 | Basmati Tapl-90 | 1.44 | 4.05 | 14.42 | 9.50 | 63 | 11 |
| 4 | Basmati PNR 346 | 1.30 | 2.16 | 12.32 | 14.68 | 71 | 28 |
| 5 | Begun bichi | 0.89 | 4.05 | 15.20 | 10.07 | 81 | 14 |
| 6 | Benaful | 1.05 | 3.50 | 18.46 | 12.30 | 85 | 15 |
| 7 | Bhog ganjia | 1.01 | 3.53 | 15.59 | 8.47 | 100 | 13 |
| 8 | BR28 | 1.09 | 2.96 | 14.57 | 19.40 | 71 | 52 |
| 9 | BR38 | 2.31 | 3.24 | 13.97 | 23.33 | 45 | 34 |
| 10 | BR39 | 1.17 | 3.48 | 14.12 | 16.23 | 77 | 21 |
| 11 | Chinigura | 1.25 | 3.56 | 11.56 | 13.00 | 65 | 17 |
| 12 | Chinikani | 2.19 | 3.36 | 19.76 | 16.17 | 57 | 21 |
| 13 | Darshal | 1.65 | 4.07 | 19.84 | 9.70 | 77 | 15 |
| 14 | Doiar guro | 2.69 | 3.57 | 21.13 | 14.17 | 47 | 18 |
| 15 | Elai | 1.05 | 3.84 | 14.25 | 13.33 | 87 | 17 |
| 16 | Gandho kasturi | 2.51 | 3.96 | 23.53 | 11.67 | 62 | 14 |
| 17 | Gandhoraj | 0.97 | 3.64 | 14.08 | 20.63 | 87 | 28 |
| 18 | Hatisail | 0.83 | 3.52 | 13.44 | 14.65 | 107 | 19 |
| 19 | Jamai sohagi | 1.03 | 3.66 | 10.38 | 5.14 | 72 | 7 |
| 20 | Jata katari | 1.04 | 3.16 | 9.71 | 11.06 | 73 | 16 |
| 21 | Jesso balam | 1.06 | 3.29 | 12.72 | 12.30 | 67 | 18 |
| 22 | Jira katari | 1.11 | 3.21 | 17.26 | 10.33 | 79 | 14 |
| 23 | Kalijira Tapl-73 | 2.62 | 4.10 | 23.64 | 12.00 | 60 | 15 |
| 24 | Kalomai | 0.97 | 3.16 | 16.32 | 6.89 | 89 | 9 |
| 25 | Kamini soru | 1.22 | 3.68 | 15.16 | 10.37 | 69 | 14 |
| 26 | Kataribhog | 1.06 | 3.58 | 16.57 | 12.37 | 88 | 18 |
| 27 | Khazar | 0.52 | 1.77 | 5.63 | 4.80 | 66 | 15 |
| 28 | Laljira Tapl-130 | 2.58 | 4.31 | 16.70 | 12.88 | 53 | 18 |
| 29 | Niemat | 0.90 | 2.36 | 13.96 | 9.86 | 78 | 24 |
| 30 | Nizersail | 2.05 | 3.68 | 16.64 | 12.07 | 51 | 17 |
| 31 | Philippine katari | 1.25 | 3.34 | 18.25 | 11.36 | 77 | 13 |
| 32 | Premful | 1.01 | 3.72 | 16.63 | 9.80 | 83 | 14 |
| 33 | Radhuni pagal | 2.30 | 4.85 | 20.67 | 11.36 | 51 | 14 |
| 34 | Rajbhog | 2.48 | 3.63 | 19.90 | 7.59 | 48 | 9 |
| 35 | Sai bail | 1.52 | 4.14 | 20.90 | 9.30 | 68 | 11 |
| 36 | Sakkor khora | 2.53 | 4.91 | 24.11 | 11.87 | 59 | 14 |
| 37 | Sarwati | 1.70 | 3.17 | 18.23 | 12.56 | 72 | 23 |
| 38 | Sugandha-1 | 1.41 | 3.41 | 23.68 | 19.80 | 86 | 27 |
| 39 | Tilkapur | 1.50 | 4.22 | 19.07 | 12.42 | 85 | 16 |
| 40 | Ukni madhu | 1.56 | 3.55 | 18.68 | 13.23 | 75 | 15 |
| GCV | 33.1 | 15.89 | 24.22 | 30.99 | 20.13 | 33.17 | |
| PCV | 57.06 | 18.63 | 25.58 | 33.95 | 21.76 | 35.35 | |
| SE | 0.04 | 0.06 | 0.78 | 0.97 | 10 | 6 | |
| CV | 4.6 | 3.0 | 8.2 | 13.9 | 8.3 | 14.3 | |
| F prob.-value | < 0.01 | < 0.01 | < 0.01 | < 0.01 | < 0.01 | < 0.01 |
Thirty day-old seedlings were transplanted on 15 August 2005 following Random Complete Block Design (RCBD) with three replications. Transplanting was done at the spacing of 20 cm × 20 cm. A fertilizer rate of 25–35–10–3 kg ha−1 of P–K–S–Zn in the form of triple super phosphate, muriate of potash, gypsum and zinc sulphate, respectively, was applied as basal dose at final land preparation. Because of wide genotypic variation in phenological development and yield potential, varieties differed enormously in attaining panicle initiation (PI) stage and in the requirement of nutrient elements. For this reason, nitrogen was top-dressed as urea in two to three splits to the contrary of common practice with fixed dose and time routine. The amount of urea and time of application were determined with the help of a leaf colour chart [12].
2.2 Data collection
Data collection was started at 20 days after transplanting (DAT), i.e., 50 days after sowing (DAS) and continued with a 10-day interval up to harvesting (4th September to 18th December, 2005). Random samples of four plants from each plot were uprooted. In each sample plant, the mid-tiller was separated. All green leaf blades of four mid-tillers were taken for the measurement of leaf area through the length-width method [13]. Also the leaves were dried and weighed. The leaves from the rest of the tillers of the sample plants were dried and weighed. Leaf area index was estimated as follows:
| where, | a = leaf area of middle tillers |
| w = dry weight of leaves of mid-tillers | |
| W = total dry weight of all leaves of the whole sample |
The whole plant samples were oven dried at 70 °C for 72 hours to determine the CGR (crop growth rate) after Radford [14]. Shoot dry weight was used from 20 DAT up to crop maturity with an interval of 10 days.
| where, | t1 = day of starting, | t2 = day of final record |
| W1 = dry weight at t1, | W2 = dry weight at t2 |
Relative growth rate (RGR) was measured as growth rate per unit plant biomass following the formula described below [15] :
Net assimilation rate (NAR) is the ratio of crop growth rate to average leaf area and calculated as follows [16] :
Plants were harvested at crop maturity. All the plants of a 5-m2 sample area were cut at base. After threshing and cleaning, the fresh weight of grains was recorded and adjusted to 14% moisture content as follows:
| where, | FW = fresh weight of the grains |
| MC = % moisture in the fresh grains |
The fresh weight of straw from 5-m2 harvested area was recorded. Three sub-samples were composed and well mixed. Then a representative sub-sample of 500 g fresh straw, separated from the mixture, was oven-dried at 80 °C for 3 days. Then the straw yield was calculated as follows [16]:
Dry straw weight of harvested area = (Fresh straw weight of harvested area) × CF.
Harvest index was expressed as % as below [17]:
In the computation of energy use, efficiency or photosynthetic efficiency (Eμ) biomass sample collection was made from 50 DAS (20 DAT) to crop maturity. Data on solar energy incidence, available in the meteorological laboratory of Plant Physiology Division in BRRI, Gazipur, were used in the following formula [17]:
| where, | ΔW = dry matter increase (g m−2) |
| ΣS = total amount of incident solar radiation (cal m−2) | |
| = average daily incident solar radiation (cal cm−2 per day) | |
| T = number of days | |
| K = heat of combustion = 3750 cal g−1 [18]. |
2.3 Statistical analysis
Genotypic and phenotypic coefficients of variation were estimated according to Burton [19]. Correlation coefficient and path analysis was performed according to Singh [20]. Data were subjected to several statistical analyses to interpret the result. The ANOVA and some descriptive statistics were performed through IRRISTAT Windows 4.01 and MS Excel.
3 Results and discussion
3.1 Genotypic variation in growth and yield
Growth parameters, dry matter production and energy use efficiency are presented in Tables 1 and 2. Rice genotypes under the study varied to a great extent for the leaf area index (LAI) both at panicle initiation (PI) and heading stages. Minimum LAI-values (0.52 and 1.77) were observed in Khazar at PI and heading stage, respectively where LAI-values were maximum (2.69 and 4.91) for Doiar guro at PI stage and Sakkor khora at heading stage, respectively. In general, the LAI-values were found to increase two to three folds from PI stage to heading stage. Previous experience and available literature suggested that an LAI of five to six is necessary for to achieve maximum crop photosynthesis during the reproductive stage [17]. Aromatic rice normally produce narrower leaves that ultimately yield lower LAI-value than modern rice.
Assimilation, dry matter production and energy use efficiency (photosynthetic efficiency) of forty rice genotypes (average over three replications).
| Name of genotype | NAR (g g−1 per m2 LA) | Grain yield (t ha−1) | TDM (t ha−1) | HI (%) | Eμ (%) | ||
| At PI | At heading | ||||||
| 1 | Badsha bhog | 8.97 | 4.15 | 2.86 | 8.66 | 33.03 | 1.18 |
| 2 | Baoi jhak | 11.89 | 3.39 | 2.88 | 8.56 | 33.80 | 1.21 |
| 3 | Basmati Tapl-90 | 7.82 | 2.74 | 3.23 | 8.68 | 37.19 | 1.25 |
| 4 | Basmati PNR 346 | 7.83 | 7.32 | 3.24 | 7.47 | 43.47 | 1.22 |
| 5 | Begun bichi | 12.06 | 3.46 | 2.90 | 8.18 | 35.48 | 1.17 |
| 6 | Benaful | 10.46 | 3.92 | 2.88 | 10.46 | 27.54 | 1.34 |
| 7 | Bhog ganjia | 10.58 | 3.01 | 2.56 | 7.94 | 32.30 | 1.08 |
| 8 | BR28 | 7.79 | 7.06 | 3.95 | 8.10 | 48.81 | 1.39 |
| 9 | BR38 | 5.47 | 7.72 | 4.19 | 10.47 | 40.07 | 1.40 |
| 10 | BR39 | 8.10 | 6.26 | 4.21 | 9.09 | 46.38 | 1.47 |
| 11 | Chinigura | 7.39 | 4.72 | 2.83 | 8.96 | 31.63 | 1.22 |
| 12 | Chinikani | 8.71 | 4.46 | 2.88 | 11.39 | 25.26 | 1.46 |
| 13 | Darshal | 8.89 | 2.44 | 2.99 | 7.98 | 37.48 | 0.98 |
| 14 | Doiar guro | 7.80 | 4.40 | 2.91 | 10.37 | 28.11 | 1.31 |
| 15 | Elai | 9.65 | 4.33 | 3.35 | 9.54 | 35.12 | 1.28 |
| 16 | Gandho kasturi | 8.97 | 3.20 | 3.20 | 12.26 | 26.08 | 1.37 |
| 17 | Gandhoraj | 9.76 | 6.79 | 2.53 | 11.03 | 22.92 | 1.47 |
| 18 | Hatisail | 10.42 | 4.82 | 2.93 | 9.87 | 29.65 | 1.30 |
| 19 | Jamai sohagi | 6.44 | 1.79 | 2.49 | 7.64 | 32.61 | 1.01 |
| 20 | Jata katari | 6.96 | 5.01 | 2.98 | 8.29 | 35.98 | 1.17 |
| 21 | Jesso balam | 9.05 | 4.58 | 2.91 | 8.83 | 32.96 | 1.13 |
| 22 | Jira katari | 10.21 | 3.56 | 2.94 | 8.69 | 33.89 | 1.17 |
| 23 | Kalijira Tapl-73 | 8.39 | 3.12 | 2.29 | 10.63 | 21.53 | 1.25 |
| 24 | Kalomai | 10.41 | 2.46 | 3.01 | 8.77 | 34.29 | 1.20 |
| 25 | Kamini soru | 8.54 | 3.82 | 3.14 | 9.33 | 33.70 | 1.29 |
| 26 | Kataribhog | 11.06 | 4.70 | 2.84 | 8.21 | 34.65 | 1.12 |
| 27 | Khazar | 7.97 | 3.64 | 1.42 | 4.04 | 35.19 | 0.58 |
| 28 | Laljira Tapl-130 | 6.91 | 2.96 | 3.00 | 10.20 | 29.41 | 1.23 |
| 29 | Niemat | 10.39 | 5.03 | 2.98 | 5.97 | 50.08 | 0.98 |
| 30 | Nizersail | 6.35 | 3.26 | 3.27 | 9.93 | 32.95 | 1.22 |
| 31 | Philippine katari | 9.80 | 4.41 | 3.01 | 8.72 | 34.52 | 1.27 |
| 32 | Premful | 9.63 | 3.17 | 2.96 | 8.81 | 33.63 | 1.20 |
| 33 | Radhuni pagal | 7.23 | 2.52 | 2.42 | 10.55 | 22.99 | 1.26 |
| 34 | Rajbhog | 6.62 | 1.97 | 2.74 | 9.16 | 29.89 | 1.11 |
| 35 | Sai bail | 9.47 | 2.61 | 3.14 | 10.26 | 30.65 | 1.40 |
| 36 | Sakkor khora | 7.76 | 2.59 | 3.10 | 10.77 | 28.81 | 1.40 |
| 37 | Sarwati | 8.62 | 4.33 | 3.25 | 8.05 | 40.40 | 1.27 |
| 38 | Sugandha-1 | 11.02 | 6.41 | 3.90 | 10.53 | 37.07 | 1.65 |
| 39 | Tilkapur | 8.63 | 3.46 | 2.81 | 9.69 | 29.04 | 1.27 |
| 40 | Ukni madhu | 8.77 | 4.84 | 3.13 | 10.38 | 30.14 | 1.48 |
| GCV | 17.09 | 34.94 | 16.21 | 16.27 | 18.97 | 14.09 | |
| PCV | 18.85 | 38.10 | 16.46 | 16.62 | 19.33 | 14.72 | |
| SE | 0.40 | 0.36 | 0.05 | 0.18 | 0.72 | 0.03 | |
| CV | 7.9 | 15.2 | 2.8 | 3.4 | 3.7 | 4.3 | |
| F prob.-value | < 0.01 | < 0.01 | < 0.01 | < 0.01 | < 0.01 | < 0.01 |
The CGR-value is a basic indication of biomass accumulation. The CGR-values at PI stage ranged 5.63–24.11 g m−2 per day where Sakkor khora has the highest values. At heading stage, CGR reached 23.33 g m−2 per day in BR38. At a glance, the CGR-values maintained the same trend at PI and heading stages. According to a theoretical scientific computation, CGR of a rice crop may reach up to 32.0 g m−2 per day [17]. Considerable fluctuation was also recorded in the case of RGR in all stages of rice plants. The minimum RGR-value 45 mg g−1 per day was computed in BR38 and maximum 107 mg g−1 per day in Hatisail. A common drastic reduction in RGR was observed from PI to heading stage. The values ranged from 7 to 52 mg g−1 per day at heading. The NAR-values were found to vary from 5.47 to 12.06 g g−1 per m2LA during PI and from 1.79 to 7.72 g g−1 per m2LA during heading stage. The cultivar BR38 had the lowest NAR at PI and also the highest NAR at heading stage. A general trend of NAR-values among the genotypes observed that higher grain yielder genotypes hold the higher NAR at heading stage and not at PI. However, an opposite trend existed in case of lower grain yielders, i.e., NAR-values were much larger in PI than in heading stage.
Among the aromatic rice genotypes in the current study, BR38 produced the highest grain yield (4.19 t ha−1). The lowest yield was harvested from Khazar (1.42 t ha−1), an exotic cultivar from Iran. Inferior performance of the cultivar in a new environment might be due to lack of wider adaptability. Grain yield is the important consideration for a producer of a crop. Aromatic rice is considered as the best in quality. So, its lower yield could be accepted for the sake of consumers’ demand [4]. Among the traits studied, total dry matter yield confirmed the widest range of variation. It was lowest (4.04 t ha−1) for Khazar and highest (12.26 t ha−1) for Gandho kasturi. Harvest index varied from 21.53% in Kalijira Tapl-73 to 50.08% in Niemat. The finding is supported by a fact that a yield of 15.2 t ha−1 was achieved with harvest index of 0.47 in the subtropical environment of Yunnan, China [8]. The energy use efficiency or photosynthetic efficiency is a resultant of the biological yield of a crop. Sugandha-1 proved to be the best in terms of photosynthetic efficiency (1.65%) and whereas Khazar was the worst (0.58%). The reported maximum Eμ-value for rice was 3.7% [21]. For the entire growing period the 5-year mean, photosynthetic efficiency was calculated in a research station of Japan was 1.25% [18].
The genotypic and phenotypic coefficients of variations for each and every character were also shown in Tables 1 and 2. Highest genotypic coefficient of variation (GCV) was recorded (35%) for NAR at heading followed by RGR at heading (33%) and LAI at panicle initiation (33%). Lowest value of GCV was observed for photosynthetic efficiency (14%) followed by LAI at heading (16%) and grain yield (16%). The rest of the characters hold GCV in the range of 17–31%. A research team conducted detail experiments to compare net photosynthesis of 30 varieties and found a 20% variation among the varieties at maximum tillering stage and even a greater difference at heading stage [22]. Higher GCV in a character gives the better opportunity for a cross combination to get wider variation. The majority of the characters showed little differences between PCV and GCV which indicated negligible influence of environment on the expressions of these characters. However, LAI at both PI and heading stages and NAR at heading stage showed higher differences between GCV and PCV indicating comparatively higher influence of environments on the expression of the characters. Low GCV and PCV for plant height and panicle length were reported in different observations in common wheat [23]. In a series of experiments a group of researchers observed closeness of PCV and GCV for a few characters and much difference between PCV and GCV for others [24].
3.2 Interrelations among the growth parameters and dry matter production
Correlation coefficient analysis measures the linear relationships between characters and determines the selection of component characters for plant improvement (Singh, [20]). Relationships among the different growth parameters and biomass yield were determined through a simple correlation coefficient (r). A total of 12 characters were subjected to a correlation matrix (Table 3). Among the 66 correlation coefficient values, 13 had positive and two had negative ‘r’-values at significant level (p < 0.05). The highest positive ‘r’-value was recorded (0.82p < 0.01) between CGR and NAR both at heading stage. At the heading stage, the same ‘r’-value also was computed between RGR and NAR. The second highest positive ‘r’-value 0.80 (p < 0.01) was observed between total dry matter and photosynthetic efficiency. Energy use efficiency (Eμ) was also positively correlated with CGR at heading stage (r = 0.72**) and grain yield (0.66**). In this analysis it is clear that r-values between Eμ and grain yield and between Eμ and TDM are maintaining a sufficient distance from unity. This surveillance reflects that Eμ is an absolute dependant neither on grain yield nor on total dry matter production. Dry matter partitioning is an additional factor that affects the calculation of Eμ. McDonald et al. reported a relationship between photosynthetic capacity and biomass production; however, the relation was not so strong [25]. During the panicle initiation stage LAI showed significant negative correlation with RGR (r = −0.78**). A significant negative relation was also recorded between TDM and harvest index. The positive relationship of energy use efficiency with CGR, grain yield and TDM, and negative relationship between total dry matter and harvest index have been illustrated in Fig. 1. Several researchers have made an effort on the analyses of grain yield and related components of modern, lowland and winter rice varieties, and they reported different levels of correlation among the traits [26–28].
Matrix for correlation coefficients showing the simple linear relationship among growth parameters, dry matter production and photosynthetic efficiency.
| Characters | (1) LAI at PI | (2) LAI at heading | (3) CGR at PI | (4) CGR at heading | (5) RGR at PI | (6) RGR at heading | (7) NAR at PI | (8) NAR at heading | (9) GY (t ha−1) | (10) TDM (t ha−1) | (11) HI (%) | (12) Eμ (%) |
| (1) | 1.00 | |||||||||||
| (2) | 0.50 | 1.00 | ||||||||||
| (3) | 0.68** | 0.60* | 1.00 | |||||||||
| (4) | 0.22 | −0.01 | 0.16 | 1.00 | ||||||||
| (5) | −0.78** | −0.16 | −0.23 | −0.11 | 1.00 | |||||||
| (6) | −0.02 | −0.36 | −0.11 | 0.79** | −0.07 | 1.00 | ||||||
| (7) | −0.54 | −0.06 | 0.11 | −0.12 | 0.79** | −0.14 | 1.00 | |||||
| (8) | −0.19 | −0.50 | −0.26 | 0.82** | 0.09 | 0.82** | −0.02 | 1.00 | ||||
| (9) | 0.12 | 0.04 | 0.18 | 0.63* | −0.05 | 0.52 | −0.09 | 0.53 | 1.00 | |||
| (10) | 0.62* | 0.65** | 0.69** | 0.49 | −0.24 | 0.01 | −0.09 | 0.01 | 0.31 | 1.00 | ||
| (11) | −0.41 | −0.57 | −0.42 | 0.11 | 0.15 | 0.49 | 0.01 | 0.46 | 0.54 | −0.62* | 1.00 | |
| (12) | 0.33 | 0.38 | 0.54 | 0.72** | −0.03 | 0.34 | 0.04 | 0.41 | 0.66** | 0.80** | −0.16 | 1.00 |
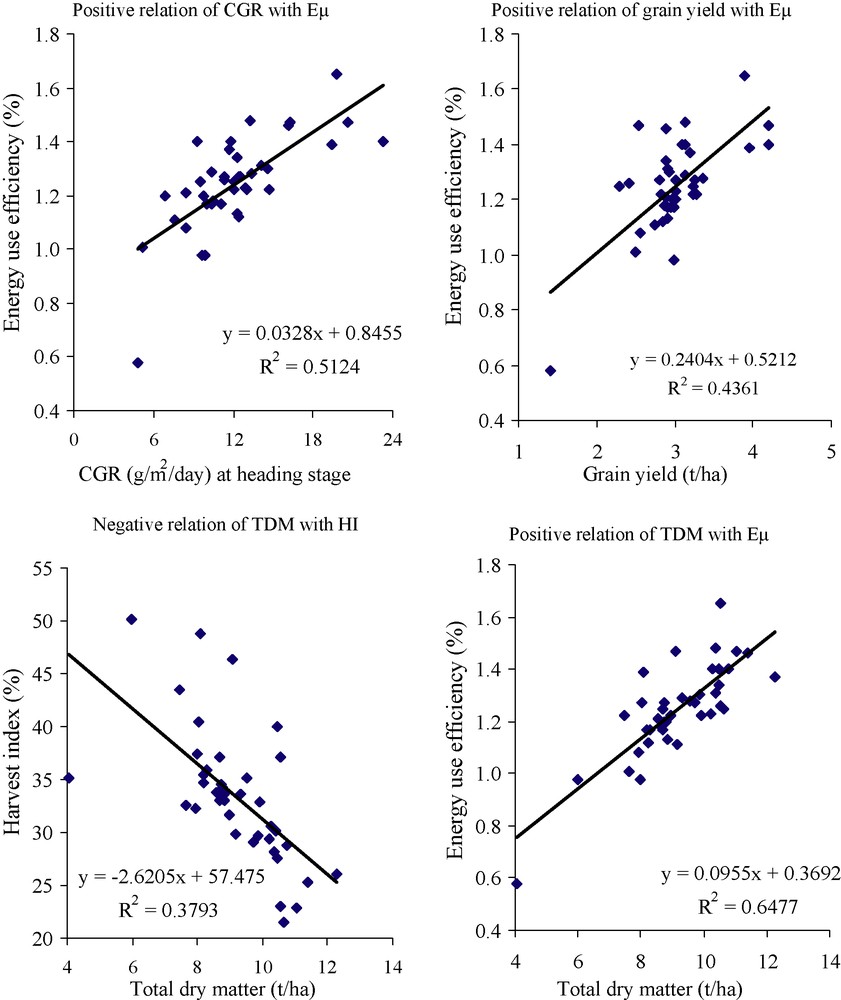
Relationships among growth parameter, yield and energy use efficiency in aromatic rice genotypes.
3.3 Individual effect of growth parameters on biomass production
Most contributing seven parameters were subjected to path analysis where correlation coefficients were partitioned. Direct effects and indirect effects were quantified and presented in Table 4. Net assimilation rate during heading stage was found to have the highest positive direct effect (0.70) on energy use efficiency. Total dry matter yield scored second position (0.64) followed by grain yield (0.29). On the other hand, CGR during heading stage contributed a negative direct effect (−0.36) on Eμ. It is well known that Eμ is a resultant character and very complicated trait. In this analysis it is observed that a considerable portion of effects were unexplained and remained as residual effects (0.34). Kumar and his coworkers made research work with some rice cultivars across different locations in winter season and showed direct and indirect effects of component characters on yield [29].
Direct effects (bold faces on the diagonal) and indirect effects of different characters on Eμ of aromatic rice.
| Characters | 01 | 02 | 03 | 04 | 05 | 06 | 07 | Correlation with Eμ |
| 01. LAI at heading | 0.19 | 0.10 | 0.00 | 0.08 | −0.35 | 0.01 | 0.42 | 0.38 |
| 02. CGR at PI | 0.11 | 0.17 | −0.06 | 0.00 | −0.18 | 0.05 | 0.44 | 0.54 |
| 03. CGR at heading | 0.00 | 0.03 | −0.36 | −0.02 | 0.57 | 0.18 | 0.31 | 0.72 |
| 04. RGR at heading | −0.07 | −0.02 | −0.28 | −0.02 | 0.57 | 0.15 | 0.01 | 0.34 |
| 05. NAR at heading | −0.01 | −0.04 | −0.30 | −0.02 | 0.70 | 0.15 | 0.01 | 0.41 |
| 06. Grain yield | 0.01 | 0.03 | −0.02 | −0.01 | 0.37 | 0.29 | 0.20 | 0.66 |
| 07. Total dry matter | 0.12 | 0.12 | −0.18 | 0.00 | 0.01 | 0.09 | 0.64 | 0.80 |
4 Conclusion
Aromatic rice genotypes hold a large-scale variation for photosynthetic efficiency as well as growth parameters. These variations could be exploited for the improvement of germplasm through breeding programmes. NAR at heading stage might be considered as predicting component of Eμ in aromatic rice.