

1 Introduction
Rice tungro disease (RTD) is one of the most serious diseases of rice in South and Southeast Asia. Plant becomes stunting and green leaves become yellow or yellow-orange discoloration due to this disease. Panicle exertion is delayed and often incomplete, and panicles are short and often sterile. RTD is caused by a rice tungro spherical virus (RTSV) and a rice tungro bacilliform virus (RTBV), which are transmitted by green leafhoppers (GLH), Nephotettix virescens Distant [1]. RTSV is a single-stranded RNA virus, which belongs to the family Sequiviridae, whereas RTBV is a double-stranded DNA virus belonging to the family Caulimoviridae [2]. RTSV plays the role of a helper virus for insect transmission of RTBV. The RTSV alone does not cause any distinctive symptoms, except mild stunting in some rice cultivars. Infection of rice plants with RTBV, however, results in severe symptoms, which are accentuated by co-infection with RTSV [1]. In Bangladesh, tungro was identified first in 1969 [3]. It is one of the major constraints in rice production, particularly in the upland and rain-fed ecosystems [4,5]. It was the severest and most widespread being in 1990 when both upland and rain-fed crops were affected in almost all over the country. Rice plants can be infected by this virus at any growth stage with varying symptoms manifestation and yield loss. The damage is severe when infection takes place at seedling or an early growth stage [6]. In a susceptible variety without any recovery ability, RTD may result in 100% infection and a total yield loss under favorable condition [7].
Several rice germplasm sources resistant to RTD have been used to improve rice cultivars in endemic areas [8], although a distinction between resistance to GLH and to tungro viruses in some rice genotypes is still unclear [9,10]. Some traditional rice cultivars and wild Oryza spp. have been used for the improvement of cultivars resistant to RTD. Matatag 9 is a cultivar developed from the cross between a popular indica rice variety IR64 and the RTD-resistant accession of Oryza rufipogon (105908) [8,9]. Indonesian cv. Utri Merah is a highly resistant to RTSV and tolerant of RTBV [11]. Advanced breeding lines derived from Utri Merah consistently showed low infections with both RTBV and RTSV in several field trials [12]. Kachamota and ARC 11554 were found resistant to tungro in Malaysia and Indonesia. ARC 11554 was found resistant to tungro in many countries [5].
The use of resistant varieties is believed to be the most effective method for controlling rice tungro disease as killing the vector with insecticides to control this disease is not very effective and may cause environmental and health hazards. The resistance of a rice variety to tungro may be due to its resistance to the insect vector or to the virus or to both [13].
Genetic divergence is one of the criteria of parent selection. Knowledge of genetic diversity among plant populations and it quantitative assessment usually helps a breeder in choosing desirable parents for the breeding program as selection of parents on the basis of divergence analysis would be more effective. The recent integration of advances of molecular marker applications with conventional plant breeding practices has created the foundation for molecular plant breeding, an interdisciplinary science that is revolutionizing the 21st century crop improvement [14]. Genetic diversity is essential to meet the diverse goals of plant breeding, such as producing cultivars with increased yield, genetic adoption, desirable quantity, pest and disease resistant [15].
Molecular methods are supporting the classic methods, such as morphological and physiological traits [16] but the advantage of these techniques is their capacity to detect genetic diversity at a higher level of resolution than other methods [17]. For the estimation of genetic diversity, different molecular methods, e.g. restriction fragment length polymorphisms (RFLPs), amplified fragment length polymorphisms (AFLPs), simple sequence repeats (SSRs) and random amplified polymorphic DNA (RAPD) are available and have been applied in many crop species, including rice [18,19].
Previously genetic diversity was mostly computed by measurements of physiological and morphological difference of quantitative and economically important traits but these methods have some disadvantages, such as time consuming and laborious during the measurement. So, this method cannot define the exact level of genetic diversity among germplasm because the trait appear by interaction between genes and environment [20]. Therefore, morphological traits along with molecular markers have great importance to a rice breeder to assess genetic diversity of rice genotypes. Present studies were undertaken to know the genetic diversity based on phenotypic traits and molecular markers in tungro resistant genotypes and also to know inheritance patterns of SSR and ISSR markers in F2 populations.
2 Materials and methods
2.1 Morphological relationship of tungro resistant genotypes
2.1.1 Experimental site
The studies were conducted at the experimental field and laboratory of Plant Pathology Division, Bangladesh Rice Research Institute (BRRI), Gazipur, during the period of 2006–2007.
2.1.2 Genotypes
A total of 14, including six highly resistant, three resistant, three moderately resistant and two susceptible genotypes, were used in this study (Table 1). The seeds for all the genotypes were obtained from Genetic Resources and Seed Division, BRRI, Gazipur, Bangladesh.
List of tungro resistant and susceptible rice genotypes.
| Serial no. | Variety | Type |
| 1. | BR10 | Susceptible |
| 2. | BR 11 | Susceptible |
| 3. | BRRI dhan 31 | Moderate resistant |
| 4. | BRRI dhan 32 | Moderate resistant |
| 5. | BRRI dhan 44 | Moderate resistant |
| 6. | Sonahidemota | Highly resistant |
| 7. | Khaiyamota | Highly resistant |
| 8. | Khairymota | Highly resistant |
| 9. | Nakuchimota | Highly resistant |
| 10. | Kachamota | Highly resistant |
| 11. | Kumragoir | Highly resistant |
| 12. | Bazail Accession no. 252 | Resistant |
| 13. | Bazail Accession no. 171 | Resistant |
| 14. | Rayeda Accession no. 4849 | Resistant |
2.1.3 Germination of seed and seedling transplantation
The seeds of all collected rice genotypes were soaked separately for 48 h in cloth's bag. The soaked seeds were picked out from water and wrapped with straw and gunny bag to increase the temperature for facilitating germination. The seedlings of 14 genotypes were raised in pots.
2.1.4 Data used for phenotypic studies
Thirty-day-old seedlings were transplanted in the field. Recommended doses of fertilizers and cultural practices were done as recommended by Latif et al. [21]. Data were recorded on quantitative characters namely, plant height (cm), number of tiller per hill, tillering ability, phenotypic acceptability, days to flowering, days to maturity, panicle length (cm), number of spikelet per panicle, number of filled grain per panicle, number of unfilled grain per panicle, 1000 grain weight (g), yield per hill (g) and disease index.
2.1.5 Phenotypic data analysis
Means data of the characters were analyzed by multivariate analysis using GENSTAT 5.13 software program (copyright 1987, Lawes Agricultural Trust, Rothamasted Experimental Station, UK). Genetic diversity analysis involves several steps, i.e., estimation of distance between the varieties clustering and analysis of inter-cluster distance. Therefore, more than one multivariate technique is required to represent the results more clearly and it is obvious from the results of many researches [22]. Mean data for each character was subjected to use for Principal component analysis (PCA), Principal coordinate analysis (PCoA) and Canonical vector analysis (CVA).
2.1.6 Computation of average intra-cluster distances
The average intra-cluster distance for each cluster was calculated by taking all possible D2 values within the members of a cluster obtained from PCoA. The formula used to measure the average intra-cluster distance was:
2.2 Molecular relationship of tungro resistant genotypes
2.2.1 Selection of markers
A total of 13, including 10 simple sequence repeats (SSR) and three inter-simple sequence repeat (ISSR) markers produced polymorphic bands. Only these markers were scored among tungro resistant and susceptible genotypes for further analysis (Table 2).
SSR and ISSR markers used in the present study.
| Markers | Oligonucleotide sequence |
| SSR | |
| RM11 | TCTCCTCTTCCCCCGATC-F ATAGCGGGCGAGGCTTAG-R |
| RM17 | TGCCCTGTTATTTTCTTCTCTC-F GGTGATCCTTTCCCATTTCA-R |
| RM20 | ATCTTGTCCCTGCAGGTCAT-F GAAACAGAGGCACATTTCATTG-R |
| RM21 | ACAGTATTCCGTAGGCACGG-F GCTCCATGAGGGTGGTAGAG-R |
| RM23 | CATTGGAGTGGAGGCTGG-F GTCAGGCTTCTGCCATTCTC-R |
| RM80 | CATCAACCTCGTCTTCACCG-F TTGAAGGCGCTGAAGGAG-R |
| RM108 | CGTGCACCACCACCACCACCAC-F TCTCTTGCGCGCACACTGGCAC-R |
| RM222 | CAAAGCTTCCGGCCAAAAG-F CTTAAATGGGCCACATGCG-R |
| RM443 | GCGAAGCCCAATCTGAAGAAGC-F CCAGTCCCAGAATGTCGTTTCG-R |
| RM531 | GTTCCCACTCATAGTAAACCGATACG-F CACGTTTCCTTCTTCAGATCATGG-R |
| ISSR | |
| RY | CAGCAGCAGCAGCAG |
| MR | GAGGGTGGCGGTTCT |
| GF | TCCTCCTCCTCCTCC |
2.2.2 DNA extraction
To extract genomic DNA, young and fresh leaves were collected from different pots of 14 varieties. Genomic DNA from each genotype was isolated from fresh leaf tissue of 21 day-old plants. One gram of fresh leaves was taken from the plant, cut into small pieces (about 0.5 cm), and wrapped in aluminium foil and quickly placed in freezer at −20 °C. Samples were kept in freezer for 1 h. Leaves were ground to powder by a pestle and mortar that had been pre-cooled to −20 °C. Approximately, 200 mg of powdered leaf was put into each micro-centrifuge tube (about 1/3 full) and was replaced into freezer until further use. All tubes were taken from the freezer and quickly added 800 μL of extraction buffer into each. The tubes were mixed thoroughly and then placed in 65 °C water bath for 10–15 min mixing by inversion every few minutes. The tubes were centrifuged at 13,000 rpm for 5 min. Supernatant was taken to fresh tube with 500 μL of chloroform, mixed well and spun 13,000 rpm for 5 min. Aqueous layer was transferred to new tube (careful to avoid interface). To each tube one volume of isopropanol and 0.1 volume of 3 M sodium acetate (pH 5.2) was added and mixed by inversion. Tubes were kept on ice up to 30 min and spun at 13,000 rpm for 5 min. After that, the supernatant was removed from the tubes. DNA was washed in 400 μL 70% ethanol and air dried for 15 min. Again DNA was resuspended in 150 μL TE buffer, depending on pellet size.
2.2.3 PCR protocols
The following polymerase chain reaction (PCR) components were used per reaction (15.0 μL volume) for SSR analysis: 18 ng of DNA template (1 μL), 0.3 μL of 5 U/uL Taq polymerase enzyme, 0.7 μL of 5 μM primers, 0.3 μL of 0.2 mM dNTPs, 1.5 μL of 1 × PCR buffer (200 mM Tris–HCl, 500 mM KCl, Gelatin 0.01% and H20), 1.8 μL of 3 mM MgCl2 and 6.7 μL nano-pure sterilized H2O. PCR was initiated by a denaturation step at 94 °C for 5 min, then, the reaction was subjected to 35 cycles of 94 °C for 30 sec, 55 °C for 1 min, 72 °C for 1 min with a final extension step of 7 min at 72 °C. PCR protocols for ISSR were followed as described by Latif et al. [23].
The amplification products were resolved by agarose (2%) and polyacrylamide (8%) gel electrophoresis using in TBE buffer. Each gel was run for 2–3.5 h at 100 volts. Gels were stained in ethidium bromide and visualized under UV light.
2.2.4 Molecular data analysis
Molecular weight for each band was measured by using Alfa Imager software version 5.5. SSR marker alleles and ISSR marker loci were scored as present (1) or absent (0). Pair wise comparisons between genotypes were calculated using the Nei's genetic distance, using the program Free Tree [24]. A dendrogram representing the genetic relationships between genotypes, based on the un-weighted pair group method with arithmetic averages (UPGMA), was constructed using the web-based version of the Drawgram program, which is part of the Phylogeny Inference Package (PHYLIP 3.5). To determine the correlation between two similarity matrices of morphological traits and molecular data, Mantel test was performed using NTSYS-Pc software.
2.3 Inheritance studies of F2 population
A total of 260 progenies of F2 generation were derived from a cross between a local rice variety, Sonahidemota (highly resistant variety), and a susceptible rice cultivar, BR11. The Mendelian inheritance studies of ISSR and SSR markers were examined by analysis of the banding patterns of the family. Segregation data was analyzed with a chi-square (χ2) test using a probability level of 0.05. Chi-square analysis for the genotypic ratio was calculated by using the formula, χ2 = (O-E)2 / E, where for O is an observed value, and E is expected value.
3 Results and discussion
3.1 Morphological relationship of tungro resistant genotypes
The results of the genetic diversity of 14 tungro resistant and susceptible rice genotypes based on morphological characters are represented in Tables 3 to 5 and Fig. 1.
Average intra- (Diagonal) and inter-cluster distances (D2) for 14 tungro resistant genotypes.
| Cluster | I. | II. | III. | IV. | V. | VI. |
| I. | 0.830 | |||||
| II. | 7.456 | 0.661 | ||||
| III. | 18.898 | 17.490 | 1.992 | |||
| IV. | 16.254 | 13.422 | 9.412 | 1.544 | ||
| V. | 16.063 | 16.535 | 5.126 | 9.883 | 1.719 | |
| VI. | 18.693 | 15.872 | 7.019 | 4.434 | 9.355 | 1.20 |
Cluster mean for 13 characters of 14 tungro resistant and susceptible rice genotypes.
| Characters | I | II | III | IV | V | VI |
| Number of tiller per hill | 13.00 | 19.00 | 8.33 | 13.00 | 10.00 | 10.00 |
| Tillering ability | 5.00 | 5.00 | 7.00 | 5.00 | 5.00 | 6.33 |
| Plant height | 123.50 | 118.66 | 172.47 | 149.20 | 154.90 | 173.50 |
| Phenotypic acceptability | 2.00 | 1.67 | 6.33 | 5.00 | 7.00 | 7.00 |
| Days to flowering | 97.00 | 101.00 | 111.00 | 115.00 | 110.00 | 109.00 |
| Days to maturity | 136.00 | 137.00 | 160.00 | 153.00 | 177.00 | 137.67 |
| Panicle length | 25.64 | 24.25 | 24.10 | 23.80 | 24.83 | 26.00 |
| Number of spikelet per panicle | 165.32 | 128.32 | 77.48 | 84.95 | 86.65 | 80.32 |
| Number of filled grain per panicle | 141.40 | 114.03 | 73.77 | 71.80 | 78.50 | 48.30 |
| No. of unfilled grain per panicle | 18.60 | 17.36 | 26.50 | 30.60 | 27.00 | 28.73 |
| 1000 grain weight | 24.03 | 22.71 | 30.66 | 29.10 | 32.45 | 20.13 |
| Yield | 43.99 | 41.33 | 32.80 | 30.80 | 34.80 | 31.09 |
| Disease index | 6.50 | 5.67 | 1.00 | 1.00 | 1.00 | 3.00 |
Latent vector for 13 characters of 14 tungro resistant and susceptible rice genotypes.
| Characters | Vector 1 | Vector 2 |
| Number of tiller per hill | −0.2610 | −1.3223 |
| Tillering ability | 0.0635 | −0.0847 |
| Plant height | 0.1344 | 0.0178 |
| Phenotypic acceptability | −0.1393 | 0.4370 |
| Days to flowering | 0.0263 | 0.1450 |
| Days to maturity | 0.0556 | 0.1225 |
| Panicle length | 0.2438 | 0.6120 |
| Number of spikelet per panicle | 0.0066 | 0.0954 |
| Number of filled grain per panicle | −0.0746 | 0.0985 |
| Number of unfilled grain per panicle | 0.1322 | 0.0978 |
| 1000 grain weight | 0.0075 | −0.1482 |
| Yield | 0.0631 | 0.3510 |
| Disease index | −0.8352 | −0.9752 |
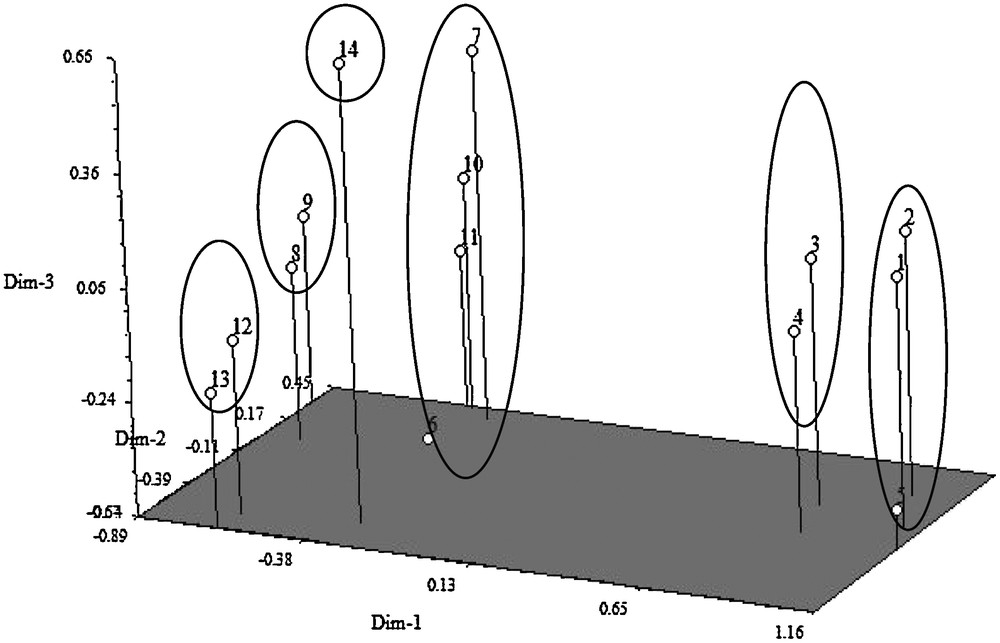
Three-dimensional graph showing genetic relationship between tungro resistant and susceptible rice genotypes (BR10: 1; BR11: 2; BRRI dhan31: 3 BRRI dhan32: 4; BRRI dhan44: 5; Sonahidemota: 6; Khaiyamota: 7; Khairymota: 8; Nakuchimota: 9; Kachamota: 10; Kumragoir: 11; Bazail Accession no. 252: 12; Bazail Accession no. 171: 13; Rayeda Accession no. 4849: 14).
3.1.1 Principal component analysis
The principal component analysis yielded Eigen values of each principal component axis of ordination of genotypes. All the axes totally accounted for the variation among the genotypes, while four of these with eigen values above unity accounted for 90.68%. The first two principal exes accounted for 75% of the total variation among the 13 characters describing 14 tungro resistant and susceptible rice genotypes (Table S1, in the Supplementary material).
3.1.2 Construction of 3-dimentional graph
Based on the values of principal components, a three dimensional graph was constructed, which was presented on Fig. 1. The positions of the genotypes in the graph were apparently distributed into six groups, which indicated that there was considerable diversity existed among the genotypes. The graph for tungro resistant and susceptible rice genotypes of different clusters revealed that the genotypes number Rayeda Accession no. 4849, Bazail Accession no. 171, Bazail Accession no. 252, Kumragoir, Kachamota, Nakuchimota, Khairymota, Khaiyamota and Sonahidemota, were distantly located that suggesting more diverged from rest of the genotypes.
3.1.3 Principal co-ordinate analysis
Principal coordinate analysis (PCoA) was performed on auxiliary of principal component analysis. This analysis helped in estimating distances (D2) for all possible combinations between pairs of genotypes. The intra-cluster distances were computed by the values of inter genotypic distance matrix of PCoA, according to Singh and Chaudhary [25]. There were not marked variations in intra-cluster distances, which ranged from 0.661 to 1.992 (Table 3). The magnitudes of the intra-cluster distances were not always proportional to the number of genotypes in the clusters. In the present study, it was found that clusters II, III and VI were composed of higher number of genotypes. The intra-cluster distances in all the six clusters were more or less low indicated the genotypes within the same cluster were closely related. The highest intra-cluster distance was computed for cluster III (1.992) composed of three genotypes followed by the cluster V (1.719) composed of 2 genotypes. The lowest intra-cluster distance was in cluster II (0.661) followed by the cluster I (0.831) consisting of 3 and 2, respectively. However, the higher value (1.992) of intra-cluster distance in cluster III indicated that the genotypes constituted this cluster might have diverged characters, which contributed to the formation of this cluster (Table 3).
The inter-cluster distances were bigger than the intra-cluster distances suggesting wider genetic diversity among the genotype of different clusters. Anandan et al. [26] obtained larger inter cluster distances than the intra-cluster distances in a multivariate analysis in rice. The inter-cluster distance was maximum between cluster I and III (18.898) followed by the distance between cluster I and VI (18.693), cluster II and III (17.490) while the distance was minimum between cluster VI and IV (4.434) followed by the distance between cluster V and III (5.126). The maximum values of inter-cluster distance indicated that the genotypes belonging to cluster I and III was far diverged from those of clusters VI and III (Table 3). These relationships were also reflected in the scatter diagram (Fig. 1).
3.1.4 Intra-cluster mean
Intra-cluster mean for 13 characters are presented in Table 4. The inter-cluster distances of cluster I and III was higher than the inter-cluster distances between the remaining cluster combinations (Table 3). The cluster mean of these two clusters for all the 13 characters were also divergent. These indicated that the genotypes included in cluster I and III were very important to contribute into the total divergence among 14 tungro resistant and susceptible genotypes for these characters.
The lowest and the highest cluster means for different characters in cluster I indicated the genotypes included in this cluster would offer good scope for improvement of rice through rational selection for these characters. The lowest cluster mean for days to flowering and days to maturity indicated that the genotypes in this cluster could be used to improve short duration variety. The highest value for number of spikelet per panicle, number of filled grain per panicle and yield revealed that the genotypes in this cluster could be used to improve high yielding variety. The genotypes of cluster III gave the higher mean for plant height, days to flowering, days to maturity and number of unfilled grain per panicle. The lower mean was observed in number of tiller per hill and disease index. The result indicated that the genotypes in these cluster could be used to develop tungro resistant varieties.
3.1.5 Canonical vector analysis
The contribution of characters towards divergence was obtained by CVA is presented in Table 5. The values of vectors had positive for plant height, days to flowering, days to maturity, panicle length, number of spikelet per panicle, number of unfilled grain per panicle and yield. These results indicated that seven characters had the highest contribution towards the divergence among the 14 tungro resistant and susceptible genotypes.
From the above results, it appeared that the contribution of panicle length was the highest followed by plant height, number of unfilled grain per panicle, tillering ability, yield, days to maturity, 1000 grain wt., number of spikelet per panicle to the total divergence in 14 genotypes. Ahmed et al. [27] reported that the contribution of grain length was the highest followed by days to 50% flowering, grains per panicle and grain yield per hill to the total divergence in irrigated rice. Choudhury et al. [28] also found that earliness, plant height, tiller number, grain size, and yield contribute the highest for genetic divergence. Days to 50% flowering, 1000 grain wt. and plant height exhibited the largest contribution to the total divergence reported by Zaman et al. [29]. Days to flowering, plant height, ear head length and grain weight contributed highly towards the genetic divergence among the sorghum genotypes studied [30]. The characters contributing maximum to the divergence are given greater emphasis for deciding on the cluster for the purpose of further selection and the choice of parents for hybridization [23,30,31].
3.1.6 Comparison of result based on different multivariate techniques
The results obtained from different multivariate techniques concluded that all techniques gave more or less similar results and one technique supplemented and confirmed the results of the other. However, the distribution of genotypes in different clusters of the D2 analysis had followed more or less similar trend of the principal component analysis. The D2 and principal component analysis were found to be alternative methods in giving the information regarding the clustering pattern of genotypes. Nevertheless, the CVA provided the information regarding the contribution of characters towards divergence of 14 tungro resistant and susceptible rice genotypes.
3.2 Molecular relationship of tungro resistant genotypes
Gels scoring of 13 markers (SSR and ISSR) were done. Fig. 2 showed banding patterns of resistant and susceptible varieties of tungro resistant genotypes. Figs. S1 and S2 also showed two gel pictures of SSR and ISSR markers. Each SSR marker's allele and different loci of ISSR were measured and are presented in supplementary Table S2.
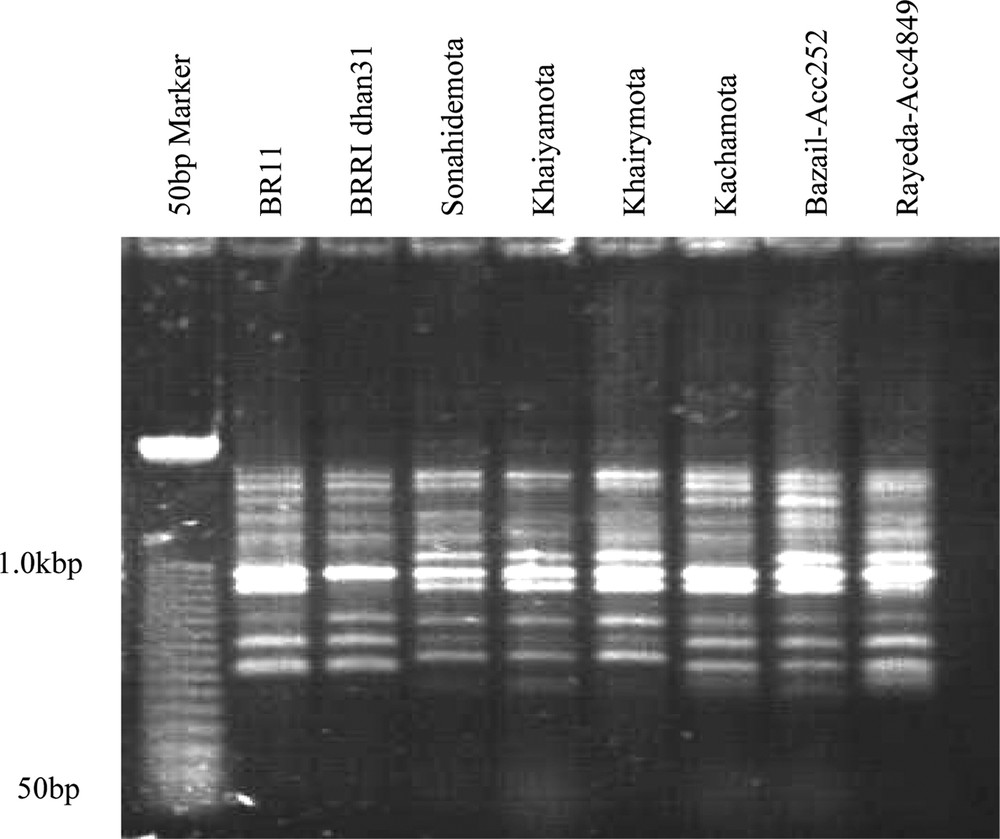
Inter-simple sequence repeat banding patterns obtained from tungro resistant and susceptible rice genotypes using MR primer.
3.2.1 Genetic diversity of tungro resistant genotypes based on cluster analysis
For diversity analysis, pair wise genetic distances were computed between all genotypes. Genetic distance was the smallest between BRRI dhan31 and BRRI dhan32 (0.0909), BRRI dhan31 and BRRI dhan44 (0.0909), Khaiyamota and Kumragoir (0.0909) followed by Khairymota and Nakuchiomota (0.1111), BRRI dhan32 and BRRI dhan44 (0.1818), Khaiyamota and Sonahidemota (0.2000), Kumragoir and Sonahidemota (0.2000) and Khaiyamota and Khairymota (0.2222) (Table 3S). These results suggested that pairwise varieties might have been developed from common ancestors. On the other hand, genetic distance was the highest between BR11 and Sonahidemota (0.6500), followed by BR10 and Sonahidemota (0.6400), BR11 and Khaiyamota (0.6350), BR10 and Khaiyamota (0.6340), BR11 and Kumragoir (0.6330), BR10 and Kumragoir (0.6300), BR10 and Bazail-Acc252 (0.5900) and BR11 and Bazail-Acc252 (0.5800).
Cluster analysis demonstrated the genetic relationship among the 14 genotypes, including tungro resistant and susceptible genotypes. Dendrogram, resolved the genotypes into seven clusters (Fig. 3). The first cluster consisted of three genotypes namely Kumragoir, Khaiyamota and Bazail-Acc252. The second cluster consisted of only one genotype, Sonahidemota while third cluster consisted of Kachamota. Khairymota and Nakuchimota were grouped into fourth cluster while moderately resistant genotypes, BRRI dhan31, BRRI dhan32 and BRRI dhan44 were grouped into fifth cluster. Although the highly resistant tungro genotypes, Nakuchimota, Khairymota, Kachamota, Kumragoir, Khaiyamota and Sonahidemota were grouped into four sub-clusters but they were closely related clusters. The tungro resistant genotypes Bazail-Acc171 and Rayeda-Acc4849 were grouped into sixth cluster while susceptible genotypes BR11 and BR10 were grouped into seventh cluster. The varieties BR10 and BR11 were genetically similar but tungro susceptible varieties. The genotypes belonging to the distant clusters, could be used in the hybridization program for obtaining a wide spectrum of variation among the segregates. Similar reports were also made by several authors [23,31–33].
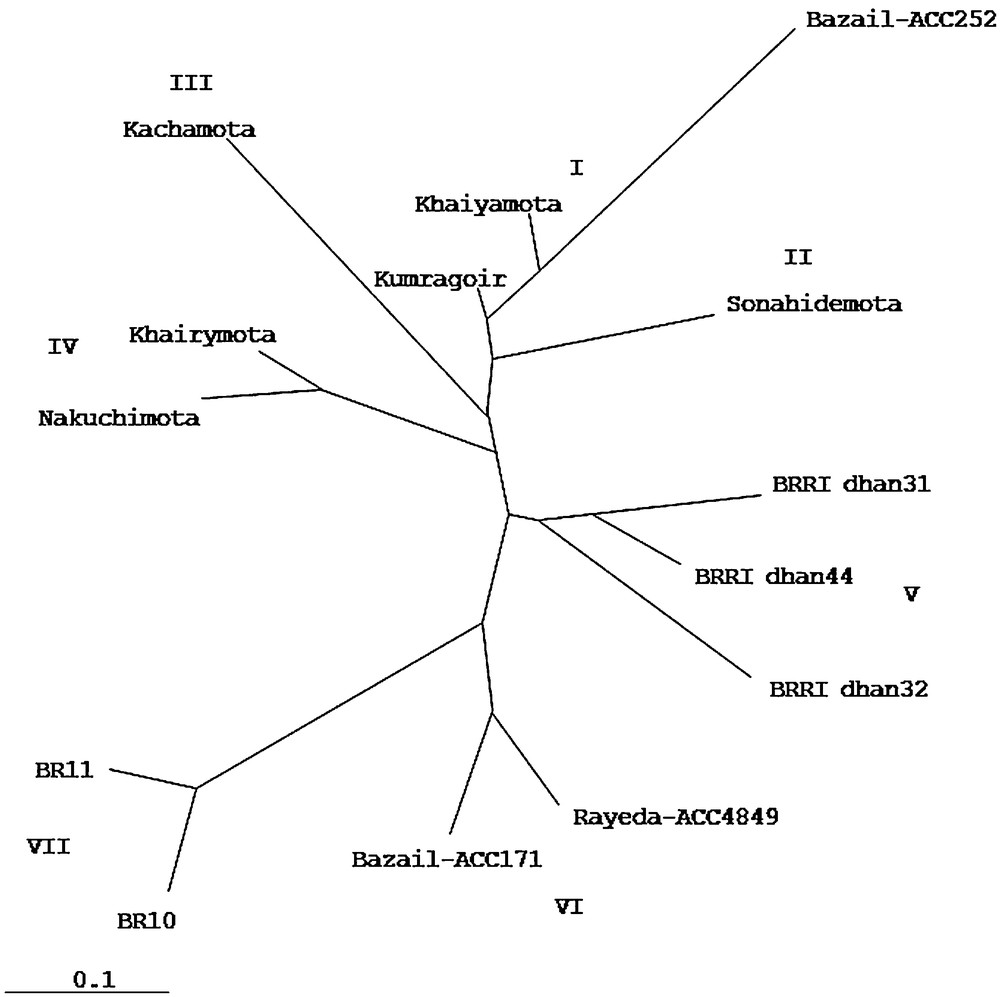
Dendrogram of genetic relationship of 14 tungro resistant and susceptible rice genotypes.
3.2.2 Correlation between morphological traits and molecular data
The coefficient of correlation between the distance matrices of morphological and molecular data was higher and highly significant (r = 0.834, P = 0.0491*). So, Mantel's test revealed a significant correlation between the morphological and molecular data in their ability to detect genetic relationships among the genotypes. Our findings are in agreements with results of Wang et al. [34] and Sestili et al. [35].
3.2.3 Selection of genotypes for future hybridization program
Genotype was to be selected on the basis of a specific objective. The objective of this study is to develop high yielding but rice tungro virus resistant varieties. Considering the magnitude of genetic distance, contribution of different characters towards the total divergence, magnitude of genetic cluster means for different characters and performance of the genotypes were considered for hybridization program. Therefore, based on our morphological traits and molecular data analyses, genotypes BR10 and BR11 could be selected for higher yield but they were susceptible while Sonahidemota, Kumragoir, Nakuchimota, Khaiyamota, Khairymota and Kachamota could be selected as highly resistant genotypes to tungro virus. Hybridization could be made between high yielding rice genotypes (BR10 and BR11) and highly tungro resistant genotypes as they were appeared in distant clusters. Genetically distant parents are able to produce higher heterosis, which was reported by Debnath et al. [36] and Mahmuda et al. [37].
3.3 Inheritance studies of F2 population
3.3.1 SSR markers survey of parents and F2 population
Among the SSR and ISSR markers, the 18 polymorphic markers were evaluated on 260 F2 progenies derived from BR11 × Sonahidemota. The patterns of all the markers varied in the segregating population.
3.3.2 Markers segregation data analysis
The alleles and loci of SSR and ISSR respectively, were scored based on the parental bands that were amplified as controls along with the F2 individuals. The Chi-square (χ2) analysis for seven SSR alleles (RM11, RM17, RM20, RM23, RM80, RM108 and RM531) and five ISSR loci (RY1, MR1, MR2, MR4 and GF5) showed a good fit to the expected segregation ratio (1:2:1) for a single gene model (df = 2.0, P < 0.05). The rest of the markers did not fit the expected segregating Mendelian ratios (Table 6). In the segregation analysis, 12 polymorphic markers clearly showed goodness of fit to the expected segregation ratio for the single gene model. Our results of inheritance study of SSR and ISSR markers in tungro resistance are in agreement with the findings of Sharma et al. [38] and Ashkani et al. [39] in blast disease resistance. Sharma et al. [38] reported the inheritance studies to determine genetic control of blast resistance in a cross involving the resistant (R) and the susceptible (S) cultivar. The F2 population segregated into 3R:1S, indicating that blast resistance, was governed by a single dominant gene. This was also confirmed by the segregation patterns in the F3 and F4 generations. Latif et al. [40] reported in their segregation analysis of RAPD markers in brown planthopper population and all the markers were inherited in a simple Mendelian fashion.
Marker analysis in F2 lines derived from the cross between rice varieties BR11 × Sonahidemota.
| Markers | Chromosomes | Marker analyzed | χ2 (1:2:1) |
Probability | ||
| RR = R | Rr = SG | rr = S | ||||
| RM11 | 7 | 72 | 115 | 73 | 3.47 | 0.1764 |
| RM17 | 12 | 56 | 135 | 69 | 1.68 | 0.4317 |
| RM20 | 12 | 66 | 118 | 76 | 2.98 | 0.2254 |
| RM23 | 1 | 73 | 116 | 71 | 3.05 | 0.2176 |
| RM80 | 8 | 67 | 123 | 70 | 0.82 | 0.6637 |
| RM108 | 11 | 70 | 130 | 60 | 0.77 | 0.6805 |
| RM222 | 10 | 46 | 140 | 74 | 7.57a | 0.0227 |
| RM443 | 1 | 86 | 124 | 50 | 10.52b | 0.0052 |
| RM531 | 8 | 60 | 134 | 66 | 0.52 | 0.7711 |
| RY1 | – | 55 | 134 | 71 | 2.22 | 0.3296 |
| MR1 | – | 69 | 117 | 74 | 2.79 | 0.2478 |
| MR2 | – | 69 | 120 | 71 | 1.57 | 0.4561 |
| MR4 | – | 56 | 136 | 68 | 1.66 | 0.436 |
| GF2 | – | 84 | 124 | 52 | 8.43a | 0.0148 |
| GF3 | – | 48 | 139 | 73 | 6.05a | 0.0486 |
| GF5 | – | 70 | 124 | 66 | 0.68 | 0.7118 |
| GF6 | – | 84 | 139 | 37 | 18.24b | 0.0001 |
a 0.05 significance level.
b 0.01 significance level.
4 Conclusion
Our results concluded that both morphological traits and molecular markers were useful for diversity analysis for tungro resistant genotypes. In Mantel test, morphological traits were highly correlated (r = 0.834*) with molecular data. In order to the development of high yielding tungro resistant varieties based on both morphological and molecular analyses, crosses could be done with susceptible (BR10 and BR11) genotypes with local low yielding but highly tungro resistant genotypes, Sonahidemota, Kumragoir, Nakuchimota, Khaiyamota, Khairymota and Kachamota. The chi-square (χ2) analysis for seven SSR alleles and five ISSR loci, showed a good fit to the expected segregation ratio (1:2:1) for a single gene model. The rest of the markers did not fit the expected segregating Mendelian ratios.
Disclosure of interest
The authors declare that they have no conflicts of interest concerning this article.
Acknowledgements
The authors greatly acknowledge the authorities of Bangladesh Rice Research Institute (BRRI) and Universiti Putra Malaysia (UPM) for providing research facilities and financial support.