

1 Introduction
For a full understanding of human evolutionary biology a broad-based, comparative primatological perspective is indispensable [1]: comparative studies permit the recognition of generally valid principles that cannot be identified through the study of a single species (Homo sapiens) or a small group of species (e.g. humans and great apes) and recognition of such general principles obviates the special pleading that so often characterises narrow approaches to human evolution. However, in order to allow such comparisons to be meaningful a proper understanding of the ‘true’ phylogeny and what comprise basal taxa (i.e. species) is essential. While one would expect that there would be a broad consensus, at least among primatologists, what comprises a primate species and, roughly, how many extant species of primates there are, the number of described species of primates has doubled in the last two decades [2,3]. This is in part driven by better sampling of taxa [e.g. 4], changing perceptions on what comprises a species [5–7] and increasingly the use of DNA sequence diversity to identify species.
Analysis of sequence diversity in mitochondrial genes (mtDNA) has contributed tremendously to the understanding of relationships of species and closely related taxa in various groups of eukaryotes. The choice of a suitable gene with high phylogenetic resolution will be more crucial when evaluating species delimitation of recently diverged species. MtDNA, with rapid pace of sequence changes, regularly shows pronounced divergences between closely related species [8]. Because different parts of the mtDNA genome evolve at different mutation rates [9] deciding which gene to use to resolve the divergence within a group remains an important issue in phylogenetics [8,10,11]. For the goals of species identification in animals, the cytochrome c oxidase subunit 1 (cox1) has been introduced as standard marker. Cox1 could serve as a fast and accurate marker for the identification of animal species, and for the discovery of new species across the tree of life [12], a procedure for which the term DNA barcoding has been coined [13; for a recent review see 14].
Hebert et al. [15] investigated sequence variation of 25% of the species of North American breeding birds. Variation of cox1 sequences within species was an average of 20 times smaller than between species, and there was a clear gap between intra- and interspecific variation. Utilising this barcoding gap, Hebert et al. [15] proposed a standard sequence threshold to define species boundaries of around 10 times the mean intraspecific variation for the group under study. This cox1 barcoding gap has repeatedly been found in a range of other animal taxa [15–18].
Besides the cox1 gene, other mitochondrial markers also have been widely sequenced across vertebrates. Vences et al. [19] and Gérard et al. [20] suggested the use of the 16S ribosomal RNA gene (16S) to complement cox1 as DNA barcoding marker. Another protein coding gene, cytochrome b (cob), has also been suggested as a marker to determine species boundaries [21–25].
The use of DNA barcodes in primatology has been explored by Hajibabaei et al. [26] and Lorenz et al. [27]. Both focussed on cox1 sequences, and included 28 species (703 sequences; 648 belonging to humans) and 56 species (225 sequences) in their analysis, respectively. In general, the DNA barcodes provided enough information to identify and delineate primate species, but misnaming or misidentification in GenBank did occur. We expand on these analyses by comparing the performance of cox1 with two other genes (cob, 16S) in delineating primate species, in particular by focussing on the presence or absence of the barcoding gap. For those species where multiple sequences are available we compare the genetic intraspecific variation within these three marker genes.
2 Materials and methods
2.1 Data acquisition
We obtained cox1, cob and 16S sequences from GenBank (as available on 30 July 2007). Sequences were included provided they had a length of greater than 589 base pairs (cox1), greater than 1118 bp (cob) and greater than 531 bp (16S) homologous to other sequences, with no more than 50 ambiguous or missing nucleotides [cf. 28].
All sequences were aligned using Muscle, a multiple-alignment software for protein and nucleotide sequences which allows multiple sequence comparison by log-expectation [29]. Probably erroneous sequences (with highly unlikely positions or extreme branch lengths, based on a neighbour-joining tree calculated with all sequences) were identified by eye and omitted. For all three genes human was the species with the largest number of sequences; for each dataset we limit the number of human sequences in our dataset by including only as many sequences as the next most abundant species. Taxa are included at the species-level, and by default we had to employ a conservative taxonomy; some of the taxa are included in GenBank at the sub-specific level, others are listed under the nominal subspecies, and yet others are classed as different species. For example, the orangutan may comprise two species, the Bornean orangutan (Pongo pygmaeus) and the Sumatran orangutan (P. abelii), but many of the latter are included in GenBank as P. pygmaeus, and hence, orangutans are included in our database as a single species. A total of 166 sequences (50 nominal species) were kept for cox1, 412 (92 species) for 16S, and 547 (72 species) for cob.
2.2 Data analysis
Genetic distances were calculated to quantify sequence divergences among individuals using Kimura's [30] two-parameter (K2P) models, theta, as implemented in MEGA 3.1 [31]. The K2P distance is the most effective model when genetic distances are low [12]. Interspecific K2P distances were calculated for those species with at least two sequences, and intraspecific K2P distances were calculated between species in the entire data set.
To calculate intra- and interspecific pairwise distances, based on output matrix of MEGA 3.1, we wrote a converter program (SPD 1.1) in C language. A regression analysis was employed to assess the effect of sample size on intraspecific divergences for each gene using SPSS for Windows, version 11. For seven species for which at least 3 cox1 sequences were available, in addition to at least 3 sequences of one of the other two genes, we calculated the variance in intraspecific divergences, and compared these between genes. All tests are parametric and data where log-transformed when deemed necessary as to approach a normal distribution more closely; we assumed differences to be statistically significant when p < 0.05 in a two-tailed test.
3 Results
3.1 Intraspecific variation
Compared to 16S intraspecific variation in cox1 is significantly larger in four species (Gorilla gorilla, Pan paniscus, P. troglodytes, Pongo pygmaeus; t-test, F > 19.1, p < 0.001 for all comparisons), but significantly smaller in one (Homo sapiens, t-test F = 24.8, p < 0.001) (Table 1). For one species (Hylobates lar) there was no difference in intraspecific variation between these two genes. Compared to cob intraspecific variation in cox1 is significantly larger in one species (Lemur catta, t-test F = 157.0, p = 0.005), but significantly smaller in two (H. sapiens, P. troglodytes, t-test F > 44.0, p < 0.001).
Average intraspecific K2P distances (% ± 1 standard deviation) in three mitochondrial genes, for species for which greater than 3 cox1 sequences are available. Intraspecific distances differ significantly (p < 0.005) between cox1 and cob and cox1 and 16S for all but Hylobates lar.
| Species | cox1 | 16S | cob |
| Humans Homo sapiens | 0.10 ± 0.01 (n = 74) | 1.99 ± 0.15 (n = 94) | 3.67 ± 0.22 (n = 104) |
| Common chimpanzee Pan troglodytes | 0.99 ± 0.62 (n = 10) | 0.20 ± 0.25 (n = 39) | 1.93 ± 1.17 (n = 15) |
| Bonobo Pan paniscus | 1.09 ± 0.65 (n = 6) | 0.21 ± 0.10 (n = 15) | |
| Gorilla Gorilla gorilla | 0.53 ± 0.32 (n = 7) | 0.09 ± 0.10 (n = 14) | |
| Orangutan Pongo pygmaeus | 5.09 ± 4.40 (n = 3) | 1.41 ± 1.50 (n = 90) | |
| White-handed gibbon Hylobates lar | 0.11 ± 0.10 (n = 3) | 0.38 ± 0.31 (n = 6) | |
| Ring-tailed lemur Lemur catta | 0.57 ± 0.62 (n = 4) | 0.26 ± 0.13 (n = 10) |
3.2 Barcoding gap – comparing intra- and interspecific variation
For none of the three genes was mean divergence within species significantly related to the sample sizes per species (cox1: R2 = 0.001, p = 0.97, 16S: R2 = 0.002, p = 0.80, cob: R2 = 0.01, p = 0.42). In general, intraspecific K2P distances for the three genes ranged from zero to 8.5% (cox1: 0–7.6%, 16S: 0–3.6%, and cob: 0–8.5%).
As apparent in Fig. 1 a wide gap exist between intra- and interspecific divergences for both cox1 and cob genes if all taxa within genera are compared, whereas this gap is less apparent for 16S. The gap is more pronounced in cob than it is in cox1.
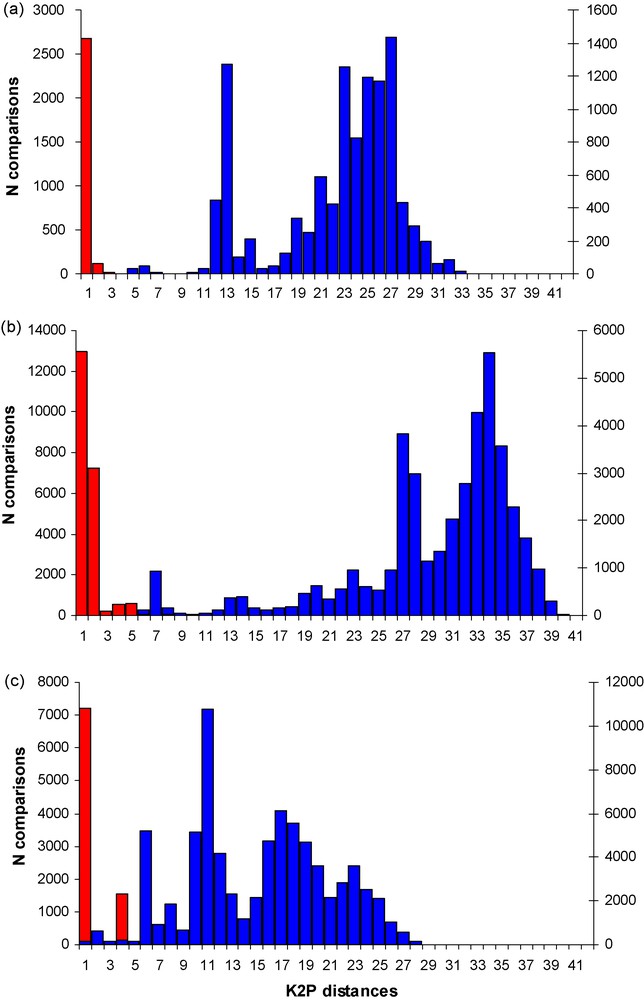
Intraspecific (red) and interspecific (blue) variation in K2P distances of Primates (a) cox1, (b) cob, (c) 16S mitochondrial genes, showing a clear DNA barcoding gap in the cox1 and cob sequences, but not in 16S sequences.
4 Discussion
The accuracy of distance-based DNA barcoding depends particularly on the extent of the separation between intra- and interspecific divergence in the selected marker. The ideal world for barcoding lacks any overlap between these two values [32]. By including cob and 16S in our analysis, besides cox1, we have been able to test the overlap between inter- and intraspecific mitochondrial distances in a much wider array of taxa than previous analyses. As apparent in Fig. 1 a wide gap exist between intra- and interspecies divergences for both cox1 and cob genes if all taxa within genera are compared, whereas this gap is less apparent for 16S, indicating that mitochondrial rRNA genes may be less suitable for species delimitation in DNA barcoding despite their many other advantages like universal primer applicability [19].
Especially the lower range of intraspecific values may be an effect of misnaming taxa in GenBank (by applying synonyms as opposed to the currently valid name), misidentification (such as the 16S sequence of a Kloss gibbon Hylobates klossi [AB050181.1] that clustered within agile gibbons H. agilis, and which has been identified as a black morph of this species: T. Geissmann in [33]), or may be real, whereas these factors, in addition to hybridisation, may explain some of the high upper range of values. Three of the species with a large amount of intraspecific genetic distances, i.e. the orangutan (cox1: 7.6% 16S: 3.5% cob: 8.0%), the hanuman langur (Semnopithecus entellus cob: 7.60%) and vervet monkey (Chlorocebus aethiops: cox1: 5.0% cob: 5.1%), in fact comprise two or more species (up to six for the hanuman langur following the taxonomic revision of 34) and/or that hybridise frequently.
It has been argued that the DNA barcoding gap will considerably lowered down if more individuals per species are sampled and when a large proportion of closely related taxa are included [35]. Fig. 2 shows the intra- and interspecific K2P distances for a group of closely related species for which a relative large number of sequences are available (the howler monkeys genus Alouatta, 8 species, cob-gene, 126 sequences of greater than 830 bp, 1–69 sequences per species). The barcoding gap is clearly present, with no overlap between intra- and interspecific variation.
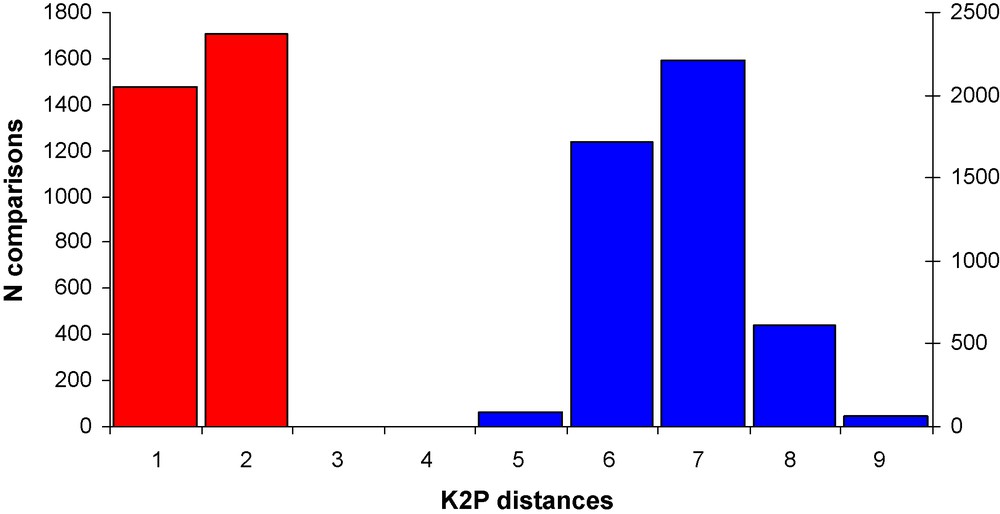
Intraspecific (red) and interspecific (blue) variation in K2P distances in the cob gene of eight species of howler monkeys (genus Alouatta), showing a clear DNA barcoding gap.
Numerous DNA barcoding studies conducted thus far revealed that more than 90% of species under study could be identified by this method. For example, [36] for Guyanan bats were able to allocate 93% of their species correctly, and [37] for North American breeding bird species rightly classified 95% of all species. The cases where barcodes failed to separate species involved either closely allied allopatric taxa whose status, as distinct species, is uncertain or comprised sister taxa that hybridise [38,39].
The failure of distance-based mitochondrial DNA barcoding to identify species could be due to two different causes: either mitochondrial introgression due to hybridisation and incomplete lineage sorting, which would cause some individuals in one species being closer to individuals of another species than to conspecifics; or an origin of parapatric species pairs by recent speciation, and therefore overall low genetic divergences between them. Our data set does not allow distinguishing between these two causes, but further research into this question would be useful to understand the processes influencing the perspectives and reliability of DNA barcoding in primates. If most of the problematic cases refer to introgression and incomplete lineage sorting, then nuclear markers need to be used to reliably discern between the affected species [40]. If recent speciation and generally low genetic distances (but reciprocally monophyletic haplotypes) are involved, then character based DNA barcoding may be more appropriate and would allow to sidestep the problem to find appropriate threshold values by searching barcoding gaps. In any case, where not only species identification but species discovery is concerned, it is clear that DNA barcoding should be used as only one (in many groups the first preliminary) step in the recognition, diagnosis and description of species in terms of integrative taxonomy [e.g. 41].
The use of mitochondrial markers in human evolutionary biology and comparative primatology is gaining importance [42,43,44], and a proper recognition of basal taxa is important if comparisons between species (including humans) are to be meaningful. While DNA barcoding does not offer a panacea in the debate of what comprises a species, for a large set of primate taxa we were able to demonstrate clear gaps in intra- and interspecific genetic distances for at least cox1 and cob genes, in principle allowing a more informed judgements to be made as to what comprises a species. We showed that there are significant differences in the intraspecific genetic distances between different mitochondrial markers, without, however, showing a consistent pattern. For some taxa cox1 showed the largest amount of genetic variation, whereas in others it was cob or 16S. We are fully aware that we were able to compare only a maximum of about a quarter of all primate species [cf. 34], and comparisons were made between markers as well as between individuals, and hope that in the near future an expanded dataset (more species, and more sequences per species) will allow a more detailed analysis to be conducted.
Conflicts of interest
The authors declare no conflicts of interest.
Acknowledgments
We are grateful to Prof Dr Miguel Vences (University of Braunschweich) for help with the analysis and Dr Masoud Shirazian (University of Delft) for writing the genetic distance program. This work was partially funded by grants from the Ministry of Science, Research and Technology of the Islamic Republic of Iran [to MA] and the Oxford Brookes University Research Mentor Scheme [to VN]. We thank a reviewer for helpful comments.