

1 Introduction
As a general rule, marine species are believed to present high levels of within-population and low levels of among-population genetic diversity. The large population sizes, high fecundity, and extensive gene flow caused by the high dispersal of adults, larvae or gametes account for this general pattern [1]. In addition, other physical factors, such as ocean currents and a lack of barriers in the open sea, can facilitate gene flow over large geographical distances [2–4]. In marine invertebrates, gene flow normally occurs through the high dispersal capabilities of planktonic larvae. However, a number of recent studies have found evidence of population structuring in marine organisms over either small or large geographical scales [5–12].
Mediterranean populations of many species have shown significant genetic differentiation, reflecting a variety of demographic histories [13–15]. Among the main genetic barriers, significant differentiation between populations from western and eastern Mediterranean basins has been reported for various species (reviewed in Patarnello et al. [16]). The knowledge of species’ genetic structuring is particularly important for marine species that are subject to commercial exploitation, since accurate information on stock boundaries is vital for effective and sustainable fisheries management. In the Mediterranean Sea, neighbouring states exploit shared resources in many areas. Information on population structure is thus necessary when combining data from populations with potentially different demographic parameters (e.g. recruitment or mortality rates) for stock assessment purposes. Such information is also useful for the subsequent implementation of coordinated fisheries management policies in an international context. Moreover, information on the spatial aspects of population ecology and interactions with relevant ecosystem components are needed to apply an ecosystem approach to fisheries management [17].
The Strait of Sicily lies in the Central Mediterranean, connecting the Eastern and Western Mediterranean basins. The fishing fleets of Italy, Malta, Libya, Tunisia and more recently Egypt operate in this area. Among the harvested species, cephalopods are important target species for both artisanal fishermen and industrial bottom otter trawlers [18]. The common octopus, Octopus vulgaris Cuvier, 1797, is the most important commercially harvested octopus species in the Mediterranean region. This species has a wide geographical distribution, comprising the Mediterranean Sea, the Eastern Atlantic from Southern England to south-western Africa, the Azores, the Canary Islands, Cape Verde, St Helena, the Tristan da Cunha Island, the southeast coast of South Africa in the Indian Ocean, the oceanic islands of the central Southern Indian Ocean, and the waters of Taiwan and Japan [19–21]. In the Mediterranean Sea, octopus catches reached more than 37 000 tons in 2007 [22,23], and total catches in the central Mediterranean exceeded 7500 tons in 2007 [18].
Due to the important contribution to regional fishery landings as well as its ecological importance, O. vulgaris is the most studied cephalopod in the Mediterranean [18,24–26]. O. vulgaris is found at depths of 0 to 200 m, and occupies a variety of habitats from the coastline to the outer edge of the continental shelf, such as rocky, sandy or muddy substrata and seagrass beds [24]. This species has a fast growth rate and reaches sexual maturity within a few months. According to Hernandez-Lopez and Castro Hernandez [27], the lifespan of O. vulgaris is 12–13 months in the Canary Islands, whilst Smale and Buchan [28] estimated a lifespan of 12–15 months in male and 9–12 months in females from the South African coasts. The life cycle has no larval stages, since the newly hatched octopuses, the so-called paralarvae, are morphologically similar to adults. However, paralarvae may swim in the water column for 35 to 60 days [29,30], thus gene flow is likely to be strongly influenced by water currents [2]. Moreover, water temperature is believed to influence the settlement of paralarvae, with an increase in temperature leading to a significantly shorter pelagic phase [31,32]. Female individuals of O. vulgaris have been shown to undergo limited seasonal migrations in relation to reproductive behaviour [28]. Inshore migrations of adult octopus were also observed in Tunisian waters during the peak fishing season in early fall to spring (S. Ezzeddine-Najai, personal communication). However, the contribution to gene flow of such migrations is minor, given that they take place at a spatial scale much smaller than that interested by paralarvae dispersal.
A wide variety of morphological and molecular phylogenetic studies have been carried out for Octopus genus [20,21,33–35]. Nevertheless, from a systematic perspective, whether O. vulgaris is a true cosmopolitan species, or a complex of sibling species is still debated.
To date, few studies have been carried out on population genetics of O. vulgaris in the Mediterranean [2,5,36]. The allozyme analysis by Maltagliati et al. [2] and microsatellite survey by Casu et al. [5] were consistent in showing that within the Mediterranean, O. vulgaris is not constituted by a single panmictic unit. These studies found that this species presents a genetic break between the Western and Eastern Mediterranean basins and is genetically structured according to the island model in a background of relatively high gene flow. More recently, Cabranes et al. [36] identified significant genetic structure following the isolation by distance model among samples collected around the Iberian Peninsula and Canary Islands.
Among the different markers available for population genetics and phylogeography, sequences of mitochondrial DNA (mtDNA) are widely used in marine organisms. The aim of this study was thus to further describe the population structure of O. vulgaris in the central Mediterranean basin by examining a region of the cytochrome oxidase III mitochondrial gene (COIII). The sampling scheme of the present study allowed us to give a deeper insight into the genetic break present in the central Mediterranean and observed in the Mediterranean-scale genetic survey by Maltagliati et al. [2].
2 Materials and methods
A total of 212 specimens of O. vulgaris were collected in the period April 2008–August 2009 from seven Mediterranean localities (Fig. 1). From each animal, a small piece of muscular tissue from the tip of one tentacle was excised and preserved at room temperature in absolute ethanol during the expedition. After DNA extraction, the samples were stored at –20 °C.

Map of sampling localities: 1, Galite Island; 2, Sicily; 3, Malta; 4, Deep-water Kerkennah Islands; 5, Coastal Kerkennah Islands; 6, Zarzis; 7, Libya.
Total genomic DNA was extracted using the QIAGEN DNeasy® tissue kit following the manufacturer's recommendations. The DNA concentration was determined by using the Nanodrop Spectrophotometer. Polymerase chain reaction (PCR) was used to amplify a 393 bp fragment of the COIII gene, with the primers described by Oosthuizen et al. [37]. PCR amplification reactions were obtained for a total volume of 50 μL in 1X Buffer (Promega), 1 mM MgCl2, 0.2 mM of each dNTP, 0.5 μM of each primer, 1.25 units of Taq polymerase (Go Taq® DNA polymerase, Promega) and 1–5 μl DNA (50 ng/μL).
The PCR program was: initial denaturation step of 5 min at 96 °C, 30 cycles of denaturation (93 °C for 50 s), annealing (50 °C for 30 s), extension (72 °C for 1 min), and a final extension step of 72 °C for 5 min. PCR products were visualized on a 1% agarose gel with ethidium bromide on an UV transilluminator. Purification of DNA target fragments was carried out by using a QIAquick PCR purification Kit (Qiagen) following manufacturer's instructions. The PCR products were sequenced in both directions on an ABI PRISM 310 automated sequencer (Applied Biosystems).
The obtained sequences were aligned using the CLUSTAL W algorithm [38], as implemented in the software BioEdit v. 7.0.5.3 [39]. Sequence alignment was adjusted by visual inspection, by comparing our COIII sequences with those of O. vulgaris available in GenBank. Furthermore, our sequences were compared to those of congeneric species available in GenBank for phylogenetic reconstruction. The complete list of sequences along with their accession number is provided in supplementary Table (Table S1). The phylogeny was reconstructed through Bayesian Inference (BI), as implemented in MrBayes 3.1 [40,41]. The model of evolution was determined by MrModeltest 2.3 [42]. Based on the Akaike Information Criteria, the retained model was the General Time Reversible model with a gamma correction [43]. Four millions generations were used with a burnin of 10 000 samples; all other parameters were set as default. The tree was rooted at midpoint and visualized with Treeview 1.6.6 [44]. The Maximum Likelihood (ML) analysis was performed using MEGA v.5 [45].
Summary statistics on both within-sample genetic diversity [number of haplotypes, haplotype diversity (h), nucleotide diversity (π), mean number of pairwise differences (MPD)] and among-sample genetic divergence (FST and ΦST.) were calculated using Arlequin v.3.5 [46]. The significance of FST and ΦST was tested with a permutation test with 10 000 replicates and P-values of pairwise tests were adjusted with the sequential Bonferroni correction [47].
A hierarchical analysis of molecular variance (AMOVA) [48] was performed to examine the partitioning of genetic variation within samples, among samples within Mediterranean basins and among basins. The AMOVA was based on the proportion of differences between haplotypes (ΦST like). The main null hypothesis tested by AMOVA was the non-differentiation of Western and Eastern Mediterranean populations. As the sample from Sicily (SI) lies close to the classic biogeographical bordering line separating Western and Eastern Mediterranean basins, two alternative groupings were tested: first, SI was included in the eastern basin; second, in the western basin.
The genetic relationships among the haplotypes were inferred using the Median-Joining Network analysis [49] with NETWORK 4.5.1.6 (www.fluxus-engineering.com).
Bayesian Analysis of Population Structure v5.2 (BAPS; [50–52]) was used to infer population structure by clustering genetically similar individuals into panmictic groups. BAPS adopts a Bayesian approach with a stochastic optimization algorithm for analysing models of population structure [50,52].
To test for isolation by distance (IBD), pairwise values of ΦST were plotted against geographical distance between sampling sites. Negative values of ΦST were set to zero. A Mantel test with 10 000 permutations was performed using IBDWS (isolation by distance web service at http://ibdws.sdsu.edu) [53]. The minimum nautical distances between all locations were calculated using Google Earth v. 6.1.
Local samples were ordinated through nonmetric multidimensional scaling (MDS), which was applied on the matrix of pairwise ΦST-values using the STATISTICA 8.0 package.
Gene flow was estimated for the total data set and for the eastern basin by means of the formula Nm = 0.5[Hw/(Hb–Hw)], where Hw is an estimate of the average divergence time of pairs of genes sampled from within a subpopulation, Hb is an estimate of the average divergence time of genes sampled from different subpopulations and Nm is the number of effective migrants per generation [54].
Demographic history was inferred by analysing the distribution of the number of site differences between pairs of sequences (mismatch distribution), which was carried out according to the procedure outlined in Rogers and Harpending [55], as implemented in DnaSP v5.10 [56]. The validity of the expansion model was evaluated using the parametric bootstrap approach by Schneider and Excoffier [57], using as test the sum of square deviations (SSD) between the observed and the expected mismatch. Fu's [58] FS and Ramos-Onsis and Rozas’ [59] R2 statistics were also computed. Their significance was tested with coalescent simulations (10 000 iterations), as implemented in DnaSP 5.10.
3 Results
Of the 393 bp of the COIII gene from 212 sequenced individuals of O. vulgaris, a total of eight (∼2%) nucleotide positions were polymorphic, two of which were parsimony informative sites. All variable nucleotide positions were substitutions. A total of eight haplotypes was found and their sequences were deposited in GenBank (accession numbers JQ085594-JQ085601).
The phylogenetic analyses using both maximum-likelihood and Bayesian inferences exhibited the same topology, with two main clades showing divergent groups of O. vulgaris species (Bayesian posterior probability, BPP = 1; boostrap support, BS = 99%) (Fig. 2). Moreover, the O. vulgaris haplotypes did not form a monophyletic group and were present in both clades along with sequences of O. tetricus in the first clade, and O. oculifer and O. bimaculoides in the second clade (Fig. 2). Within the first clade, the Mediterranean O. vulgaris haplotypes of the present work clustered together in a sub-clade and were associated with other haplotypes from the Mediterranean Sea, France, Senegal, South Africa, Tristan da Cunha and Saint Paul and Amsterdam Islands (Southern Indian Ocean). This clade also included haplotypes from O. tetricus from Australia. The second clade included O. bimaculoides and O. vulgaris from Brazil and Costa Rica and O. oculifer. The grouping of O. vulgaris haplotypes from Costa Rica with O. oculifer was strongly supported (BPP = 1; BS = 100%) and O. vulgaris haplotypes from Brazil were the next closest relative of this group.

Phylogenetic tree depicting relationships among Octopus species. Relationships were inferred using Bayesian inference and maximum likelihood analyses. Posterior probabilities > 0.95 and bootstrap values > 0.75 are reported.
Among the eight distinct haplotypes found here (H1–H8), two of them (H1 and H2) were shared by all sampling sites. The most common haplotype (H1) was represented in 78% of specimens, whilst the other high-frequency haplotype (H2) was observed in a smaller proportion (19%). The remaining haplotypes (3%) were location-private. Three of the seven samples only exhibited the two high-frequency haplotypes (Malta, Zarzis and Libya).
Overall, haplotype H1 is the most widespread and has a central distribution in the investigated range. Haplotype H2 is also frequent, with a slightly more Western distribution. Its highest frequency (33.4%) was observed in the Western Mediterranean sample of Galite Island;, while the lowest frequencies (6.4 and 8.8%) were detected in the two coastal samples of Kerkennah Islands and Zarzis (southern Tunisia), respectively. The haplotype and nucleotide diversity values of local samples were generally low, with the highest values recorded for the sample from Sicily, whereas the lowest values of haplotype and nucleotide diversity were observed in the coastal Zarzis sample (Table 1). Mean pairwise nucleotide differences between haplotypes within samples ranged from 0.3315 ± 0.3395 to 0.9959 ± 0.6853 (Table 1).
Octopus vulgaris. Estimates of genetic diversity for COIII sequences.
| Sampling Locality | Acronym | N | K | h | π | MPD | |
| 1 | Galite Island | GI | 39 | 3 | 0.489 ± 0.055 | 0.00253 ± 0.00194 | 0.9959 ± 0.6866 |
| 2 | Sicily | SI | 20 | 3 | 0.510 ± 0.090 | 0.00250 ± 0.00197 | 0.9842 ± 0.6948 |
| 3 | Malta | MA | 24 | 2 | 0.228 ± 0.102 | 0.00116 ± 0.00118 | 0.4565 ± 0.4169 |
| 4 | Deep-water of Kerkennah Islands | DWK | 44 | 4 | 0.377 ± 0.079 | 0.00192 ± 0.00160 | 0.7568 ± 0.5677 |
| 5 | Coastal Kerkennah Islands | CK | 31 | 4 | 0.243 ± 0.099 | 0.00096 ± 0.00104 | 0.3784 ± 0.3691 |
| 6 | Zarzis | ZA | 34 | 2 | 0.165 ± 0.080 | 0.00084 ± 0.00096 | 0.3315 ± 0.3403 |
| 7 | Libya | LI | 20 | 2 | 0.394 ± 0.100 | 0.00200 ± 0.00169 | 0.7894 ± 0.5973 |
| Total | 212 | 8 | 0.352 ± 0.035 | 0.00176 ± 0.00148 | 0.6950 ± 0.5287 |
The median-joining network of haplotypes revealed that the high-frequency H1 haplotype, was shared by all samples and was connected to four low-frequency haplotypes by only one mutational step (Fig. 3). The unique haplotypes H5 and H6 were observed only in the coastal sample of Kerkennah islands, whereas H7 and H8 were only found in the deep-water sample of Kerkennah Islands. In addition to the two high-frequency haplotypes, samples from Sicily and Galite Island showed the haplotypes H3 and H4, respectively (Fig. 3).
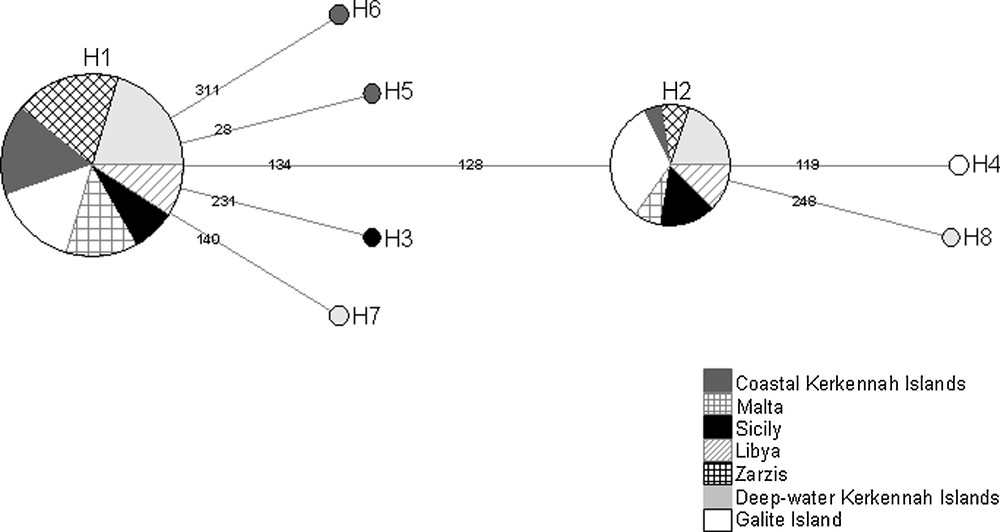
Median-joining network of haplotypes for the seven local samples of Octopus vulgaris. Size of circles is proportional to the frequency of each haplotype.
Replicate runs of BAPS produced three genetic clusters (hereafter named haplogroup I, II and III; P = 0.563) (Fig. 4). Individuals were mostly assigned to the first haplogroup (HG I), whose relative proportion in local samples ranged from 64% (Galite Island) to 91% (Zarzis). Conversely, the proportion of the second haplogroup (HG II) was higher in the Galite Island sample (36%) and was lower in Zarzis (9%) (Fig. 4). HG III was present with a minor proportion (2 to 5%) only in samples from Sicily and Kerkennah Islands.
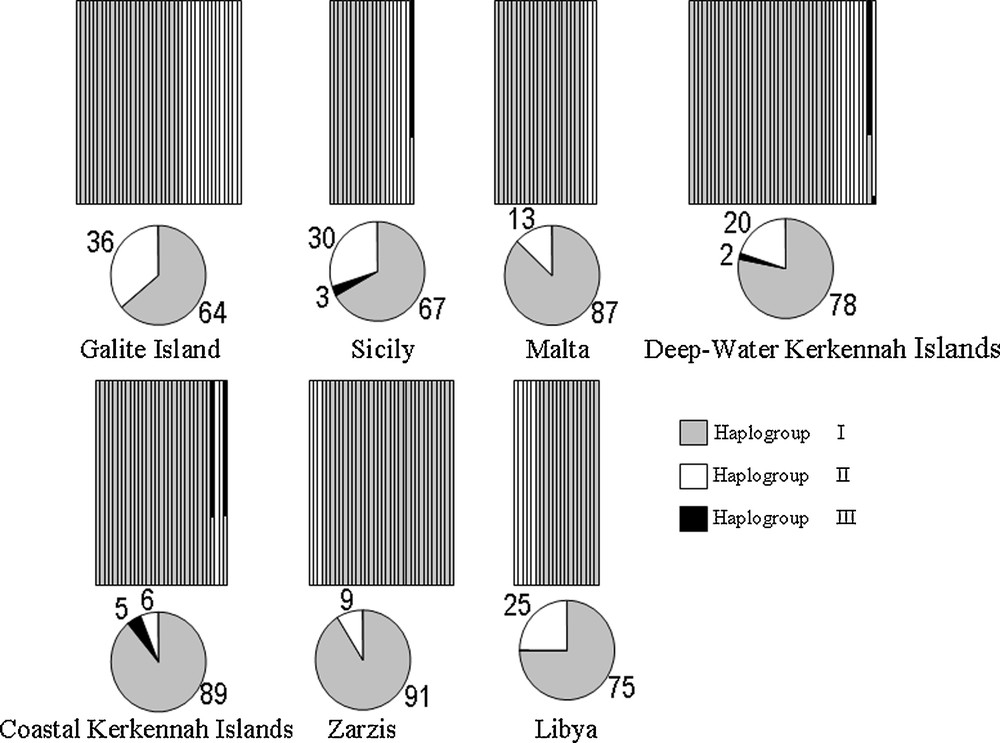
Bayesian assignment analysis for COIII sequences in 212 individuals of Octopus vulgaris from central Mediterranean sites. Each vertical bar represents an individual and its associated probability of belonging to one of the three haplogroups detected (grey, black and white) (associated P = 0.563). Pie charts indicate percentages of the haplogroups contributing to each local sample. All individuals were assigned with probability values > 0.05.
The overall estimate of genetic divergence was significant (ΦST = 0.046, P < 0.05), suggesting a degree of genetic structuring in the study area (Table 2). The AMOVA conducted between Eastern Mediterranean (EM) vs. Western Mediterranean (WM), when Sicily locality (SI) was included in the EM did not give significant genetic divergence between basins (ΦCT = 0.083, P = 0.140) (Table 2). Conversely, when SI was included within the WM group, significant differentiation was found between the two basins, (ΦCT = 0.094, P < 0.05) (Table 2). Accordingly, the inclusion of SI within the EM lowered the variance among regions component compared to the value obtained when SI was associated to the WM (Table 2).
Octopus vulgaris. Hierarchical AMOVA analyses for COIII fragment with different grouping criteria. The acronyms are the same as those used in Table 1.
| Source of variation | df | Variance component | Percentage of variance | Φ-statistics | |
| All samples | Among samples | 6 | 0.01609 | 4.60 | ΦST = 0.046* |
| Within samples | 205 | 0.33387 | 95.40 | ||
| Western Mediterranean (GI) vs. Eastern Mediterranean (MA, DWK, CK, ZA, LI, SI) | Among regions | 1 | 0.03103 | 8.39 | ΦCT = 0.083NS |
| Among samples within basins | 5 | 0.00507 | 1.37 | ΦSC = 0.014NS | |
| Within basins | 205 | 0.33387 | 90.24 | ΦST = 0.097* | |
| Western Mediterranean (GI and SI) vs. Eastern Mediterranean (MA, DWK, CK, ZA, LI) | Among regions | 1 | 0.03471 | 9.43 | ΦCT = 0.094* |
| Among samples within basins | 5 | –0.00040 | –0.11 | ΦSC = –0.001NS | |
| Within basins | 205 | 0.33387 | 90.68 | ΦST = 0.093* |
The only significant pairwise ΦST was relative to the comparison between western Mediterranean samples (GI and SI) and the two southern coastal Tunisian samples located in the Gulf of Gabes (ZA and CK) (Table 3). However, after the application of the sequential Bonferroni correction, only the ΦST-value observed between Galite Island and coastal Kerkennah Islands samples remained significant (Table 3). Instead, significant differentiation was observed for all pairwise comparisons when using FST (Table 3).
Octopus vulgaris. Pairwise estimates of FST (above diagonal) and ΦST (below diagonal) among the seven local samples from the central Mediterranean Sea.
| MA | LI | CK | DWK | ZA | SI | GI | |
| MA | 0.694 *** | 0.763 *** | 0.681 *** | 0.807 *** | 0.639 *** | 0.620 *** | |
| LI | 0.005NS | 0.693 *** | 0.616 *** | 0.743 *** | 0.547 *** | 0.548 *** | |
| CK | –0.014NS | 0.083NS | 0.681 *** | 0.797 *** | 0.643 *** | 0.624 *** | |
| DWK | –0.011NS | –0.030NS | 0.041NS | 0.718 *** | 0.571 *** | 0.568 *** | |
| ZA | –0.029NS | 0.061NS | –0.022NS | 0.022NS | 0.695 *** | 0.664 *** | |
| SI | 0.043NS | –0.043NS | 0.128* | –0.010NS | 0.108* | 0.501 *** | |
| GI | 0.095NS | –0.011NS | 0.176 ** | 0.031NS | 0.157* | –0.028NS |
Isolation by distance in the study area was not evidenced by the Mantel test (Z = 329.3614; r = 0.2578; P = 0.137).
The nonmetric multidimensional scaling (MDS) based on pairwise ΦST-values showed a substantial scattering of samples in the plot and did not reveal any clear geographical pattern (Fig. 5). The estimates of gene flow for the whole data set (Nm = 12.5) and for the Eastern region first by including the Sicily locality to the Eastern group (Nm = 24.0) and second by omitting it from this group (Nm = 42.5) suggested high levels of genetic connectivity within the study area, particularly within the EM, after removing the Sicily sample.

Plot of the first two dimensions obtained from nonmetric multidimensional scaling of pairwise ΦST among Mediterranean sampling sites.
The mismatch distribution analyses showed a bimodal distribution for the seven sampling localities and the total data set that differed significantly from the curve expected from the Rogers and Harpending's [55] sudden expansion model (Fig. 6, Table 4). Fu's [58] FS and Ramos-Onsins and Rozas’ [59] R2 tests gave no significant value, with the exception of FS value relative to the coastal sample of Kerkennah Islands (Table 4).

Pairwise mismatch distributions; observed (dashed line) and expected (solid line) curves for all specimens (A), and within each sample (B to H). X-axis: number of pairwise differences; Y-axis: frequency of mismatches.
Octopus vulgaris. Sum of squared deviations (SSD) between the observed and expected mismatch distributions of pairwise-differences, Fu's (1997) FS and Ramos-Onsins and Rozas’ (2002) R2 neutrality tests for COIII haplotypes; P-values were obtained by coalescent simulations with 10 000 replicates.
| Samples | SSD | Fu's Fs | R 2 |
| GI | 0.14NS | 1.854NS | 0.124NS |
| SI | 0.10NS | 1.185NS | 0.154NS |
| MA | 0.078NS | 1.333NS | 0.158NS |
| DWK | 0.229*** | 0.053NS | 0.123NS |
| CK | 0.00NS | –1.821* | 0.148NS |
| ZA | 0.036* | 0.952NS | 0.144NS |
| LI | 0.311*** | 2.343NS | 0.162NS |
| Total | 0.214*** | –2.735NS | 0.083NS |
4 Discussion
4.1 COIII-based phylogeny of Octopus
The present study confirmed the discriminatory power of COIII for inferring evolutionary relationships and distinguishing among closely related octopus species [20,33,34]. Results from phylogenetic analyses showed that O. vulgaris from the central Mediterranean are genetically related to other conspecifics from other regions within the species’ geographical range (Mediterranean Sea, France, Senegal, Tristan da Cunha, and South Africa). Interestingly, O. tetricus from Australian waters clustered within the O. vulgaris clade, corroborating the findings by Guzik et al. [34], who employed sequences of the mitochondrial Cytochrome b and nuclear Elongation Factor-1α genes in 26 Octopus species, and Guerra et al. [21], who used sequences of COI and COIII regions in individuals from Saint Paul and Amsterdam Islands in the southern Indian Ocean. The most likely explanation for this outcome is that O. tetricus is not a valid species, but a member of the O. vulgaris group. However, deeper molecular and morphological investigations are needed, in order to fully validate this synonymy. The second clade observed in the present work grouped O. oculifer with O. vulgaris specimens from the Caribbean and southwest Atlantic, and a separate cluster containing only O. bimaculoides. This outcome is also consistent with Guzik et al.’s [34] and Guerra et al.’s [21] results, suggesting the occurrence of cryptic species within the O. vulgaris species complex. At this regard, Leite et al. [35], with a morphological and molecular study using the mitochondrial gene for 16S ribosomal RNA, described O. insularis in the tropical south-western Atlantic. This new species differed both morphologically and genetically from O. vulgaris from the Mediterranean, Venezuela and southern Brazil. Our results confirmed that O. vulgaris in the Mediterranean is a monophyletic group, but also highlighted an urgent need for further investigations to clarify the systematics within Octopodinae subfamily.
4.2 Phylogeography of O. vulgaris in the central Mediterranean
This study provided an insight into the genetic structure of O. vulgaris in the central Mediterranean Sea. Overall, the species exhibited low nucleotide diversity (mean π = 0.0017) and low to moderate haplotype diversity values (h = 0.165 to 0.510) (Table 1). The low evolution rates for coding region sequences [60], or loss of diversity after demographic crashes or selective events, may account for the low nucleotide diversity of COIII found in the present work. Nevertheless, the selective neutrality tests did not lead to the rejection of mutation-drift equilibrium for this marker. In a previous study on the genetic structure of O. vulgaris from South African coasts, absence of polymorphism for COIII was found in 35 individuals [37]. In the present study, the lowest genetic diversity was observed in the Zarzis sample; genetic loss in Zarzis local stock due to the intense fishing pressure of O. vulgaris in the Gulf of Gabes (Ezzeddine-Najai S. personal communication) might account for this result. Nevertheless, this conclusion would required more investigations in order to be validated.
The AMOVA indicated significant genetic divergence between western (Galite Islands and Sicily) and eastern (Malta, Kerkennah, Zarzis, and Libya) samples. This outcome corroborated results obtained by Maltagliati et al. [2] with allozyme markers. Significant genetic divergence between western and eastern Mediterranean basins has been reported for many marine species (reviewed in Patarnello et al. [16]) and interpreted as the restriction of gene flow related to the oceanographic transition zone at the Siculo-Tunisian Strait. From the hydrodynamic point of view, the Strait of Sicily is an active area, characterised by overlapping water masses. The remnants of Atlantic water are found in the upper layer, the so-called Atlantic Ionian Stream (AIS) [61]. The hydrodynamic characteristics of this Strait may constitute a barrier or restriction to gene flow for different species.
Within both the western and eastern Mediterranean basins, significant genetic divergence among O. vulgaris samples was evidenced by FST for all pairwise comparisons. However, a minor number of significant comparisons were obtained when ΦST was used. This discrepancy may be related to the divergence time of the considered samples. Indeed, as ΦST takes into account the molecular aspects of sequence differences, it gives high values for populations with high divergence time, but it is less efficient for detecting significant genetic structure when sequence divergence between populations is low. Results of the present study showed a degree of significant genetic structuring in the study area, with recent divergence times or ongoing sporadic gene flow. This would be consistent with the hypothesis that paralarvae do not provide enough effective dispersal for genetic homogeneisation. Moreover, mesoscale eddies and vortexes could facilitate larval retention and settlement in certain areas of the Strait of Sicily. At this regard, Garofalo et al. [18], on the basis of results obtained on nursery and spawning grounds and the relationship between sea surface temperature and abundance of juvenile O. vulgaris in the Strait of Sicily, defined two “population subunits” characterised by only partial connectivity on the Adventure and Malta Banks. Indeed, a number of studies suggested the existence of population subunits in O. vulgaris throughout the Mediterranean Sea and Atlantic Ocean. In an allozyme survey, Maltagliati et al. [2] found significant genetic divergence between populations of eastern and western Mediterranean basins. Another study using a single microsatellite locus found high levels of genetic differentiation between nine samples across the Mediterranean Sea and one Atlantic locality [5]. Cabranes et al. [36], employing five microsatellite loci, identified significant population structuring among five samples from the Atlantic sites and one from the Mediterranean Sea. A further microsatellite survey on samples from the north-western African coasts revealed significant genetic structuring between samples collected in Mauritanian and West Saharan waters [62]. Consistently with results of the present investigation, all these studies showed that the isolation-by-distance model could not explain the observed inter-sample genetic differentiation; instead, importance should be provided to contemporary oceanographic patterns in structuring the genetic make-up of common octopus populations.
The mismatch distribution analyses were consistent with a situation of population stability, as evidenced by bimodal distributions [55]. Even though Marjoram and Donnelly [63] and Aris-Brosou and Excoffier [64] observed that other factors, such as population substructuring and mutation rate heterogeneity cannot be excluded in determining multimodal mismatch distributions, Fu's [58] FS and Ramos-Onsins and Rozas’ [59] R2 tests of the present study gave a general picture of population demographic stability.
From a fisheries perspective, the genetic break between western and eastern basins implies that at least two genetic stocks are present in the Mediterranean, requiring separate management. However, the significant genetic divergence found at a smaller spatial scale suggests that further stock substructuring may be present. The potential occurrence of several, only partially interconnected population or stock subunits of O. vulgaris in the central Mediterranean, is worth of deeper investigations with different classes of molecular markers, as well as a fine-grained sampling design along the observed and alleged genetic discontinuities. Such information is vital in order to plan management measures of common octopus that may have long-term effectiveness.
Disclosure of interest
The authors declare that they have no conflicts of interest concerning this article.
Acknowledgments
This work was supported by the FAO Project “Assessment and monitoring of fisheries resources and the ecosystems in the Straits of Sicily” (MedSudMed), funded by the Italian Ministry of Agriculture, Food and Forestry Policies, MiPAAF and the Tunisian Ministry of High Education and Scientific Research.