

1 Introduction
The nutritional quality of a food crop depends, in part, on the metabolite components present in it. Natural diversity of chemical composition of a food crop is also responsible for its taste, colour, fragrance and characters like resistance to disease and other stress factors. Qualitative and quantitative identification of the metabolome (the small molecules) using metabolomic technology would assist in identifying the biochemical markers responsible for such quality. The nutritional scientists also may precisely identify bioactive ingredients in foods and better understand their potentially beneficial (or harmful) consequences using metabolomic technology [1].
Rice (Oryza sativa L.) is the staple food source for a large proportion of the world's population and also has potential health benefits. In India rice gruel is used in disorganized digestion, in bowel complaints in diarrhoea and dysentery. Rice water is demulcent, nourishing drink in febrile diseases and inflammatory states of the intestine [2]. The tocotrienol rich fraction of rice bran is effective in lowering serum total and LDL-cholesterol levels. Tocotrienols have superior efficacy compared with α-tocopherol [3]. Red and black rice decrease atherosclerotic plaque formation in rabbits [4]. Rice grains have antioxidant properties [5].
Metabolomic methodology has been applied to the metabolic phenotyping of natural variants in brown rice from 68 varieties from the world rice core collection (WRC) and two other varieties. Ten metabolites were selected as metabolite representatives [6]. The correlative relationships between genetic and metabolic diversity among 18 accessions from the world rice collection based on their population structure were assessed. The variations in the metabolic fingerprint of the extracts of seed grains were analysed with one dimensional 1H-nuclear magnetic resonance (NMR). The result indicated that there were no relationships between the genomic and metabolic diversity of solution metabolites [7]. Metabolomics technology has also been applied for determination of flavour profile [8], production of GM rice [9].
Analysis of the natural variations in rice using metabolomics techniques is thought to be not only useful to understand the biological traits of rice such as the yield and defence responses, but also helpful to improve rice quality, including its taste and nutritive value [10]. Variations in the chemical composition of grains are important to grain consumers and to both food/feed industries for the purposes of quality control [11]. Metabolomics is thought to be a technique that may be applicable to rice breeding by a combination of other omics approaches [12]. Detailed report regarding the metabolite profile of Indian rice varieties are lacking. The aim of the present work is to analyse metabolic diversity in 26 varieties of rice grains of India using gas chromatography-mass spectrometry (GC-MS) which is currently the most utilized global analysis method for data acquisition by metabolomics technology [13].
2 Materials and methods
2.1 Plant materials
Grains from 26 different indica rice varieties were obtained from the plants grown in the paddy field at Rice Research Station, Chinsurah, Directorate of Agriculture, Government of West Bengal, India. The varieties (code names used) were Raghusail (WA), Bhasamanik (WB), Biraj (WC), Radhunipagal (WD), Kumargone (WE), Bipasha (WF), Lalat (WG), Manassarovar (WH), Tilokkachari (WI), Mahananda (WJ), Swarna (WK), Sashi (WL), Sunil (WM), Jhingasail (WN), Rupsail (WO), Badshabhog (WP), Shalibahan (WQ), IE7-6141 Kunti (WR), Mandira (WS), SR-26 B (WT), Kalamkati 147 (RA), Meghal Patnai (RB), FR 13A (RC), Jaladhi I (RD), FR 43B (RE), NC 678 (RF). The size and colour of the grains are presented in Table 1.
Morphological characters of rice grains.
| Rice grains variety (code name) | Length (mm) ± sd |
Breadth (mm) ± sd |
Length: Breadth | Colour |
| Raghusaila (WA) | 7.04 ± 0.1125 | 2.3 ± 0.2582 | 3.061 | Sand dune |
| Bhasamanika (WB) | 5.705 ± 0.2598 | 2.2 ± 0.2297 | 2.593 | Corn silk |
| CNM-539Birajc (WC) | 6.257 ± 0.3217 | 2.05 ± 0.1054 | 3.052 | Gold sunset |
| Radhunipagala (WD) | 3.95 ± 0.3073 | 2 ± 0 | 1.795 | Jonquil |
| Kumargonea (WE) | 6.495 ± 0.3459 | 3.025 ± 0.0791 | 2.147 | Ray of light |
| Bipashab (WF) | 6.115 ± 0.1248 | 2.795 ± 0.1921 | 2.188 | Chick yellow |
| Lalatb (WG) | 7.095 ± 0.1787 | 2.165 ± 0.1668 | 3.277 | Sweet buttercup |
| Manassarovarb (WH) | 5.87 ± 0.1735 | 2.455 ± 0.0956 | 2.391 | Sunny |
| Tilokkacharia (WI) | 6.645 ± 0.3104 | 3.1 ± 0.1291 | 2.144 | Celestial sun |
| Mahanandab (WJ) | 8.395 ± 0.4368 | 2.325 ± 0.2058 | 3.611 | Sun rays |
| Swarnab (WK) | 5.745 ± 0.1589 | 2.175 ± 0.1208 | 2.641 | Cheers |
| Shashib (WL) | 7.07 ± 0.1719 | 2.125 ± 0.1318 | 3.327 | Soft yellow |
| Sunilb (WM) | 8.07 ± 0.2084 | 2.15 ± 0.1291 | 3.753 | Indian corn |
| Jhingasaila (WN) | 6.94 ± 0.1022 | 2.225 ± 0.0791 | 3.119 | Cottage yellow |
| Rupsaila (WO) | 6.245 ± 0.195 | 2 ± 0 | 3.123 | Orange copper |
| Badshabhoga (WP) | 4.625 ± 0.2946 | 2.025 ± 0.0791 | 2.284 | Falling star |
| Shalibahanb (WQ) | 5.865 ± 0.1226 | 2.9 ± 0.1291 | 2.022 | Sparkler |
| IE7-6141Kuntib (WR) | 7.415 ± 0.2739 | 2.115 ± 0.1248 | 3.506 | Pale lemon |
| Mandirab (WS) | 5.08 ± 0.1295 | 2 ± 0 | 2.540 | Prairie grass |
| SR-26 Ba (WT) | 6.91 ± 0.1125 | 2.075 ± 0.121 | 3.330 | Glorious |
| Kalamkati 147a (RA) | 6.69 ± 0.3195 | 2.075 ± 0.121 | 3.224 | Mocha treat |
| Meghal Patnaia (RB) | 5.975 ± 0.03536 | 2.275 ± 0.0354 | 2.626 | Wine |
| FR 13Aa (RC) | 5.715 ± 0.2897 | 2.325 ± 0.1687 | 2.458 | Brunt umber |
| Jaladhi 1a (RD) | 5.33 ± 0.25 | 2.075 ± 0.121 | 2.569 | Tinder box |
| FR 43Ba (RE) | 5.25 ± 0.2357 | 2.325 ± 0.2058 | 2.258 | Deep russet |
| NC 678a (RF) | 6.075 ± 0.1687 | 2.375 ± 0.1768 | 2.558 | Crimson velvet |
a Indegenous variety.
b High yielding variety.
c Mutated variety.
2.2 Extraction of grains
Two grains were dehusked, powdered using mortar and pestle and extracted with 1 ml methanol (at 70 °C for 15 minutes) after addition of internal standards ribitol and norleucine (20 μl of 0.2 mg/ml solution). The supernatant was collected by centrifugation and distributed into 3 Eppendorf tubes (2 × 50 μl and 5 μl). This was repeated five times for each rice sample (biological replication).
2.3 Derivatisation
Before GC-MS analysis, the extracts were derivatised [14]. One dry residue of 50 μl was re-dissolved and derivatised for 120 min at 37 °C (in 20 μl of 30 mg/ml methoxyamine hydrochloride in pyridine) followed by a 45 min treatment with 40 μl of N-methyl-N-(tert-butyldimethylsilyl)trifluoroaceteamide + 1% tert-butyldimethylchlorosilane at 65 °C (for TBS analysis) and another 50 μl and the 5 μl dried residue were re-dissolved and derivatised for 120 min at 37 °C (in 20 μl of 30 mg/ml methoxyamine hydrochloride in pyridine) followed by a 120 min treatment with 40 μl N-methyl-N-(trimethylsilyl) trifluoroacetamide at 37 °C (for TMS analysis). 5 μl of a retention time standard mixture (0.029% (v/v) n-dodecane, n-pentadecane, n-nonadecane, n-docosane, n-octacosane, n-dotracontane, n-hexatriacontane dissolved in pyridine) was added prior to derivatisation. Sample volumes of 1 μl were injected onto the GC column using a hot needle technique.
2.4 GC-MS analysis
GC-MS analysis of TMS and TBS derivatives was carried out according to the previously reported method [15].
2.5 Data analysis and statistical analysis
Chromatograms and mass spectra were evaluated using the Xcalibur program (ThermoFinnigan, Manchester, UK). Mass spectra of eluting TMS compounds were identified using the commercial mass spectral library NIST (http://www.nist.gov/srd/nist1a.htm) and the public domain mass spectra library of Max-Planck-Institute for Plant Physiology, Golm, Germany (http://csbdb.mpimp-golm.mpg.de/csbdb/gmd/msri/gmd_msri.html). Mass spectra of eluting TBS compounds were identified using TBS mass spectral library available at Melbourne University. Response ratios represent peak area ratios using ribitol as quantitative internal standard. Relative response ratios [16,17] normalised per gram fresh weight for each analysed metabolite were calculated.
Data were analysed by one way ANOVA to describe the significance in variation of each metabolite level between the varieties. P values < 0.05 were considered as significant. Hierarchical clusters were generated using SPSS Software (Version 16) following the minimum distance hierarchical method which calculates the sum of squared Euclidean distances from each case in a cluster to the mean of all variables. The method minimized the sum of squares of any pair of clusters formed at a given step. The approach maximizes between-group differences and minimizes within-group distances, optimizing the F statistic.
3 Results
Metabolic diversity regarding some polar metabolites e.g. sugars and sugar alcohols, amino acids/derivatives, phenolic acids and other organic acids and non-polar metabolites e.g. fatty acids and phytosterols was examined in 26 varieties of Indian rice grains using metabolomics approach by gas chromatography-mass spectrometry (GC-MS). Methanol extracts of rice grains were separated and analysed by GC-MS after derivatisation in TMS or TBS. Chromatograms were analysed using Automated Mass spectral Deconvolution and Identification System (AMDIS). Samples derivatised with TMS and TBS yielded more than hundreds of compounds varying in quantity according to varieties. Seventy-six metabolites could be identified in the rice varieties analysed. These metabolites were characterized into seven groups based on their chemical characteristics. These are sugars/sugar alcohols, amino acids/derivatives, fatty acids, free phenolic acids and other organic acids, phytosterols, purine derivatives and other constituents. Relative response ratios of the identified metabolites in different rice grains were calculated and are presented in Tables 2–6. For comparative purposes, relative response ratios for each metabolite are routinely described [18].
Relative response ratios of amino acids identified in rice grains.
| Alanine | Beta-Alanine | Allantoin | Asparagine | Aspartate | GABA | Glutamate | Glycine | Homoserine_3TBS | |
| WA | 34.74 ± 11.07 | 0.62 ± 0.17 | 3.88 ± 1.69 | 1.62 ± 0.37 | 1.44 ± 0.70 | 2.69 ± 0.63 | 3.12 ± 1.07 | 4.11 ± 0.98 | 11.50 ± 8.43 |
| WB | 85.12 ± 19.30 | 1.97 ± 0.70 | 5.95 ± 0.86 | 2.93 ± 0.61 | 3.80 ± 1.95 | 11.31 ± 3.48 | 5.46 ± 1.54 | 11.61 ± 3.21 | 74.80 ± 52.43 |
| WC | 47.28 ± 8.97 | 0.96 ± 0.22 | 1.88 ± 0.54 | 1.71 ± 0.81 | 1.41 ± 0.59 | 5.26 ± 1.00 | 1.97 ± 0.23 | 5.27 ± 1.00 | 43.51 ± 46.77 |
| WD | 50.21 ± 21.95 | 0.86 ± 0.21 | 2.50 ± 0.81 | 1.70 ± 0.35 | 1.97 ± 0.45 | 5.21 ± 2.08 | 1.99 ± 0.44 | 5.80 ± 2.15 | 46.35 ± 55.81 |
| WE | 39.72 ± 10.33 | 0.93 ± 0.05 | 6.15 ± 0.58 | 4.75 ± 1.31 | 2.29 ± 0.32 | 3.26 ± 0.53 | 2.89 ± 0.40 | 7.01 ± 0.92 | 23.36 ± 20.36 |
| WF | 47.91 ± 11.39 | 1.11 ± 0.19 | 5.01 ± 1.59 | 4.43 ± 1.98 | 1.89 ± 0.68 | 3.49 ± 0.64 | 3.14 ± 0.72 | 5.82 ± 1.98 | 23.80 ± 13.86 |
| WG | 34.75 ± 16.59 | 0.97 ± 0.18 | 3.15 ± 0.59 | 1.94 ± 0.63 | 1.14 ± 0.35 | 3.85 ± 0.67 | 2.02 ± 0.67 | 4.10 ± 0.44 | 19.70 ± 7.48 |
| WH | 52.47 ± 21.81 | 1.11 ± 0.35 | 6.03 ± 2.38 | 4.63 ± 1.99 | 1.66 ± 0.30 | 4.09 ± 1.25 | 2.12 ± 0.22 | 5.32 ± 0.72 | 26.82 ± 43.28 |
| WI | 65.17 ± 13.73 | 1.34 ± 0.29 | 10.36 ± 4.44 | 5.77 ± 5.86 | 2.28 ± 1.55 | 4.93 ± 0.77 | 2.63 ± 0.68 | 6.45 ± 1.14 | 45.72 ± 43.87 |
| WJ | 54.65 ± 22.70 | 1.22 ± 0.32 | 4.52 ± 1.86 | 2.73 ± 0.70 | 1.87 ± 0.46 | 6.43 ± 0.96 | 2.81 ± 0.46 | 6.40 ± 1.00 | 54.16 ± 63.00 |
| WK | 56.28 ± 20.87 | 1.89 ± 0.48 | 2.27 ± 0.82 | 5.03 ± 1.27 | 2.70 ± 0.55 | 5.35 ± 1.28 | 2.20 ± 0.75 | 5.84 ± 1.24 | 63.72 ± 67.12 |
| WL | 56.45 ± 8.63 | 1.37 ± 0.11 | 2.29 ± 0.60 | 2.24 ± 0.74 | 1.66 ± 0.40 | 4.63 ± 1.11 | 1.60 ± 0.70 | 4.19 ± 0.23 | 36.24 ± 14.03 |
| WM | 62.11 ± 26.02 | 1.26 ± 0.29 | 4.29 ± 0.92 | 2.57 ± 0.43 | 1.83 ± 0.54 | 7.17 ± 1.09 | 1.98 ± 0.70 | 6.68 ± 0.56 | 42.55 ± 26.54 |
| WN | 57.27 ± 17.85 | 0.89 ± 0.40 | 1.20 ± 0.18 | 1.98 ± 0.54 | 0.92 ± 0.36 | 2.48 ± 0.19 | 1.52 ± 0.61 | 4.24 ± 0.86 | 19.11 ± 2.55 |
| WO | 67.55 ± 25.66 | 1.52 ± 0.68 | 2.46 ± 0.64 | 1.70 ± 1.27 | 0.62 ± 0.24 | 3.52 ± 0.32 | 0.91 ± 0.58 | 4.76 ± 0.64 | 14.22 ± 2.60 |
| WP | 58.14 ± 18.09 | 0.96 ± 0.28 | 1.66 ± 0.24 | 1.30 ± 0.20 | 0.47 ± 0.20 | 1.58 ± 0.18 | 1.80 ± 0.16 | 5.97 ± 0.31 | 15.39 ± 1.09 |
| WQ | 46.24 ± 13.92 | 0.89 ± 0.22 | 0.98 ± 0.27 | 0.62 ± 0.12 | 0.31 ± 0.07 | 1.69 ± 0.47 | 0.98 ± 0.23 | 3.30 ± 0.62 | 12.78 ± 0.93 |
| WR | 28.03 ± 6.76 | 0.86 ± 0.23 | 1.03 ± 0.52 | 0.42 ± 0.04 | 0.38 ± 0.04 | 1.12 ± 0.19 | 0.75 ± 0.14 | 2.34 ± 0.30 | 9.76 ± 1.65 |
| WS | 65.16 ± 7.98 | 1.05 ± 0.13 | 1.19 ± 0.18 | 0.92 ± 0.18 | 0.52 ± 0.12 | 2.37 ± 0.92 | 1.16 ± 0.15 | 4.33 ± 0.59 | 10.62 ± 2.36 |
| WT | 51.90 ± 10.37 | 0.85 ± 0.11 | 1.13 ± 0.14 | 0.47 ± 0.07 | 0.24 ± 0.03 | 2.49 ± 0.24 | 0.77 ± 0.12 | 3.20 ± 0.42 | 8.99 ± 0.98 |
| RA | 28.63 ± 6.61 | 0.55 ± 0.14 | 3.41 ± 2.11 | 0.40 ± 0.08 | 0.36 ± 0.15 | 2.81 ± 1.08 | 0.61 ± 0.32 | 1.40 ± 0.29 | 16.60 ± 4.11 |
| RB | 27.44 ± 8.70 | 0.46 ± 0.13 | 5.87 ± 3.35 | 1.58 ± 0.28 | 1.23 ± 0.20 | 5.33 ± 1.26 | 1.75 ± 0.45 | 14.65 ± 18.72 | 100.51 ± 37.89 |
| RC | 38.02 ± 17.88 | 0.90 ± 0.16 | 2.48 ± 0.65 | 1.71 ± 0.84 | 0.67 ± 0.32 | 2.47 ± 0.35 | 0.79 ± 0.16 | 2.40 ± 0.79 | 19.01 ± 1.79 |
| RD | 31.00 ± 6.68 | 0.50 ± 0.08 | 4.44 ± 2.96 | 1.01 ± 0.43 | 0.48 ± 0.08 | 3.22 ± 0.63 | 0.83 ± 0.27 | 1.71 ± 0.20 | 32.34 ± 12.39 |
| RE | 37.49 ± 12.92 | 0.71 ± 0.06 | 2.67 ± 0.45 | 1.03 ± 0.53 | 0.57 ± 0.16 | 3.07 ± 1.06 | 1.00 ± 0.71 | 2.12 ± 0.40 | 22.61 ± 4.91 |
| RF | 25.71 ± 13.18 | 0.57 ± 0.14 | 3.66 ± 1.11 | 2.06 ± 0.58 | 0.79 ± 0.24 | 4.90 ± 0.88 | 1.39 ± 0.52 | 2.70 ± 0.66 | 46.35 ± 16.80 |
| Leucine | Phenylalanine | Proline | Pyroglutamate | Serine | Threonine | Tyrosine | Valine | ||
| WA | 1.05 ± 0.16 | 0.20 ± 0.04 | 1.26 ± 0.20 | 3.70 ± 1.44 | 0.89 ± 0.23 | 0.14 ± 0.07 | 1.99 ± 0.65 | 5.81 ± 1.81 | |
| WB | 2.16 ± 0.65 | 0.27 ± 0.09 | 2.97 ± 0.43 | 10.09 ± 3.89 | 2.86 ± 1.24 | 0.31 ± 0.11 | 4.46 ± 1.32 | 11.09 ± 3.68 | |
| WC | 1.46 ± 0.21 | 0.16 ± 0.07 | 1.34 ± 0.24 | 4.60 ± 1.16 | 1.00 ± 0.12 | 0.12 ± 0.01 | 2.15 ± 0.66 | 6.99 ± 3.27 | |
| WD | 1.21 ± 0.29 | 0.14 ± 0.04 | 1.37 ± 0.31 | 3.95 ± 1.34 | 1.13 ± 0.27 | 0.12 ± 0.04 | 1.72 ± 0.54 | 5.92 ± 2.34 | |
| WE | 1.74 ± 0.15 | 0.28 ± 0.08 | 1.80 ± 0.45 | 3.63 ± 0.69 | 0.96 ± 0.14 | 0.24 ± 0.04 | 2.81 ± 0.30 | 10.77 ± 3.27 | |
| WF | 1.26 ± 0.27 | 0.21 ± 0.09 | 1.96 ± 0.64 | 3.51 ± 1.47 | 1.02 ± 0.49 | 0.14 ± 0.02 | 1.95 ± 0.68 | 7.65 ± 1.55 | |
| WG | 1.06 ± 0.15 | 0.14 ± 0.02 | 1.02 ± 0.16 | 2.24 ± 0.69 | 0.71 ± 0.09 | 0.10 ± 0.01 | 1.54 ± 0.28 | 6.96 ± 3.40 | |
| WH | 1.00 ± 0.19 | 0.18 ± 0.08 | 1.82 ± 0.77 | 2.30 ± 0.69 | 0.80 ± 0.11 | 0.19 ± 0.05 | 1.88 ± 0.48 | 7.23 ± 3.21 | |
| WI | 1.55 ± 0.36 | 0.24 ± 0.17 | 1.53 ± 0.52 | 4.03 ± 1.24 | 1.11 ± 0.29 | 0.27 ± 0.09 | 3.04 ± 1.43 | 6.16 ± 1.23 | |
| WJ | 1.14 ± 0.12 | 0.18 ± 0.02 | 1.68 ± 0.16 | 3.56 ± 0.75 | 1.40 ± 0.30 | 0.22 ± 0.09 | 2.43 ± 0.61 | 5.72 ± 0.79 | |
| WK | 1.15 ± 0.12 | 0.15 ± 0.04 | 1.27 ± 0.34 | 3.65 ± 1.08 | 1.51 ± 0.46 | 0.10 ± 0.04 | 2.10 ± 0.34 | 7.82 ± 4.22 | |
| WL | 0.89 ± 0.11 | 0.11 ± 0.04 | 0.96 ± 0.20 | 2.67 ± 1.11 | 0.81 ± 0.12 | 0.08 ± 0.02 | 1.29 ± 0.30 | 5.93 ± 2.75 | |
| WM | 1.35 ± 0.26 | 0.18 ± 0.05 | 2.37 ± 0.70 | 3.51 ± 1.01 | 1.34 ± 0.25 | 0.16 ± 0.02 | 2.29 ± 0.37 | 5.85 ± 2.62 | |
| WN | 1.41 ± 0.34 | 0.12 ± 0.03 | 2.41 ± 0.41 | 2.45 ± 0.37 | 0.50 ± 0.06 | 0.04 ± 0.01 | 1.73 ± 0.24 | 9.53 ± 2.97 | |
| WO | 1.34 ± 0.15 | 0.11 ± 0.03 | 1.41 ± 0.23 | 2.17 ± 0.67 | 0.47 ± 0.09 | 0.08 ± 0.02 | 1.43 ± 0.17 | 9.35 ± 3.00 | |
| WP | 1.45 ± 0.10 | 0.08 ± 0.03 | 2.33 ± 0.48 | 2.57 ± 0.24 | 0.50 ± 0.06 | 0.05 ± 0.01 | 1.17 ± 0.11 | 7.99 ± 1.94 | |
| WQ | 0.99 ± 0.22 | 0.05 ± 0.02 | 1.71 ± 0.83 | 1.44 ± 0.22 | 0.34 ± 0.09 | 0.04 ± 0.02 | 0.88 ± 0.26 | 6.72 ± 1.58 | |
| WR | 0.77 ± 0.15 | 0.05 ± 0.01 | 1.01 ± 0.20 | 1.48 ± 0.59 | 0.27 ± 0.05 | 0.03 ± 0.01 | 0.73 ± 0.16 | 5.87 ± 2.33 | |
| WS | 2.91 ± 0.89 | 0.17 ± 0.04 | 2.78 ± 1.12 | 1.70 ± 0.39 | 0.60 ± 0.14 | 0.10 ± 0.02 | 1.60 ± 0.39 | 13.39 ± 5.75 | |
| WT | 1.36 ± 0.14 | 0.09 ± 0.01 | 1.34 ± 0.15 | 1.24 ± 0.14 | 0.38 ± 0.05 | 0.06 ± 0.01 | 1.09 ± 0.10 | 7.71 ± 2.25 | |
| RA | 0.92 ± 0.27 | 0.10 ± 0.04 | 2.14 ± 1.49 | 1.93 ± 0.55 | 0.22 ± 0.08 | 0.03 ± 0.01 | 1.08 ± 0.28 | 4.66 ± 0.64 | |
| RB | 1.41 ± 0.26 | 0.14 ± 0.12 | 5.94 ± 2.13 | 14.19 ± 11.86 | 0.96 ± 0.15 | 0.14 ± 0.08 | 3.05 ± 0.57 | 2.67 ± 1.06 | |
| RC | 1.33 ± 0.07 | 0.08 ± 0.02 | 1.96 ± 0.27 | 2.30 ± 0.27 | 0.31 ± 0.11 | 0.04 ± 0.02 | 1.51 ± 0.16 | 6.35 ± 2.01 | |
| RD | 1.00 ± 0.18 | 0.09 ± 0.05 | 3.02 ± 0.97 | 3.17 ± 0.26 | 0.36 ± 0.07 | 0.05 ± 0.02 | 1.52 ± 0.27 | 4.07 ± 0.95 | |
| RE | 1.11 ± 0.06 | 0.07 ± 0.02 | 2.29 ± 0.50 | 2.65 ± 0.51 | 0.31 ± 0.08 | 0.05 ± 0.03 | 1.28 ± 0.19 | 5.71 ± 1.52 | |
| RF | 1.16 ± 0.18 | 0.12 ± 0.08 | 3.21 ± 0.45 | 4.28 ± 1.55 | 0.68 ± 0.08 | 0.11 ± 0.03 | 2.06 ± 0.60 | 2.83 ± 1.22 |
Relative response ratios of fatty acids identified in rice grains.
| 2-Butenoate_3TBS | Docosanoate | Dodecanoate | Eicosanoate | Heptadecanoic_acid | Hexadecanoate | Linoleic_acid | Nonanoate | Octadecadienoate | |
| WA | 1.22 ± 0.42 | 1.96 ± 0.51 | 3.20 ± 1.51 | 1.03 ± 0.14 | 0.41 ± 0.05 | 255.99 ± 53.85 | 200.52 ± 37.36 | 1.59 ± 0.27 | 52.55 ± 8.73 |
| WB | 3.88 ± 1.96 | 10.27 ± 2.73 | 17.04 ± 4.25 | 4.04 ± 0.37 | 1.24 ± 0.24 | 1228.45 ± 316.44 | 859.35 ± 180.72 | 9.65 ± 1.66 | 161.62 ± 28.40 |
| WC | 1.12 ± 0.15 | 4.86 ± 0.74 | 7.66 ± 3.27 | 2.85 ± 0.32 | 0.91 ± 0.30 | 554.52 ± 68.07 | 390.27 ± 41.35 | 4.70 ± 0.95 | 106.73 ± 27.57 |
| WD | 0.87 ± 0.28 | 3.84 ± 0.27 | 7.96 ± 2.06 | 2.10 ± 0.27 | 0.85 ± 0.11 | 470.04 ± 39.41 | 318.63 ± 40.44 | 5.12 ± 0.75 | 81.18 ± 39.47 |
| WE | 1.31 ± 0.42 | 2.25 ± 0.22 | 4.15 ± 1.19 | 1.14 ± 0.13 | 0.44 ± 0.06 | 280.65 ± 29.54 | 218.31 ± 27.60 | 2.96 ± 0.61 | 52.61 ± 4.25 |
| WF | 1.78 ± 0.40 | 2.08 ± 0.63 | 5.96 ± 2.69 | 1.31 ± 0.31 | 0.61 ± 0.13 | 252.58 ± 75.65 | 173.16 ± 61.48 | 4.36 ± 0.80 | 41.54 ± 14.65 |
| WG | 0.90 ± 0.12 | 1.98 ± 0.30 | 3.26 ± 0.63 | 1.57 ± 0.36 | 0.53 ± 0.16 | 235.60 ± 36.16 | 144.35 ± 18.09 | 2.50 ± 0.46 | 41.75 ± 5.73 |
| WH | 0.81 ± 0.25 | 2.13 ± 0.91 | 2.64 ± 0.84 | 1.45 ± 0.47 | 0.47 ± 0.10 | 260.51 ± 79.43 | 200.64 ± 55.40 | 2.37 ± 0.65 | 55.74 ± 15.26 |
| WI | 1.21 ± 0.29 | 3.07 ± 1.01 | 5.37 ± 1.32 | 1.17 ± 0.18 | 0.46 ± 0.07 | 401.68 ± 129.29 | 226.06 ± 7.90 | 4.39 ± 2.94 | 47.23 ± 14.35 |
| WJ | 0.98 ± 0.23 | 5.44 ± 0.92 | 7.48 ± 2.88 | 3.05 ± 0.48 | 0.63 ± 0.27 | 663.60 ± 84.41 | 437.54 ± 25.17 | 4.50 ± 0.70 | 120.29 ± 13.30 |
| WK | 1.02 ± 0.35 | 4.36 ± 0.89 | 6.32 ± 1.64 | 2.70 ± 0.68 | 1.34 ± 0.44 | 554.53 ± 132.31 | 302.66 ± 107.36 | 6.29 ± 2.02 | 93.54 ± 18.59 |
| WL | 0.92 ± 0.23 | 3.68 ± 0.91 | 6.59 ± 3.49 | 2.38 ± 0.44 | 0.69 ± 0.14 | 466.78 ± 92.15 | 287.92 ± 73.94 | 4.72 ± 0.92 | 91.14 ± 15.37 |
| WM | 1.39 ± 0.85 | 4.73 ± 0.91 | 8.22 ± 1.99 | 2.36 ± 0.66 | 3.49 ± 6.34 | 613.59 ± 150.61 | 302.30 ± 118.00 | 5.88 ± 3.21 | 92.68 ± 35.42 |
| WN | 0.62 ± 0.18 | 1.33 ± 0.26 | 6.00 ± 1.81 | 2.37 ± 0.73 | 0.61 ± 0.09 | 228.90 ± 32.26 | 122.48 ± 35.45 | 3.14 ± 0.40 | 73.99 ± 25.94 |
| WO | 0.42 ± 0.03 | 1.17 ± 0.29 | 2.05 ± 0.41 | 1.79 ± 0.36 | 0.60 ± 0.08 | 184.63 ± 35.10 | 95.31 ± 12.51 | 2.32 ± 0.49 | 49.27 ± 10.11 |
| WP | 0.54 ± 0.06 | 1.13 ± 0.24 | 3.78 ± 0.71 | 1.88 ± 0.28 | 0.64 ± 0.05 | 181.58 ± 12.91 | 119.17 ± 21.89 | 3.05 ± 0.41 | 78.61 ± 17.43 |
| WQ | 0.42 ± 0.20 | 1.08 ± 0.20 | 2.92 ± 0.48 | 2.18 ± 1.03 | 0.52 ± 0.07 | 196.11 ± 35.17 | 126.78 ± 25.53 | 2.30 ± 0.55 | 85.95 ± 35.78 |
| WR | 0.37 ± 0.11 | 0.70 ± 0.13 | 2.03 ± 0.63 | 1.52 ± 0.21 | 0.47 ± 0.10 | 129.09 ± 10.18 | 74.02 ± 9.22 | 1.72 ± 0.48 | 53.14 ± 20.00 |
| WS | 0.25 ± 0.05 | 0.92 ± 0.32 | 2.77 ± 0.87 | 2.43 ± 0.78 | 0.65 ± 0.15 | 169.79 ± 62.67 | 112.20 ± 49.29 | 2.54 ± 0.17 | 90.03 ± 31.15 |
| WT | 0.31 ± 0.10 | 0.91 ± 0.22 | 2.43 ± 1.56 | 1.96 ± 0.82 | 0.50 ± 0.17 | 152.18 ± 39.61 | 101.09 ± 29.81 | 2.14 ± 0.24 | 70.64 ± 25.60 |
| RA | 1.22 ± 0.51 | 1.31 ± 0.32 | 3.50 ± 0.64 | 1.25 ± 0.15 | 0.39 ± 0.04 | 204.89 ± 48.73 | 87.59 ± 26.16 | 3.91 ± 1.46 | 33.72 ± 18.30 |
| RB | 1.91 ± 0.71 | 8.77 ± 3.09 | 23.33 ± 13.30 | 3.15 ± 0.42 | 0.83 ± 0.12 | 1416.12 ± 568.54 | 127.99 ± 57.69 | 28.78 ± 10.59 | 7.04 ± 8.44 |
| RC | 1.03 ± 0.21 | 1.08 ± 0.20 | 4.84 ± 1.35 | 1.19 ± 0.29 | 0.50 ± 0.10 | 183.24 ± 13.67 | 98.97 ± 14.11 | 4.26 ± 1.02 | 34.26 ± 10.98 |
| RD | 1.04 ± 0.15 | 2.53 ± 0.80 | 7.24 ± 4.56 | 1.76 ± 0.46 | 0.57 ± 0.13 | 352.22 ± 61.30 | 96.95 ± 26.42 | 8.37 ± 3.79 | 23.24 ± 13.00 |
| RE | 0.78 ± 0.33 | 1.42 ± 0.53 | 6.63 ± 3.24 | 1.35 ± 0.85 | 0.42 ± 0.10 | 220.18 ± 61.35 | 95.71 ± 61.31 | 5.30 ± 1.24 | 34.97 ± 30.42 |
| RF | 1.13 ± 0.27 | 3.45 ± 1.70 | 5.52 ± 1.89 | 2.11 ± 0.50 | 0.58 ± 0.19 | 731.97 ± 307.47 | 166.80 ± 35.31 | 10.95 ± 4.49 | 25.57 ± 16.65 |
| Octadecanoate | 2-Oxobutanoate | 2-Oxobutyrate | 2-Oxovaleric_acid | Pentadecanoate | Phytanate | Tetracosanoate | Tetradecandioate | Tricosanoate | |
| WA | 117.75 ± 31.53 | 1.25 ± 0.25 | 0.21 ± 0.03 | 0.38 ± 0.07 | 1.13 ± 0.51 | 5.81 ± 1.29 | 4.69 ± 1.35 | 1.74 ± 1.10 | 1.06 ± 0.37 |
| WB | 677.54 ± 179.61 | 2.46 ± 0.83 | 1.12 ± 0.78 | 2.31 ± 0.70 | 8.10 ± 5.74 | 34.34 ± 8.71 | 16.11 ± 3.96 | 3.45 ± 1.35 | 3.91 ± 1.14 |
| WC | 228.53 ± 51.74 | 1.15 ± 0.30 | 0.25 ± 0.07 | 0.92 ± 0.27 | 2.97 ± 1.88 | 15.16 ± 1.75 | 7.65 ± 1.78 | 1.07 ± 0.20 | 1.64 ± 0.38 |
| WD | 281.38 ± 32.16 | 1.07 ± 0.38 | 0.41 ± 0.42 | 1.02 ± 0.14 | 2.76 ± 0.44 | 11.16 ± 8.19 | 5.95 ± 1.73 | 0.98 ± 0.19 | 1.21 ± 0.19 |
| WE | 146.01 ± 22.09 | 1.40 ± 0.26 | 0.24 ± 0.05 | 0.53 ± 0.07 | 1.72 ± 0.35 | 6.76 ± 0.88 | 4.93 ± 1.18 | 1.32 ± 0.39 | 1.36 ± 0.14 |
| WF | 165.03 ± 47.24 | 0.75 ± 0.12 | 0.32 ± 0.10 | 0.63 ± 0.18 | 1.89 ± 0.62 | 7.04 ± 2.27 | 3.56 ± 1.48 | 1.78 ± 0.59 | 0.92 ± 0.42 |
| WG | 155.54 ± 30.26 | 0.89 ± 0.15 | 0.59 ± 0.51 | 0.62 ± 0.13 | 1.56 ± 0.47 | 6.75 ± 1.05 | 3.34 ± 0.77 | 0.97 ± 0.24 | 0.76 ± 0.13 |
| WH | 139.95 ± 36.88 | 1.12 ± 0.33 | 0.34 ± 0.09 | 0.50 ± 0.17 | 1.24 ± 0.44 | 7.06 ± 3.01 | 3.98 ± 1.91 | 0.80 ± 0.26 | 0.86 ± 0.42 |
| WI | 210.13 ± 72.10 | 2.18 ± 0.66 | 0.36 ± 0.11 | 0.69 ± 0.30 | 1.97 ± 0.86 | 10.05 ± 3.58 | 6.85 ± 2.33 | 1.10 ± 0.19 | 1.29 ± 0.31 |
| WJ | 261.02 ± 55.27 | 1.67 ± 0.48 | 0.39 ± 0.13 | 0.79 ± 0.13 | 2.75 ± 0.54 | 17.60 ± 3.20 | 9.82 ± 2.34 | 0.97 ± 0.21 | 1.74 ± 0.25 |
| WK | 314.28 ± 83.37 | 1.18 ± 0.14 | 0.89 ± 1.22 | 1.23 ± 0.27 | 2.66 ± 0.77 | 14.49 ± 3.61 | 9.16 ± 1.96 | 0.92 ± 0.26 | 1.40 ± 0.30 |
| WL | 220.86 ± 27.74 | 1.08 ± 0.24 | 0.40 ± 0.37 | 0.93 ± 0.11 | 1.93 ± 0.54 | 11.89 ± 2.23 | 6.13 ± 1.65 | 0.85 ± 0.23 | 1.32 ± 0.42 |
| WM | 256.75 ± 70.43 | 1.44 ± 0.23 | 0.83 ± 1.24 | 0.91 ± 0.09 | 2.30 ± 0.57 | 15.81 ± 3.69 | 7.93 ± 2.28 | 0.98 ± 0.41 | 1.38 ± 0.29 |
| WN | 122.44 ± 20.31 | 0.91 ± 0.33 | 0.15 ± 0.04 | 0.89 ± 0.14 | 1.11 ± 0.14 | 5.25 ± 1.00 | 2.00 ± 0.20 | 0.55 ± 0.14 | 0.33 ± 0.24 |
| WO | 88.73 ± 13.73 | 0.92 ± 0.19 | 0.14 ± 0.03 | 0.60 ± 0.05 | 1.31 ± 0.99 | 3.65 ± 0.91 | 2.12 ± 0.47 | 0.33 ± 0.10 | 0.30 ± 0.09 |
| WP | 115.12 ± 5.11 | 0.87 ± 0.30 | 0.15 ± 0.03 | 0.83 ± 0.10 | 1.03 ± 0.15 | 4.41 ± 0.46 | 1.88 ± 0.51 | 0.33 ± 0.09 | 0.41 ± 0.27 |
| WQ | 87.64 ± 14.73 | 0.73 ± 0.15 | 0.12 ± 0.09 | 0.57 ± 0.08 | 0.82 ± 0.12 | 4.28 ± 0.28 | 1.75 ± 0.47 | 0.26 ± 0.03 | 0.28 ± 0.01 |
| WR | 64.20 ± 17.99 | 0.48 ± 0.14 | 0.10 ± 0.03 | 0.43 ± 0.16 | 0.69 ± 0.31 | 2.64 ± 0.37 | 1.31 ± 0.19 | 0.27 ± 0.09 | 0.17 ± 0.09 |
| WS | 73.56 ± 16.61 | 0.97 ± 0.11 | 0.11 ± 0.05 | 0.57 ± 0.21 | 0.80 ± 0.19 | 3.62 ± 1.33 | 1.42 ± 0.40 | 0.18 ± 0.04 | 0.23 ± 0.15 |
| WT | 61.33 ± 11.79 | 0.57 ± 0.08 | 0.11 ± 0.01 | 0.37 ± 0.06 | 0.64 ± 0.14 | 3.33 ± 0.79 | 1.55 ± 0.37 | 0.21 ± 0.07 | 0.29 ± 0.21 |
| RA | 117.80 ± 39.12 | 0.86 ± 0.33 | 0.19 ± 0.07 | 0.79 ± 0.23 | 1.23 ± 0.25 | 4.63 ± 1.05 | 2.78 ± 0.89 | 0.62 ± 0.06 | 0.26 ± 0.25 |
| RB | 656.06 ± 229.14 | 5.80 ± 1.73 | 0.88 ± 0.45 | 4.13 ± 1.09 | 7.52 ± 2.56 | 30.85 ± 10.63 | 18.67 ± 6.40 | 1.98 ± 0.80 | 0.07 ± 0.05 |
| RC | 119.58 ± 20.12 | 0.83 ± 0.24 | 0.18 ± 0.05 | 0.90 ± 0.26 | 1.13 ± 0.18 | 4.32 ± 0.63 | 2.30 ± 0.38 | 0.55 ± 0.13 | 0.46 ± 0.39 |
| RD | 211.74 ± 84.84 | 2.33 ± 0.59 | 0.32 ± 0.07 | 1.38 ± 0.64 | 3.02 ± 1.34 | 9.42 ± 3.46 | 4.82 ± 0.91 | 0.65 ± 0.27 | 0.26 ± 0.12 |
| RE | 138.35 ± 22.30 | 1.33 ± 0.13 | 0.21 ± 0.15 | 1.01 ± 0.22 | 1.52 ± 0.22 | 5.79 ± 1.75 | 2.43 ± 0.82 | 0.48 ± 0.20 | 0.28 ± 0.18 |
| RF | 269.11 ± 94.93 | 2.32 ± 0.79 | 0.39 ± 0.19 | 1.49 ± 0.40 | 3.39 ± 1.26 | 12.92 ± 5.91 | 6.46 ± 2.44 | 0.57 ± 0.16 | 0.14 ± 0.13 |
Relative response ratios of organic acids identified in rice grains.
| Trans-aconitate_4TBS | Ascorbate | Citrate | Fumarate | Galactonate | Gluconate | Glycerate | Glycerate-3-P | Glycolate | Isocitrate | |
| WA | 0.23 ± 0.13 | 0.09 ± 0.03 | 4.06 ± 1.05 | 0.62 ± 0.21 | 85.27 ± 10.03 | 36.29 ± 14.49 | 0.63 ± 0.11 | 0.52 ± 0.16 | 4.38 ± 1.95 | 0.25 ± 0.11 |
| WB | 1.50 ± 1.30 | 0.40 ± 0.20 | 2.93 ± 0.75 | 2.37 ± 1.16 | 388.09 ± 72.23 | 66.19 ± 17.05 | 3.38 ± 1.06 | 3.66 ± 1.26 | 22.31 ± 14.90 | 0.46 ± 0.48 |
| WC | 0.45 ± 0.25 | 0.17 ± 0.08 | 2.81 ± 0.65 | 1.18 ± 0.88 | 278.51 ± 46.13 | 27.75 ± 4.19 | 1.47 ± 0.15 | 1.33 ± 0.50 | 8.79 ± 5.78 | 0.20 ± 0.11 |
| WD | 0.43 ± 0.33 | 0.17 ± 0.10 | 1.88 ± 1.16 | 1.00 ± 0.25 | 170.94 ± 60.97 | 27.96 ± 8.99 | 1.55 ± 0.30 | 1.36 ± 0.28 | 10.06 ± 5.54 | 0.19 ± 0.10 |
| WE | 0.26 ± 0.12 | 0.11 ± 0.04 | 1.88 ± 0.92 | 0.62 ± 0.24 | 112.98 ± 13.88 | 40.93 ± 8.07 | 0.56 ± 0.08 | 0.66 ± 0.29 | 5.46 ± 2.39 | 0.18 ± 0.08 |
| WF | 0.27 ± 0.13 | 0.07 ± 0.04 | 3.93 ± 1.51 | 0.76 ± 0.19 | 171.16 ± 39.34 | 25.46 ± 1.52 | 0.54 ± 0.09 | 0.94 ± 0.31 | 7.06 ± 3.95 | 0.14 ± 0.11 |
| WG | 0.23 ± 0.18 | 0.05 ± 0.03 | 2.38 ± 0.75 | 0.75 ± 0.35 | 159.62 ± 17.14 | 31.49 ± 7.55 | 0.59 ± 0.24 | 0.72 ± 0.29 | 5.72 ± 3.50 | 0.11 ± 0.07 |
| WH | 0.25 ± 0.15 | 0.08 ± 0.07 | 4.49 ± 2.00 | 0.81 ± 0.34 | 132.05 ± 10.62 | 22.35 ± 2.04 | 0.92 ± 0.74 | 0.62 ± 0.12 | 5.68 ± 4.14 | 0.15 ± 0.14 |
| WI | 0.25 ± 0.07 | 0.20 ± 0.12 | 1.93 ± 0.63 | 1.65 ± 1.21 | 127.83 ± 14.42 | 44.62 ± 16.12 | 1.25 ± 0.56 | 1.00 ± 0.30 | 7.98 ± 5.25 | 0.14 ± 0.09 |
| WJ | 0.42 ± 0.28 | 0.15 ± 0.08 | 2.12 ± 0.78 | 1.00 ± 0.26 | 93.14 ± 13.77 | 24.66 ± 4.24 | 2.41 ± 0.64 | 1.22 ± 0.64 | 7.25 ± 3.71 | 0.14 ± 0.06 |
| WK | 0.49 ± 0.42 | 0.20 ± 0.13 | 3.17 ± 1.90 | 1.01 ± 0.67 | 129.62 ± 17.49 | 26.65 ± 3.68 | 1.29 ± 0.28 | 1.11 ± 0.34 | 8.99 ± 5.46 | 0.21 ± 0.15 |
| WL | 0.45 ± 0.26 | 0.17 ± 0.04 | 2.54 ± 0.63 | 1.15 ± 0.33 | 121.53 ± 9.69 | 25.81 ± 5.51 | 1.67 ± 0.53 | 1.12 ± 0.19 | 7.22 ± 5.13 | 0.10 ± 0.08 |
| WM | 0.43 ± 0.47 | 0.24 ± 0.21 | 2.96 ± 1.17 | 1.31 ± 0.89 | 203.57 ± 15.05 | 51.41 ± 61.62 | 2.61 ± 1.02 | 1.06 ± 0.47 | 7.94 ± 4.95 | 0.12 ± 0.04 |
| WN | 0.38 ± 0.19 | 0.05 ± 0.03 | 7.01 ± 1.82 | 0.62 ± 0.25 | 31.55 ± 8.59 | 226.03 ± 21.83 | 0.61 ± 0.07 | 0.26 ± 0.16 | 7.76 ± 2.15 | 0.08 ± 0.05 |
| WO | 0.28 ± 0.26 | 0.04 ± 0.01 | 5.98 ± 1.38 | 0.53 ± 0.14 | 39.28 ± 5.14 | 234.82 ± 41.60 | 0.59 ± 0.13 | 0.21 ± 0.14 | 5.38 ± 1.84 | 0.06 ± 0.03 |
| WP | 0.34 ± 0.23 | 0.05 ± 0.02 | 9.87 ± 2.04 | 0.79 ± 0.06 | 480.10 ± 67.88 | 309.25 ± 40.30 | 0.34 ± 0.04 | 0.22 ± 0.17 | 7.45 ± 2.86 | 0.05 ± 0.01 |
| WQ | 0.37 ± 0.08 | 0.03 ± 0.01 | 9.87 ± 6.29 | 0.52 ± 0.14 | 186.08 ± 1.64 | 178.12 ± 35.93 | 0.37 ± 0.12 | 0.17 ± 0.09 | 4.15 ± 1.56 | 0.04 ± 0.01 |
| WR | 0.24 ± 0.11 | 0.02 ± 0.01 | 5.83 ± 0.73 | 0.32 ± 0.15 | 49.10 ± 4.26 | 96.59 ± 9.36 | 0.22 ± 0.02 | 0.13 ± 0.07 | 4.12 ± 2.36 | 0.02 ± 0.01 |
| WS | 0.24 ± 0.10 | 0.02 ± 0.01 | 6.62 ± 4.15 | 0.38 ± 0.12 | 17.39 ± 2.21 | 98.00 ± 5.46 | 0.91 ± 0.23 | 0.11 ± 0.09 | 4.44 ± 2.64 | 0.03 ± 0.01 |
| WT | 0.24 ± 0.05 | 0.02 ± 0.01 | 6.84 ± 1.66 | 0.45 ± 0.13 | 23.23 ± 3.08 | 90.19 ± 26.11 | 0.50 ± 0.04 | 0.08 ± 0.08 | 3.43 ± 1.35 | 0.02 ± 0.01 |
| RA | 0.44 ± 0.17 | 0.05 ± 0.02 | 5.16 ± 0.49 | 0.67 ± 0.28 | 15.85 ± 6.35 | 144.60 ± 24.19 | 0.43 ± 0.14 | 0.38 ± 0.24 | 8.41 ± 4.69 | 0.05 ± 0.03 |
| RB | 1.48 ± 1.44 | 0.89 ± 0.30 | 11.89 ± 5.29 | 7.67 ± 1.83 | 22.78 ± 5.90 | 149.77 ± 46.76 | 3.99 ± 1.27 | 1.31 ± 0.47 | 42.15 ± 17.29 | 0.92 ± 0.25 |
| RC | 0.66 ± 0.52 | 0.04 ± 0.03 | 9.95 ± 2.00 | 0.62 ± 0.17 | 51.19 ± 8.07 | 186.33 ± 22.85 | 0.37 ± 0.07 | 0.15 ± 0.14 | 8.99 ± 3.58 | 0.05 ± 0.02 |
| RD | 0.96 ± 0.25 | 0.10 ± 0.06 | 8.04 ± 1.64 | 1.28 ± 0.50 | 25.28 ± 2.90 | 104.93 ± 38.53 | 1.31 ± 0.21 | 0.54 ± 0.41 | 11.88 ± 7.94 | 0.04 ± 0.01 |
| RE | 0.54 ± 0.09 | 0.05 ± 0.02 | 7.72 ± 3.96 | 0.74 ± 0.14 | 27.41 ± 5.99 | 177.00 ± 24.29 | 0.70 ± 0.41 | 0.24 ± 0.10 | 8.63 ± 2.70 | 0.06 ± 0.03 |
| RF | 0.73 ± 0.49 | 0.14 ± 0.09 | 6.07 ± 0.78 | 7.87 ± 7.67 | 21.76 ± 5.07 | 73.65 ± 41.80 | 2.36 ± 0.94 | 0.37 ± 0.08 | 14.29 ± 5.70 | 0.16 ± 0.08 |
| Malate | Malonate | Muconate | Oxaloacetate | Sinapinate | Succinate | Tartrate | Threonate_4TBS | Urate | ||
| WA | 2.29 ± 0.94 | 0.23 ± 0.04 | 0.48 ± 0.26 | 1.66 ± 0.70 | 1.31 ± 0.41 | 0.79 ± 0.23 | 5.38 ± 2.01 | 0.12 ± 0.01 | 0.40 ± 0.33 | |
| WB | 6.89 ± 3.00 | 0.97 ± 0.32 | 0.82 ± 0.34 | 5.07 ± 2.72 | 3.82 ± 1.00 | 5.00 ± 2.67 | 19.31 ± 6.74 | 0.49 ± 0.14 | 0.61 ± 0.40 | |
| WC | 1.91 ± 0.59 | 0.35 ± 0.07 | 0.26 ± 0.07 | 2.13 ± 0.80 | 1.75 ± 0.45 | 1.50 ± 0.34 | 8.02 ± 1.37 | 0.17 ± 0.06 | 0.15 ± 0.04 | |
| WD | 2.54 ± 0.70 | 0.39 ± 0.11 | 0.22 ± 0.09 | 2.13 ± 0.76 | 1.58 ± 0.08 | 1.51 ± 0.33 | 6.89 ± 3.07 | 0.13 ± 0.02 | 2.52 ± 5.97 | |
| WE | 1.50 ± 0.83 | 0.30 ± 0.03 | 0.49 ± 0.15 | 2.03 ± 0.30 | 1.13 ± 0.23 | 0.83 ± 0.28 | 6.69 ± 1.08 | 0.14 ± 0.03 | 0.47 ± 0.88 | |
| WF | 1.74 ± 0.66 | 0.35 ± 0.07 | 0.51 ± 0.20 | 3.21 ± 0.88 | 1.79 ± 0.63 | 1.08 ± 0.46 | 5.95 ± 1.98 | 0.12 ± 0.03 | 0.17 ± 0.26 | |
| WG | 1.86 ± 0.75 | 0.29 ± 0.02 | 0.25 ± 0.09 | 1.59 ± 0.57 | 1.28 ± 0.32 | 0.91 ± 0.22 | 4.70 ± 0.60 | 0.11 ± 0.02 | 0.06 ± 0.05 | |
| WH | 2.07 ± 0.92 | 0.34 ± 0.11 | 0.26 ± 0.14 | 1.46 ± 0.70 | 1.24 ± 0.31 | 1.15 ± 0.60 | 3.91 ± 0.74 | 0.17 ± 0.13 | 0.06 ± 0.03 | |
| WI | 2.45 ± 1.23 | 0.61 ± 0.28 | 0.50 ± 0.17 | 1.88 ± 0.70 | 1.62 ± 0.34 | 1.59 ± 0.65 | 7.10 ± 2.50 | 0.39 ± 0.20 | 0.20 ± 0.34 | |
| WJ | 4.25 ± 1.62 | 0.39 ± 0.08 | 0.28 ± 0.08 | 1.65 ± 0.41 | 1.66 ± 0.25 | 1.68 ± 0.41 | 6.13 ± 0.93 | 0.35 ± 0.13 | 2.44 ± 4.42 | |
| WK | 2.61 ± 1.03 | 0.55 ± 0.13 | 0.26 ± 0.13 | 1.95 ± 0.77 | 1.51 ± 0.64 | 1.35 ± 0.51 | 6.21 ± 0.98 | 0.15 ± 0.08 | 1.82 ± 2.62 | |
| WL | 3.55 ± 1.78 | 0.46 ± 0.07 | 0.20 ± 0.06 | 1.70 ± 0.57 | 1.10 ± 0.14 | 1.58 ± 0.69 | 6.04 ± 1.23 | 0.19 ± 0.07 | 0.18 ± 0.23 | |
| WM | 3.98 ± 1.91 | 0.45 ± 0.13 | 0.33 ± 0.14 | 2.15 ± 0.91 | 1.62 ± 0.35 | 1.89 ± 0.83 | 7.06 ± 1.88 | 0.26 ± 0.10 | 1.13 ± 2.25 | |
| WN | 1.33 ± 0.25 | 0.35 ± 0.06 | 0.21 ± 0.04 | 1.25 ± 0.91 | 0.34 ± 0.07 | 0.82 ± 0.12 | 2.87 ± 0.39 | 0.05 ± 0.02 | 0.17 ± 0.12 | |
| WO | 1.21 ± 0.38 | 0.32 ± 0.08 | 0.19 ± 0.04 | 0.60 ± 0.28 | 0.51 ± 0.14 | 0.71 ± 0.20 | 2.22 ± 0.30 | 0.06 ± 0.02 | 0.06 ± 0.02 | |
| WP | 1.29 ± 0.16 | 0.31 ± 0.04 | 0.22 ± 0.16 | 0.90 ± 0.26 | 1.08 ± 0.14 | 1.03 ± 0.12 | 3.68 ± 0.24 | 0.04 ± 0.02 | 0.73 ± 0.83 | |
| WQ | 0.87 ± 0.10 | 0.20 ± 0.03 | 0.12 ± 0.01 | 0.64 ± 0.09 | 0.62 ± 0.07 | 0.64 ± 0.22 | 1.99 ± 0.30 | 0.03 ± 0.02 | 0.56 ± 0.05 | |
| WR | 0.44 ± 0.09 | 0.19 ± 0.07 | 0.11 ± 0.04 | 0.63 ± 0.18 | 0.41 ± 0.05 | 0.36 ± 0.05 | 1.35 ± 0.29 | 0.03 ± 0.01 | 0.14 ± 0.02 | |
| WS | 0.97 ± 0.65 | 0.25 ± 0.07 | 0.08 ± 0.02 | 0.42 ± 0.11 | 0.45 ± 0.12 | 0.60 ± 0.16 | 0.99 ± 0.19 | 0.06 ± 0.02 | 0.19 ± 0.14 | |
| WT | 1.09 ± 0.30 | 0.22 ± 0.05 | 0.10 ± 0.02 | 0.44 ± 0.13 | 0.43 ± 0.09 | 0.54 ± 0.04 | 1.06 ± 0.29 | 0.05 ± 0.01 | 0.13 ± 0.17 | |
| RA | 1.21 ± 0.63 | 0.32 ± 0.16 | 0.32 ± 0.13 | 2.29 ± 1.38 | 1.04 ± 0.17 | 0.86 ± 0.31 | 3.19 ± 1.72 | 0.07 ± 0.04 | 0.12 ± 0.11 | |
| RB | 21.13 ± 32.05 | 2.81 ± 0.94 | 1.42 ± 0.56 | 3.96 ± 1.22 | 3.01 ± 0.96 | 4.75 ± 1.75 | 10.01 ± 3.04 | 0.57 ± 0.16 | 0.85 ± 0.75 | |
| RC | 1.13 ± 0.27 | 0.26 ± 0.12 | 0.28 ± 0.03 | 2.15 ± 0.41 | 0.69 ± 0.13 | 0.63 ± 0.17 | 3.07 ± 0.23 | 0.05 ± 0.02 | 0.04 ± 0.03 | |
| RD | 2.11 ± 0.91 | 0.64 ± 0.09 | 0.34 ± 0.15 | 1.85 ± 1.06 | 1.09 ± 0.51 | 1.26 ± 0.36 | 3.95 ± 0.85 | 0.14 ± 0.09 | 0.59 ± 1.62 | |
| RE | 1.56 ± 0.25 | 0.34 ± 0.10 | 0.22 ± 0.12 | 1.57 ± 1.01 | 0.81 ± 0.17 | 0.74 ± 0.09 | 3.27 ± 0.25 | 0.08 ± 0.05 | 0.90 ± 1.45 | |
| RF | 4.88 ± 2.34 | 0.90 ± 0.30 | 0.56 ± 0.18 | 1.49 ± 0.52 | 1.85 ± 0.66 | 2.34 ± 1.05 | 4.86 ± 1.46 | 0.45 ± 0.22 | 0.23 ± 0.21 |
Relative response ratios of sugar and sugar alcohols identified in rice grains.
| Arabitol | Fructose_MX1 | Glucose_MX1 | Glycerol | Glycerol_2TBS | Glycerol-3-P | Inositol | Sorbitol | Sucrose | Xylitol | |
| WA | 1.39 ± 0.15 | 131.52 ± 21.01 | 77.17 ± 18.37 | 6.69 ± 3.67 | 12.30 ± 4.08 | 2.22 ± 1.08 | 59.80 ± 5.57 | 776.72 ± 260.98 | 408.37 ± 49.11 | 2.53 ± 0.37 |
| WB | 7.29 ± 0.91 | 240.51 ± 32.15 | 76.38 ± 19.62 | 18.49 ± 10.41 | 31.92 ± 10.56 | 6.71 ± 0.72 | 171.60 ± 32.97 | 2256.15 ± 623.67 | 284.52 ± 47.81 | 9.50 ± 2.87 |
| WC | 3.39 ± 0.92 | 181.13 ± 28.50 | 54.28 ± 13.82 | 6.36 ± 2.13 | 11.97 ± 5.55 | 2.61 ± 0.54 | 78.70 ± 9.87 | 1103.85 ± 354.55 | 166.52 ± 83.13 | 4.37 ± 1.18 |
| WD | 11.67 ± 9.48 | 140.99 ± 30.60 | 51.59 ± 17.11 | 6.95 ± 3.92 | 13.18 ± 5.33 | 2.64 ± 0.98 | 70.96 ± 12.93 | 1205.08 ± 442.91 | 172.33 ± 71.31 | 6.12 ± 2.12 |
| WE | 2.05 ± 0.28 | 103.82 ± 7.60 | 88.01 ± 29.64 | 9.12 ± 3.72 | 14.87 ± 3.95 | 2.62 ± 1.80 | 61.99 ± 4.14 | 871.11 ± 574.59 | 613.29 ± 186.87 | 2.74 ± 1.10 |
| WF | 1.70 ± 0.38 | 52.93 ± 6.66 | 55.74 ± 14.88 | 9.13 ± 3.44 | 14.71 ± 7.97 | 5.78 ± 1.30 | 51.81 ± 7.54 | 971.25 ± 251.73 | 1109.02 ± 292.19 | 4.54 ± 2.77 |
| WG | 2.33 ± 0.75 | 70.92 ± 11.31 | 57.95 ± 10.19 | 7.20 ± 3.23 | 9.03 ± 2.75 | 3.49 ± 0.81 | 41.73 ± 2.62 | 940.97 ± 195.60 | 390.93 ± 118.71 | 4.61 ± 1.79 |
| WH | 4.36 ± 3.88 | 82.35 ± 33.77 | 54.95 ± 13.90 | 10.81 ± 5.07 | 16.82 ± 15.42 | 4.30 ± 3.54 | 46.61 ± 8.59 | 828.11 ± 330.14 | 454.83 ± 161.85 | 3.65 ± 1.29 |
| WI | 7.17 ± 3.12 | 102.60 ± 13.34 | 78.28 ± 36.48 | 20.16 ± 11.52 | 23.27 ± 7.58 | 5.75 ± 3.72 | 65.75 ± 11.07 | 854.87 ± 509.47 | 415.50 ± 158.08 | 6.18 ± 4.83 |
| WJ | 7.48 ± 2.12 | 100.32 ± 10.39 | 47.12 ± 16.47 | 24.59 ± 11.42 | 30.01 ± 9.00 | 3.71 ± 0.73 | 56.62 ± 3.56 | 933.78 ± 222.69 | 288.26 ± 61.15 | 5.16 ± 1.50 |
| WK | 3.09 ± 0.36 | 119.23 ± 16.08 | 51.64 ± 14.50 | 9.49 ± 4.09 | 14.40 ± 8.61 | 2.75 ± 1.65 | 67.46 ± 4.12 | 1218.52 ± 218.90 | 256.99 ± 83.15 | 2.84 ± 1.07 |
| WL | 3.21 ± 0.63 | 125.79 ± 15.09 | 51.32 ± 11.28 | 14.11 ± 4.51 | 16.11 ± 5.77 | 8.27 ± 14.14 | 65.44 ± 5.17 | 1100.89 ± 222.36 | 224.04 ± 33.97 | 12.87 ± 21.00 |
| WM | 9.76 ± 2.03 | 111.11 ± 23.51 | 57.22 ± 7.03 | 17.01 ± 10.70 | 20.72 ± 5.92 | 5.70 ± 1.57 | 62.58 ± 3.34 | 1011.22 ± 205.55 | 428.40 ± 156.38 | 4.88 ± 0.95 |
| WN | 3.96 ± 1.23 | 152.44 ± 39.62 | 56.82 ± 36.24 | 5.51 ± 2.32 | 8.12 ± 3.06 | 19.31 ± 4.26 | 96.23 ± 7.30 | 938.64 ± 947.51 | 179.99 ± 34.85 | 3.24 ± 0.53 |
| WO | 4.59 ± 0.63 | 114.01 ± 11.24 | 43.79 ± 10.69 | 9.28 ± 4.64 | 14.72 ± 2.82 | 44.02 ± 9.31 | 93.37 ± 8.34 | 1238.87 ± 535.40 | 248.52 ± 49.63 | 6.12 ± 0.99 |
| WP | 3.84 ± 1.08 | 121.54 ± 20.32 | 68.49 ± 25.09 | 6.95 ± 3.53 | 10.60 ± 2.45 | 21.02 ± 0.96 | 94.19 ± 5.36 | 1566.54 ± 660.36 | 145.93 ± 25.27 | 2.47 ± 0.20 |
| WQ | 2.88 ± 0.79 | 94.30 ± 12.56 | 53.90 ± 16.84 | 9.15 ± 5.84 | 8.68 ± 2.58 | 13.28 ± 3.17 | 55.54 ± 5.91 | 1265.70 ± 288.20 | 171.45 ± 14.66 | 2.53 ± 1.22 |
| WR | 1.71 ± 0.26 | 61.19 ± 6.98 | 40.39 ± 11.54 | 7.47 ± 4.51 | 7.79 ± 1.54 | 11.61 ± 2.98 | 42.22 ± 5.16 | 613.20 ± 600.44 | 418.72 ± 129.77 | 1.90 ± 0.24 |
| WS | 6.00 ± 3.40 | 103.65 ± 18.75 | 56.26 ± 21.62 | 9.75 ± 2.87 | 10.88 ± 5.45 | 19.29 ± 6.33 | 92.85 ± 30.28 | 414.07 ± 606.77 | 102.68 ± 13.35 | 2.68 ± 0.36 |
| WT | 4.96 ± 0.86 | 59.64 ± 7.31 | 36.67 ± 13.38 | 12.13 ± 4.91 | 13.72 ± 1.90 | 18.36 ± 7.52 | 59.62 ± 6.98 | 547.85 ± 406.65 | 375.38 ± 105.29 | 10.23 ± 2.33 |
| RA | 5.31 ± 5.03 | 53.23 ± 16.91 | 54.52 ± 9.75 | 15.92 ± 9.33 | 19.59 ± 9.29 | 16.04 ± 6.15 | 43.43 ± 6.98 | 725.27 ± 726.71 | 661.16 ± 160.95 | 5.57 ± 1.60 |
| RB | 4.90 ± 0.96 | 143.02 ± 32.91 | 124.53 ± 26.85 | 52.34 ± 33.64 | 63.98 ± 23.84 | 8.76 ± 1.28 | 81.16 ± 12.28 | 1272.33 ± 560.34 | 48.49 ± 16.03 | 2.89 ± 0.56 |
| RC | 1.89 ± 0.29 | 68.87 ± 8.02 | 74.53 ± 29.10 | 11.99 ± 5.09 | 15.85 ± 3.46 | 11.23 ± 1.58 | 70.64 ± 3.86 | 946.88 ± 747.85 | 753.86 ± 188.69 | 2.90 ± 1.91 |
| RD | 3.03 ± 0.51 | 177.61 ± 61.53 | 107.33 ± 40.48 | 27.14 ± 9.57 | 27.77 ± 14.71 | 9.63 ± 1.38 | 81.15 ± 15.11 | 1124.15 ± 365.68 | 311.50 ± 119.04 | 4.30 ± 0.10 |
| RE | 2.63 ± 1.46 | 106.85 ± 10.20 | 76.20 ± 34.26 | 13.07 ± 1.61 | 14.63 ± 3.51 | 13.37 ± 3.57 | 63.80 ± 9.83 | 729.47 ± 925.03 | 588.24 ± 888.96 | 4.80 ± 4.85 |
| RF | 2.70 ± 1.03 | 128.78 ± 38.15 | 44.45 ± 6.32 | 57.43 ± 29.42 | 67.15 ± 27.88 | 27.05 ± 2.10 | 55.28 ± 7.40 | 794.42 ± 333.04 | 181.38 ± 23.79 | 4.51 ± 2.16 |
Relative response ratios of phenols, sterols and other compounds identified in rice grains.
| Acetohydroxamate | 4-Coumarate | Ferulate_2TBS | 4-Hydroxybenzoate_2TBS | 4-Hydroxycinnamate | Campesterol | Fucosterol | Beta-sitosterol | Adenine_2TBS | Ethanolamine_3TMS | Guanine | Phosphate | Urea | |
| WA | 72.56 ± 7.47 | 3.17 ± 0.83 | 2.57 ± 0.75 | 1.64 ± 0.78 | 0.31 ± 0.04 | 0.52 ± 0.15 | 0.57 ± 0.07 | 9.90 ± 1.66 | 0.30 ± 0.06 | 16.60 ± 4.35 | 332.15 ± 26.00 | 101.65 ± 22.70 | 1.28 ± 0.32 |
| WB | 452.32 ± 100.34 | 17.20 ± 3.96 | 10.33 ± 2.09 | 6.54 ± 2.40 | 1.90 ± 0.44 | 1.13 ± 0.43 | 1.17 ± 0.28 | 22.33 ± 2.07 | 0.81 ± 0.28 | 42.59 ± 7.75 | 2036.26 ± 436.70 | 493.74 ± 121.40 | 7.07 ± 3.52 |
| WC | 191.73 ± 35.05 | 6.92 ± 0.78 | 4.63 ± 0.77 | 2.16 ± 0.53 | 0.79 ± 0.19 | 0.65 ± 0.13 | 0.42 ± 0.08 | 9.68 ± 1.48 | 0.34 ± 0.04 | 21.76 ± 4.82 | 801.76 ± 148.95 | 165.45 ± 19.84 | 3.03 ± 1.32 |
| WD | 194.99 ± 12.75 | 5.59 ± 0.75 | 3.89 ± 0.69 | 2.14 ± 0.41 | 0.79 ± 0.09 | 0.54 ± 0.12 | 0.53 ± 0.13 | 10.16 ± 1.60 | 0.30 ± 0.10 | 20.17 ± 3.54 | 808.04 ± 136.92 | 174.16 ± 57.78 | 3.23 ± 0.40 |
| WE | 101.71 ± 12.75 | 3.72 ± 0.85 | 3.53 ± 0.39 | 1.44 ± 0.32 | 0.49 ± 0.08 | 0.79 ± 0.29 | 0.64 ± 0.14 | 12.17 ± 1.13 | 0.35 ± 0.05 | 21.08 ± 3.45 | 504.83 ± 67.62 | 121.82 ± 11.83 | 4.00 ± 0.60 |
| WF | 116.61 ± 29.07 | 3.11 ± 1.23 | 4.23 ± 1.29 | 1.15 ± 0.40 | 0.53 ± 0.12 | 0.55 ± 0.15 | 0.64 ± 0.24 | 11.67 ± 1.16 | 0.25 ± 0.06 | 22.24 ± 5.56 | 548.35 ± 138.33 | 130.68 ± 30.61 | 7.14 ± 6.12 |
| WG | 118.95 ± 15.83 | 2.54 ± 0.47 | 3.56 ± 0.54 | 0.92 ± 0.21 | 0.54 ± 0.06 | 0.55 ± 0.18 | 1.32 ± 2.34 | 9.10 ± 1.63 | 0.22 ± 0.03 | 21.08 ± 3.03 | 566.15 ± 64.34 | 105.87 ± 11.82 | 2.44 ± 0.98 |
| WH | 95.30 ± 18.79 | 3.29 ± 1.28 | 3.42 ± 1.00 | 0.85 ± 0.37 | 0.42 ± 0.10 | 3.52 ± 8.98 | 0.93 ± 0.24 | 9.52 ± 0.79 | 0.22 ± 0.07 | 18.14 ± 5.94 | 495.52 ± 68.35 | 139.17 ± 36.61 | 3.19 ± 0.62 |
| WI | 134.94 ± 55.27 | 3.74 ± 0.34 | 5.00 ± 1.63 | 1.55 ± 0.77 | 0.62 ± 0.26 | 0.84 ± 0.31 | 2.34 ± 3.52 | 12.06 ± 3.03 | 0.42 ± 0.06 | 17.61 ± 3.63 | 696.25 ± 310.37 | 221.14 ± 64.41 | 2.76 ± 0.92 |
| WJ | 160.41 ± 31.28 | 17.97 ± 25.91 | 4.85 ± 0.54 | 1.71 ± 0.33 | 0.69 ± 0.14 | 0.58 ± 0.09 | 1.55 ± 1.76 | 10.38 ± 0.55 | 0.33 ± 0.07 | 20.89 ± 5.29 | 815.69 ± 178.81 | 238.25 ± 61.68 | 8.28 ± 4.21 |
| WK | 241.49 ± 66.48 | 5.99 ± 2.06 | 4.87 ± 0.74 | 1.69 ± 0.39 | 0.97 ± 0.18 | 4.18 ± 7.62 | 1.34 ± 0.85 | 10.79 ± 0.27 | 0.39 ± 0.12 | 31.38 ± 8.94 | 1045.59 ± 178.45 | 224.69 ± 41.33 | 2.50 ± 0.32 |
| WL | 179.15 ± 17.42 | 5.43 ± 1.43 | 3.02 ± 0.53 | 1.30 ± 0.25 | 0.76 ± 0.09 | 4.78 ± 9.19 | 7.65 ± 10.79 | 9.18 ± 1.29 | 0.27 ± 0.11 | 22.72 ± 4.34 | 822.29 ± 72.47 | 201.65 ± 54.84 | 3.52 ± 1.06 |
| WM | 188.34 ± 49.00 | 5.28 ± 2.40 | 3.96 ± 0.90 | 1.60 ± 0.48 | 0.79 ± 0.18 | 0.50 ± 0.12 | 1.85 ± 3.19 | 9.45 ± 1.38 | 0.32 ± 0.08 | 21.54 ± 5.52 | 830.05 ± 217.00 | 241.17 ± 92.79 | 2.92 ± 0.55 |
| WN | 125.47 ± 14.90 | 2.58 ± 0.63 | 0.82 ± 0.14 | 1.51 ± 0.87 | 0.69 ± 0.10 | 0.24 ± 0.11 | 0.16 ± 0.07 | 7.31 ± 1.10 | 0.21 ± 0.05 | 16.04 ± 4.42 | 746.31 ± 38.41 | 253.44 ± 47.29 | 3.25 ± 0.50 |
| WO | 84.23 ± 9.67 | 2.00 ± 0.24 | 0.90 ± 0.12 | 1.02 ± 0.11 | 0.48 ± 0.08 | 0.34 ± 0.14 | 0.19 ± 0.15 | 9.02 ± 1.13 | 0.22 ± 0.05 | 24.39 ± 6.91 | 565.70 ± 86.14 | 271.41 ± 72.99 | 4.16 ± 0.57 |
| WP | 122.20 ± 7.76 | 1.86 ± 0.46 | 1.43 ± 0.23 | 1.29 ± 0.19 | 0.74 ± 0.13 | 0.68 ± 0.29 | 0.31 ± 0.18 | 11.76 ± 1.68 | 0.24 ± 0.07 | 21.03 ± 2.59 | 652.94 ± 31.48 | 329.16 ± 17.99 | 3.23 ± 0.57 |
| WQ | 84.16 ± 4.67 | 2.30 ± 0.43 | 1.13 ± 0.30 | 0.85 ± 0.23 | 0.57 ± 0.06 | 0.38 ± 0.09 | 0.27 ± 0.05 | 7.06 ± 1.08 | 0.17 ± 0.01 | 13.59 ± 3.52 | 444.53 ± 9.57 | 178.52 ± 34.65 | 3.60 ± 1.15 |
| WR | 63.15 ± 15.90 | 1.43 ± 0.23 | 0.84 ± 0.12 | 0.54 ± 0.04 | 0.38 ± 0.06 | 0.42 ± 0.15 | 0.18 ± 0.11 | 6.38 ± 0.99 | 0.12 ± 0.02 | 16.25 ± 5.81 | 350.26 ± 99.18 | 104.37 ± 12.79 | 3.04 ± 0.64 |
| WS | 75.89 ± 17.34 | 1.99 ± 0.87 | 0.87 ± 0.28 | 0.53 ± 0.11 | 0.43 ± 0.10 | 0.31 ± 0.09 | 0.17 ± 0.14 | 7.49 ± 0.83 | 0.12 ± 0.06 | 10.87 ± 1.68 | 444.15 ± 105.66 | 337.65 ± 73.15 | 3.34 ± 1.23 |
| WT | 51.30 ± 5.61 | 2.01 ± 0.64 | 0.75 ± 0.07 | 0.43 ± 0.06 | 0.29 ± 0.04 | 0.24 ± 0.09 | 0.17 ± 0.06 | 7.41 ± 0.77 | 0.11 ± 0.03 | 15.60 ± 3.12 | 330.73 ± 66.54 | 193.59 ± 14.73 | 5.09 ± 1.48 |
| RA | 121.38 ± 26.92 | 0.97 ± 0.27 | 1.72 ± 0.55 | 0.79 ± 0.28 | 0.66 ± 0.11 | 0.34 ± 0.18 | 0.18 ± 0.30 | 6.72 ± 0.90 | 0.21 ± 0.05 | 11.36 ± 1.68 | 818.11 ± 261.75 | 125.34 ± 27.49 | 7.47 ± 2.44 |
| RB | 621.44 ± 196.63 | 1.10 ± 0.48 | 10.30 ± 4.64 | 5.18 ± 1.83 | 3.71 ± 1.75 | 0.00 ± 0.00 | 0.00 ± 0.00 | 0.95 ± 0.25 | 0.67 ± 0.38 | 4.47 ± 0.79 | 3805.73 ± 1262.88 | 447.67 ± 56.40 | 9.20 ± 3.53 |
| RC | 133.94 ± 18.97 | 1.95 ± 0.26 | 1.84 ± 0.33 | 0.60 ± 0.07 | 0.75 ± 0.11 | 0.64 ± 0.19 | 0.31 ± 0.16 | 11.79 ± 1.12 | 0.21 ± 0.03 | 14.45 ± 3.26 | 741.83 ± 100.28 | 204.20 ± 32.15 | 5.19 ± 1.25 |
| RD | 203.66 ± 89.52 | 1.38 ± 0.66 | 2.57 ± 0.62 | 1.60 ± 0.51 | 1.09 ± 0.42 | 0.64 ± 1.11 | 0.08 ± 0.00 | 5.15 ± 1.01 | 0.36 ± 0.04 | 8.22 ± 2.18 | 1292.99 ± 516.46 | 253.74 ± 46.45 | 9.19 ± 2.98 |
| RE | 152.69 ± 24.39 | 1.55 ± 1.19 | 1.82 ± 0.19 | 0.93 ± 0.16 | 0.85 ± 0.16 | 1.23 ± 2.08 | 0.55 ± 1.07 | 6.02 ± 1.56 | 0.27 ± 0.07 | 13.11 ± 3.43 | 964.75 ± 172.38 | 189.90 ± 49.09 | 5.28 ± 1.03 |
| RF | 203.48 ± 70.32 | 2.12 ± 0.85 | 3.49 ± 1.08 | 1.95 ± 0.70 | 1.12 ± 0.24 | 0.52 ± 0.89 | 0.00 ± 0.00 | 2.88 ± 1.61 | 0.34 ± 0.08 | 4.81 ± 1.50 | 1308.27 ± 478.13 | 168.57 ± 28.80 | 6.21 ± 1.33 |
Table 2 shows the relative response ratios of 17 amino acids identified in the rice grains. These were alanine, beta-alanine, allantoin, asparagines, aspartic acid, γ-aminobutyric acid (GABA), glutamate, glycine, homoserine, leucine, phenylalanine, proline, pyroglutamate, serine, threonine, tyrosine, and valine. The amount of each amino acid differed between the varieties significantly except valine. Semiquantitative analyses on the basis of relative response ratios indicated that alanine level was highest in WB and lowest in RF. Beta-alanine level was also highest in WB and lowest in RB. The grains of WB contained highest amount of GABA, glutamate, tyrosine and valine. Asparagine level was highest in the grains of WI. The grains of RB contained high level of allantoin, glycine, homoserine and proline.
Eighteen fatty acids could be detected in the rice grains (Table 3). These were 2-butanoate, docosanoate, dodecanoate, eicosanoate, heptadecanoic acid, hexadecanoate, linoleic acid, nonanoate, octadecadienoate, octadecanoate, 2-oxobutyrate, pentadecanoate, 2-oxovaleric acid, pentadecanoate, phytanate, tetracosanoate, tetradecandioate, and tricosanoate. Each fatty acid differed between varieties significantly except eicosanoate, heptadecanoic acid and octadecadienoate. The rice grains WB and RB are rich in fatty acids. Highest amount of amount of 2-butanoate, docosanoate, eicosanoate, linoleic acid, octadecadienoate, octadecanoate, 2-oxobutyrate, pentadecanoate, phytanate, tetradecanoate, tricosanoate were observed in WB. RB contained highest level of dodecanoate, hexadecanoate, nonanoate, 2-oxobutanoate, 2-oxovaleric acid and tetracosanoate.
Nineteen organic acids could be detected in different varieties of rice grains (Table 4). These were trans-aconitate, ascorbate, citrate, fumarate, galactonate, gluconate, glycerate, glycerate-3-phosphate, glycolate, isocitrate, malate, malonate, muconate, oxaloacetate, sinapinate, succinate, tartarate, threonate, urate. Each organic acid differed between varieties significantly except galactonate, gluconate and urate. Extracts of both WB and RB contained highest amount of trans-aconitate and sinapinate as estimated from the relative response ratios. Extracts of WB grains contained highest level of glycerate-3-P, oxaloacetate, succinate, tartarate. The grains of RB were found to contain highest level of ascorbate, citrate, fumarate, glycerate, glycolate, isocitrate, malate and threonate. High fumarate and gluconate content was recorded in WP.
Nine sugars and sugar alcohols (Table 5) were detected in rice grains. These were arabitol, fructose, glucose, glycerol, glycerol-3-P, inositol, sorbitol, sucrose and xylitol. The relative response ratios indicated that the level of these compounds were not significantly different from each other except for glycerol and sucrose. Glycerol level was highest in RB. Sucrose was present in highest amount in WF and in lowest amount in RB.
Five phenols detected (Table 6) were acetohydroxamate, 4-coumarate, ferulate, 4-hydroxybenzoate and 4-hydroxycinnamate which differed significantly between varieties. Of the sterols (campesterol, fucosterol, β-sitosterol) identified in rice grains (Table 6), none differed significantly between varieties.
4 Discussion
Comparison of the metabolites identified in the grains of 26 varieties of rice unveiled diversity in metabolite profile. All data from the different varieties are also summarized in the form of heat map (Fig. 1) for visualization of how the identified metabolite levels differed in varieties. This global perspective of metabolite diversity in rice grains was based on the semi-quantitative information obtained from the relative response ratios. A clear difference in metabolite levels in WB and RB can be observed with most of the metabolites. A clear difference in the levels of many of the amino acids, organic acids, fatty acids, phenols and sterols is also visible for WN, WO, WP, WQ, WR, WS, WT.

Heat map* for visualization of the variation pattern of the identified metabolites in different varieties of rice grains. *Each metabolite marked with colour codes: green for minimum relative response ratio and yellow for maximum relative response ratio. For interpretation of references to colour, see the online version of this article.
Hierarchical clustering was constructed on the basis of the metabolites to extract relevant information for similarity and differences in metabolites in the grains. Cluster analysis unveiled diversity in metabolite profile. Two hierarchical clusters were generated based on the metabolite contents of the rice varieties. The cluster memberships of different varieties are shown in the Fig. 2. The first cluster (cluster I) consisted of RB only. The second cluster again segregated into four clusters (clusters II, III, IV and V). Cluster II consisted of WN, WO, WP, WQ, WR, WS, WT, WE, WH, WI, WG, WA. Cluster III consisted of RA, RE, RC and WF. WB is the only variety in cluster IV. Cluster V consisted of WD, WK, WC, WL, WJ, WM, RD and RF. Mean value of each metabolite in each cluster was calculated and compared graphically with that of other clusters. Metabolite levels were categorized into three types based on the level (mean values) of relative response ratios of each metabolite in each cluster in the 26 varieties e.g. high (above 80% of the highest value), moderate (40%–80% of the highest value), low (less than 40% of the highest value). Such graphs of 58 metabolites were mapped on the known biosynthetic pathway (Fig. 3). This comprehensive and comparative analysis revealed how the clusters varied from each other. Prominent metabolic characters of the clusters have been pointed out in the Table 7. Very distinct differences are visible in cluster I and cluster IV with respect to their organic acid, amino acid and fatty acid profiles. The first cluster (Cluster I) could be characterized by its high organic acids (except galactonate, oxaloacetate and tartarate) and no/low sterols. The grains contained high phenols except 4-coumarate. Rice grains in the second cluster had low to moderate organic acids and moderate to high sterols. Under the second cluster, cluster IV was distinct for its high amino acids (except proline), fatty acids, sugar alcohols, high oxaloacetate, tartarate and moderate to high phenols. Clusters II and III could be differentiated on the basis of sucrose content which was high in cluster III. Cluster V contained high campesterol and fucosterol.
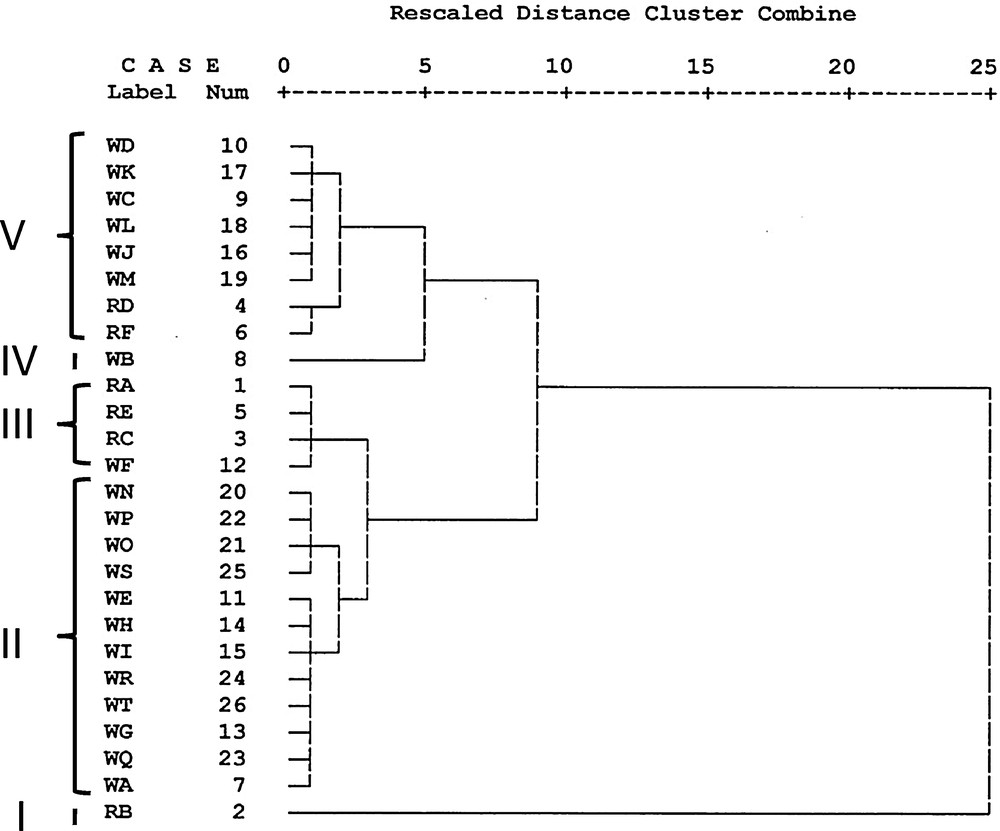
Cluster membership of different varieties of rice grains.

Mapping of comparative metabolite level in five clusters on the biosynthetic pathway.
Characterization of clusters on the basis of metabolite level.
| Organic acids high (except tartarate, galactonate, oxaloacetate, glycerate-3-P) |
Organic acids low to moderate (except tartarate, oxaloacetate,succinate, glycerate-3-P) Sterols moderate to high |
|||
| Fatty acids low Phenols low |
Fatty acids, moderate to high | |||
| Phenols high (except 4-coumarate) Sterols no/low CLUSTER I |
Sucrose moderate CLUSTER II |
Sucrose high CLUSTER III |
Fatty acids high Amino acids high (except proline) Tartarate, oxaloacetate, succinate, glycerate-3-P high Phenols high (except 4-hydroxycinnamate) CLUSTER IV |
All other metabolites low to moderate Campesterol and fucosterol high CLUSTER V |
Metabolites such as carbohydrates, organic and amino acids, vitamins, hormones, flavonoids, phenolics, and glucosinolates are essential for plant growth, development, stress adaptation, and defence. Besides the importance for the plant itself, such metabolites determine the nutritional quality of food, colour, taste, smell, antioxidative, anticarcinogenic, antihypertension, anti-inflammatory, antimicrobial, immunostimulating, and cholesterol-lowering properties [19]. From a consumer perspective, the focus on value-added traits, especially improved nutrition, is of greatest interest [20]. In addition to the taste and aroma, nutritional quality is to be added to assess the quality of grains in the staple food rice. Repositories of information on the natural variation in nutrients available in cultivars and varieties of different food crops [21] are necessary. Present investigation on metabolites of rice grains clearly reveals how the rice cultivars vary in organic acid, fatty acid, amino acid, phenol, sterol and other metabolic constituents. As all these cultivars are edible, this and future efforts on the metabolite information would help biochemists and nutritionists to better understand the nutritional quality of such grains at varietal level and correlating rice food composition and long term human health related issues. In addition, such information would also help plant breeders to develop nutritionally rich rice grains.
GC-MS is mostly used for the metabolome analysis. But it is not sufficient for a comprehensive analysis of plant metabolites as it is limited to those classes of compounds that are or can be made volatile, and thus can pass the GC separation under the conditions applied [22]. Other methods like LC–MS or NMR may provide more information regarding the metabolite pattern in rice grains.
Disclosure of interest
The authors declare that they have no conflicts of interest concerning this article.
Acknowledgement
Authors acknowledge with thanks to Prof. A. Bacic and Dr. U. Roessner, University of Melbourne and the Victorian node of Metabolomics Australia for GC-MS analysis. B.D. acknowledges Endeavour Executive Award by the Australian Government.