

1 Introduction
Urban soils refer to the soils that are distributed in city areas and could be extensively affected by human activities like sealing, compaction, degradation, landfilling, and mixing [1]. Therefore, the characteristics of urban soils, including the levels of pH and organic matter, can be significantly different from those in non-urban soils [2,3]. Soil pH is an indicator of the acidity or alkalinity of soil, and it is a reflection of the important physical and chemical properties of soil quality [4]. Soil pH also has a profound impact on a number of other soil properties. Extremes in acidity or alkalinity will change the nutrients available and result in element imbalances in plants [5]. Soil organic matter (SOM) is a complex mixture, which influences a number of soil properties and nutrient cycling [6]. The content of SOM, and its quality, is regarded as a key factor for the capacity of soils to sustain biological productivity, to maintain environmental quality, and to promote plant and animal health [7,8]. There is considerable concern that, if SOM concentrations in soils are allowed to decrease too much, then the productive capacity of agriculture will be compromised by deterioration in soil physical properties and by impairment of soil nutrient cycling mechanisms. This has clear implications for the sustainable use of soil [6].
With the increase of population and the development of economy, land use types have changed greatly in urban areas, which result in a greater influence on ecological environment. Soil pH and SOM are very sensitive to human activities [9,10]. Understanding the spatial variability of the two factors in urban soils is therefore important for designing land use patterns and making soil management decisions. However, substantial research on distribution characteristics of urban soil properties has been carried out in metropolitan and developed areas [1,11–15], while little has been done in medium-sized cities, particularly about the newly developing cities. In recent years, the economy of some medium-sized cities has a soaring, prosperous and strong growth with the accelerated process of urbanization and industrialization in China. Physical and chemical properties of the soils in these regions could be seriously influenced simultaneously.
In this study, some soil samples were collected from a medium-sized city, Xuzhou, and the data of soil pH values and SOM contents were analyzed using statistical and geostatistical methods. This work aims at determining the spatial distribution of soil pH and organic matters, to describe and understand the spatial variability of soil property status and to analyze the factors affecting soil chemical properties. This information can be also used to provide some important basis for ecological restoration and reconstruction of degraded ecosystem in newly developing cities in China as well as in similar areas around the world.
2 Materials and methods
2.1 Study area
Xuzhou city (the geographical position being N33°43′-34°58′ and E116°22′-118°40′) is located in the northwest of Jiangsu province and is contiguous to Shandong, Henan, and Anhui provinces. It approximately covers an area of 11,570 km2 and had a population of 9.5 million in the end of 2010, accounting for 11.2% and 12.5% of the total in Jiangsu province, respectively. The climate is characterized by warm temperate monsoon climate with an annual average temperature of 14.2 °C and an annual precipitation of 847.9 mm, the frost-free period being about 210 days. Precipitation is not evenly distributed throughout the year and more than 55% of it falls during the summer months [16].
Under the jurisdiction of Xuzhou city are five administrative districts: Yunlong, Gulou, Quanshan, Tongshan, and Jiawang, which are urban areas of the city. In addition, there are three counties (Suining, Fengxian, and Peixian) and two county-ranked cities (Xinyi and Pizhou) in Xuzhou city. In the urban areas, the three districts (Yunlong, Gulou and Quanshan) are located in the central portion, mostly surrounded by Tongshan District and the rest by Jiawang District. In order to maintain continuity and representativeness of the study area, the central urban districts (34°08′-22′N and 117°04′-27′E, including Yunlong, Gulou and Quanshan) were selected as the studied object. In the study area, the dominant soils are cinnamon, brown and fluvo-aquic soils and the zonal vegetation is deciduous broad-leaved forest [16].
2.2 Soil sampling
The sampling sites are shown on Fig. 1. According to the grid method, every eight sites were arranged in a size of 10 km × 10 km for soil sampling. At each site, 3–5 surface soil samples at 0–20 cm depth were collected within a 10-m radius, and bulked for analysis. A total of 172 soil samples were collected with a stainless steel shovel in the autumn of 2010.

Sketch map of the sampling points distribution in the study area.
The sampling space coordinates were recorded by using GPS, and the sample distribution map was generated by projection transformation by using ArcGIS software. About 1 kg of mixed surface soils for each sample point was taken, and brought back to the laboratory to be air-dried at room temperature (20–25 °C) for 7 days, and then, plant roots, leaves and stones were removed. Soil samples were mashed in a grinding bowl and passed through a nylon sieve with 40 meshes.
2.3 Chemical analysis
Soil pH was measured by adding deionized water (25 mL) to the appropriate soil sample (10 g) before pH reading using a calibrated pH meter [17]. Organic matters content (CSOM) was determined by oil bath–K2CrO7 titration method [18].
2.4 Data analysis
Data were subjected to descriptive analysis using Statistical Package for Social Science software (SPSS 18.0) for Windows. The mean, minimum and maximum, standard deviation, skewness, kurtosis, and coefficient of variation (CV) were computed for each soil parameter to describe the central trend and spread of the soil properties datasets. The CV was mainly used to assess the variability of the different data sets. Exploratory data analysis for outliers and normality tests were conducted.
The semi-variogram analysis and kriging interpolation were performed by ArcGIS 9.2. Prior to geostatistical analyses, the data were examined for the presence of trend. Trend in the variation signals a departure from the intrinsic hypothesis in which the process is assumed to be random and it violates the assumptions on which geostatistics is based on [19]. By removing the trend, it would be possible to more accurately model the variation because the trend will not be influenced by spatial analysis [20].
3 Results and discussion
3.1 Descriptive statistics of soil pH and organic matter in Xuzhou
The descriptive statistics of soil pH and organic matter are presented in Table 1. The soil pH in the central urban districts of Xuzhou basically ranged from neutral (6.47) to alkaline (8.48), with a mean value of 7.62. The pH distribution for soils in China displays a pattern that is acidic in the South and alkaline in the North. Acidic soils are mainly distributed to the south of the Yangtze River, with a total area of approximately 200 million ha [5]. Soil pH in the study area was relatively high, due to alkaline soil inherited from the parent materials in northern China [21]. The SOM contents in the region were low (8.26 g kg−1) but relatively variable. The level was between 3.51 g kg−1 and 17.12 g kg−1, with a coefficient of variation (CV) of 29.12%. The low level and high variability of SOM are mainly due to the effect of land use structure, such as terrace, grassland, and forest [22].
Table 2 shows the quantitative parameters of the probability distribution and significance level of the Kolmogorov–Smirnov test for conformance to a normal distribution for the variables. The skewness and kurtosis of pH were −0.322 and 0.678, respectively, which indicated that the distribution was only slightly skewed and tended to have a distinct peak near the mean. The SOM distribution also has a distinct peak near the mean but relatively right-skewed value (1.353). The Kolmogorov–Smirnov test revealed that soil pH was normally distributed and SOM was not. In order to provide a basis for further structural analysis, it is necessary to apply the normal data, so the abnormal data were transferred to achieve normality using natural logarithm transformation. It is very obvious that natural log-transformed data are much closer to normal distribution than original data. Histograms of SOM contents are shown on Fig. 2. The one corresponding to the raw data set has a long tail towards higher concentrations, whereas that corresponding to the logarithmically transformed dataset can be satisfactorily modeled by a normal distribution.
Quantitative parameters of the probability distributions and significance level of the Kolmogorov–Smirnov test (K–S p) (n = 172).
| Statistics | pH | CSOM(g/kg) | ln(CSOM) |
| Skewness | −0.322 | 1.353 | 0.453 |
| Kurtosis | 0.678 | 2.163 | 0.621 |
| K–S p | 0.382 | 0.002 | 0.151 |
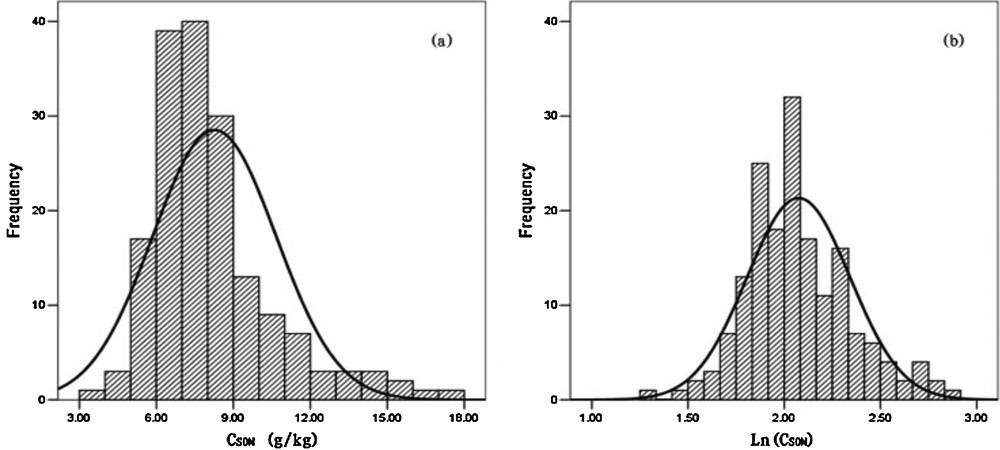
Histograms of soil organic matter contents in study area: a: raw data; b: logarithmically transformed data. Data are shown as mean ± standard deviation (n = 3).
3.2 Semi-variance parameters for soil pH and organic matter in Xuzhou
For studies on spatial distribution of soil properties, geostatistics have been widely used [21,23–29]. Geostatistics, based on a large number of theoretical studies and the regionalized variable theory, is a new statistical branch, and the semi-variance function as the main tool was conducted to examine the spatial structure of the soil properties. The semi-variogram value is calculated using Eq. (1) [29].
| (1) |
The parameters of the modeled variogram include information on:
- • nugget value C0, the level of random variation within the data;
- • structural component C, the level of structure variation within the data;
- • sill (C0 + C), the total variation present;
- • effective range a, the separation distance at which the spatial dependence is apparent.
An especially important parameter, relative structural variance, was calculated as nugget/sill ratio C0/(C0 + C). The ratio can reflect the degree of spatial dependence, the classification proposed by Cambardella et al. [30], which considers that variables have strong spatial correlation if the ratio is less than 25%, 25%–75% implies a medium one and a weak one when the value is more than 75%. Selection of semi-variogram models was made based on the regression coefficient of determination (R2) and reduced sums of squares RSS.
The results of semi-variogram analysis in this study are shown in Table 3. The coefficient of determination (R2) for the two was greater than 0.95, indicating good fits. Soil pH was modeled best with spherical model, whereas SOM with exponential model. Soil pH was strongly spatially dependent with nugget/sill ratios of 21%, predicating that the spatial structured variance accounted for the large proportion of the total sample variance in soil. Usually, strong spatial dependence of soil properties can be attributed to the effects of natural factors, such as the parent material, soil type, climate and soil-forming factors [31]. However, SOM had moderate spatial dependence and its nugget/sill ratio was 44%, indicating that the anthropogenic factors changed its spatial correlation through farming, management practices, industrial production and other human activities [31].
Parameters of the semi-variogram model of soil pH and SOM in study area.
| Variables | Models | Nugget C0 |
Sill C0 + C |
Range a (m) |
Proportion C0/(C0 + C) |
R 2 | RSS |
| Soil pH | Spherical | 0.012 | 0.057 | 9500 | 0.21 | 0.98 | 1.42 × 10⁻⁵ |
| SOM | Exponential | 1.497 | 3.402 | 17,200 | 0.44 | 0.95 | 3.62 × 10⁻⁴ |
The range of the semi-variogram was 9.5 km for soil pH and 17.2 km for SOM. Beyond the ranges, there is no spatial dependence [29]. The soil pH had smaller range 9.5 km, which implies that the length of the spatial dependence is much longer than the sampling interval of 1.5–2.0 km. Therefore, the current sampling design is appropriate for this study.
The different ranges of the spatial dependence between the soil properties may be attributed to differences in response to the erosion–deposition factors, land use-cover, topography, parent material and human and livestock interferences in the study area [29].
3.3 Spatial distribution maps of soil pH and organic matter in Xuzhou
One way to interpret spatial distribution is that of using kriging as an interpolator to obtain values of the measured data at unsampled locations. Kriging equations can be derived employing either covariances, correlograms, or variograms [26]. In our case, we have used variograms to linearly estimate such interpolated values, a search region of 12 nearest-neighbors was applied. For the spatial interpolation, a cell size of 100 m × 100 m was chosen to divide the study area into a grid system containing 243 rows and 200 columns. The final result of this spatial interpolation process was shown on Fig. 3.
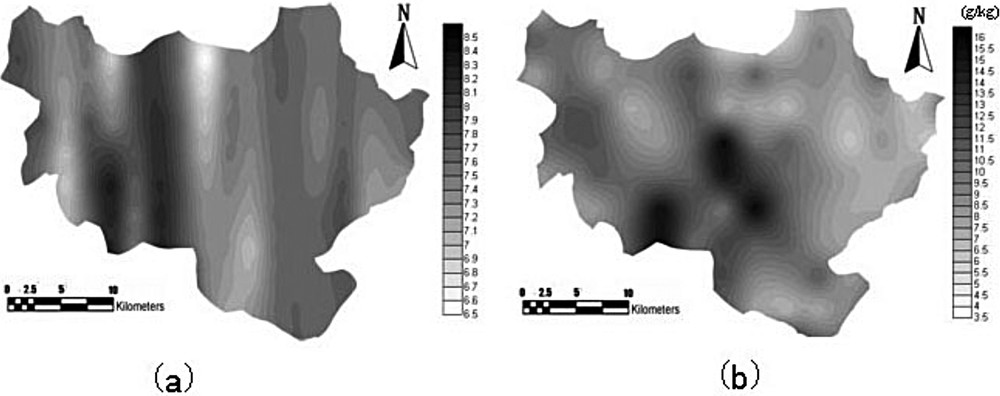
Spatial distribution maps for soil pH (a) and soil organic matter (b).
From the spatial distribution map of pH values, it can be seen evidently that the feature of soil pH and organic matter distributions presents ribbon and plaque shapes in the study area. Overall, low pH and SOM distributed in the east and the north area, and high pH and SOM in the southwest, another high SOM location was in the center. To explore the spatial difference of pH and SOM in the whole area, we extracted some information about site-specific land use forms. The highest pH and SOM spatial distribution was observed due to the mixed forest land cover in the southwest part of the study area (partly located in parks, gardens, and recreation venues). A lower pH location was in central urban areas; the reason should be that the urban soil was influenced by anthropogenic activities [17,24,28]. Dense population and consistent vehicle traffic may be primary factors affecting soil chemical properties, although it is not an industrial site, whereas higher SOM content in this region is probably due to greater organic material inputs [32,33]. According to Beyer et al. [34], anthropogenic organic particles are possible sources of organic matter in urban soils beside natural humic substances. For example, elemental C was found in the most urban soil horizons. However, soil pH and SOM are both relatively low in the east, which is probably linked to anthropic and industrial activity due to its location in one of the most concentrated industrialized areas [35]. Similar results were observed in the north of the field where large-scale coal mining had been performed.
4 Conclusions
The soils in the study area were basically neutral to alkaline and the SOM contents were low but relatively variable. The raw data set of soil pH followed a normal distribution, while SOM followed a log-normal distribution.
The results of semi-variograms indicated that soil pH and SOM had strong and moderate spatial dependence, respectively. The spatial structure of soil pH was fitted by spherical model, whereas SOM by exponential model. The spatial distribution maps based on the Kriging interpolation method were successfully applied in soil property studies, thus it is more indicative for the impact of human activities. The use of geostatistics and GIS proved to be a crucial tool to study spatial variation of soil variables.
Disclosure of interest
The authors declare that they have no conflicts of interest concerning this article.
Acknowledgements
This work has been financially supported by the National Natural Science Foundation of China (Grant No. 20977040). The authors thank the reviewers for their helpful comments and suggestions.