

1 Introduction
Human immunoglobulin (Ig) allotypic polymorphism has permitted to describe several groups of genetic markers. Currently, we know 26 antigenic determinants (allotypes), expressed in both light and heavy immunoglobulin chains. GM allotypes are located in immunoglobulin constant heavy G chain (IGHG) chromosome 14q32.3, and have been the most extensively studied, due to their remarkable polymorphism and linkage disequilibrium. On the other hand, KM locus (2p11.2) has only three allotypes [KM(1), KM(2) and KM(3)] encoded by alleles KM*1, KM*2, and KM*3, respectively [1].
Prior to genomic DNA markers discovery and development, the GM system proved to be an essential complement for those anthropological studies aimed at the reconstruction of population history [2–5]. Some GM haplotypes show particular geographical variation patterns, especially in human populations characterized by a deeply rooted ethnicity [6–12], and this has made the GM system appropriate to detect admixture and gene flow scenarios [13,14].
The Mediterranean basin – where Europe, Asia, and Africa meet – represents a unique space to study recent human history. The Iberian Peninsula is included in such a geographic frame. Its strategic location (at the extreme southwest of Europe and close to Africa), its role as a refuge during the Last Glacial Maximum (LGM) [15,16], and its complex orography and population history related to demographic episodes of isolation, constriction–expansion and gene flow [17] have configured its decisive role in Europe peopling. Within the Iberian Peninsula (598,000 km2), Andalusia (87,598 km2) acquires a special relevance, since it is the most densely inhabited region of Spain from ancient times onwards.
Andalusia has been a human crossroad, a gateway open to many and varied human populations and cultures from all around the Mediterranean basin. Such ancient and long history of human contacts and admixture makes its current autochthonous population a special target for anthropological and genetic studies. One of the most remarkable historical events taking place in the Iberian Peninsula (and especially in Andalusia) was the Islamic rule – lasting in Granada region from AD 711 to 1492 – which implied substantial social, cultural and political changes [18,19].
A number of genetic studies have been published on Andalusian population based on blood group system polymorphisms [20], erythrocyte enzymes [21], leucocyte polymorphisms (HLA class II) [22,23], and DNA autosomal and uniparental markers [24–30]. These surveys show heterogeneous results on the genetic affinity between Andalusia and North Africa – neighbouring western populations specifically. In other words, the Strait of Gibraltar's role in terms of gene flow still remains an unresolved question.
The current growing interest in the Andalusian genetic diversity focuses on the search for population substructure. Recent results obtained by our group on the composition and mtDNA variation in Andalusia [31] reveal high internal complexity and a distinctive influence of U6 and L haplogroups in both eastern and western side of region. Investigating Y-chromosome variability in the same sample sets, we also observe interpopulation genetic differentiation, though in a lesser extent ([32,33], Calderón et al. manuscript in preparation). Both selected territories – Granada and Huelva – are differentiated by their different, complex histories.
Within Europe, French [34] and Iberian populations have been the most widely studied ones in terms of GM and KM immunoglobulin allotypes. Calderón et al. [35,36] highlighted the relatively high frequency of the African GM 1,17 5* haplotype in western Andalusia and neighbouring Atlantic regions. These findings made worthwhile the investigation of whether that African interaction should be also expected in other southern Spanish populations. Therefore, this is one of the principal goals of the present work. Here, we provide the first GM/KM data in eastern Andalusians from Granada, and we compare these data with the existing information from the eastern side of the region (Huelva province). We also evaluate the Andalusian population's substructure and the genetic differentiation between northern and southern Iberian populations (a distance of over 1000 km). The results generated on GM haplotype patterns in Andalusia are then compared with other genetic information emerging from the same sample sets. GM haplotype data permit to take a look at the spatial patterns of this autosomal marker across the Mediterranean, and to evaluate the extent of relationships among Iberian and other Mediterranean populations from Europe, North Africa, and Near/Middle East. Gene flow and genetic affinities in the Mediterranean space are analysed and discussed.
2 Materials and methods
2.1 Samples and genetic characterization
The analysed sample consisted of 195 unrelated individuals of both sexes, randomly selected from the total sample stock (n = 470). These individuals are autochthonous, which means maternal and paternal origins (up to the third generation) in Granada province.
Sampling of people with close genetic kinship may give rise to spurious population structure signals. This deserved special attention from our team during the collection of samples. The procedure was carried out between 2006 and 2008 by medical staff linked to the Blood Transfusion Centre of Granada and members of our team. Every donor was properly informed about the project and signed the corresponding consent, in accordance with the Universal Declaration on Bioethics and Human Rights (UNESCO General Conference) and the Spanish legislation (Law 14/2007, 3 July 2007, for Biomedical Research). This project was approved by the Bioethical Committee of the Complutense University of Madrid.
The sampling procedure was designed by RC following that used in Huelva province in previous studies. When selecting which municipalities to sample (see Fig. 1), historical and population dynamics criteria were applied, and consequently some touristic (including capital city, Granada) and coastal locations were excluded. For the 1900–1990 period, Andalusia represented on average 18.9% of the total Spanish population, with an average density of 59.8/km2 (National Institute of Statistics, in Spanish INE).

(Colour online.) Map of the Iberian Peninsula and Andalusia region highlighting the two Andalusian provinces – selected for genetic studies – and the cities, in black circles, where the sampling process was carried out.
2.2 Laboratory techniques and nomenclature to define GM and KM allotypes
Peripheral blood samples (5–7 mL) were taken from each individual into a vacuum EDTA tube with the help of medical staff. Serum fraction was used for genetic analysis of immunoglobulin allotypes: G1 M (1, 2, 3, 17), G2 M (23), and G3 M (5, 6, 10, 11, 13, 14, 15, 16, 21, 24, 28). In parallel, these samples were analysed for KM allotype (1). Agglutination–inhibition technique was performed [37]. Subsequently, the Restriction Fragment Length Polymorphisms (RFLPs) analysis protocol was also carried out for the characterization of G2M(23) according to [38], modified.
Genotyping work was carried out by specialized staff co-ordinated by Dr. Dugoujon at the Laboratory of Molecular Anthropology and Image Synthesis (AMIS, in French) in Toulouse, France.
The different numeric and alphanumeric nomenclature used for GM allotypes are somewhat complex. When it comes to GM system allotypes, they are named as G1M, G2M, and G3M according to their IgG sub-classes γ1, γ2, and γ3. Thus, IgG1 has 4 allotypes, IgG2 has 1 and IgG3 has 11. There has been no G4M allotype(s) published so far.
For GM allotype specificities, we use a modified numeric nomenclature, as postulated by the World Health Organisation (WHO) [39] and later modified by the International System of Human Gene Nomenclature (ISGN) [40]. Therefore, GM haplotypes are written in italics and allotypes are separated by commas. The notation 23′ indicates that the sample was tested for G2M(23), but was found to be negative for this allotype, and 5* stands for 5,10,11,13,14. Rare GM haplotypes (< 1% occurrence) are included in GM*Others category. There are three kappa chain allotypes designated KM(1), KM(2), and KM(3), which define three alleles KM*1, KM*1,2, and KM*3 (1).
2.3 Genetic and statistical data analysis
GM haplotypes and their frequencies were estimated based on the observed phenotypic distribution, by applying the maximum likelihood method [41] at GENEF2 software. Hardy–Weinberg Equilibrium (HWE) at such frequencies was checked through chi2 test using SPSS Statistics v. 19 (IBM™). Given that serum samples were typified just for KM(1) allotype, we could only detect KM(1) and KM(–1) phenotypes. KM*3 allele frequency was determined using the square root of KM(1) relative frequency. For the sake of comparison, GM and KM allele frequencies obtained in this study are analysed together with those from western Andalusians in Huelva province [35].
Genetic diversity (H) based on the observed GM haplotype frequencies, FST genetic distance matrices [42] and population structure estimates among Mediterranean samples using AMOVA was measured using ARLEQUIN v. 3.5 [43].
A broad, updated GM haplotype database comprising 70 population samples from the Iberian Peninsula, Europe, Africa, Near/Middle East and Southwest Asia (Table S1) has been constructed. Since we found some punctual cases where population GM haplotype frequencies did not amount to one, the values were adjusted for consistency.
Two genetic maps were computed. The first one consists of a Multidimensional Scaling (MDS) analysis [44], based on pair-wise FST genetic distances between 12 studied Iberian populations. The second map is the result of a statistically robust Hierarchical Cluster Analysis (HCA). HCA is performed using a Euclidean distance matrix obtained using Ward's algorithm. To enrich the analysis, our HCA includes a set of Mediterranean populations (n = 43) of special interest for our purposes. Such set comprises a total of 8879 individuals, with a mean sample size of 317 (min = 63, max = 2314). We performed MDS using PROXSCAL (included in the SPSS statistics v. 19 package), and the HCA using SPAD (Système portable pour l’analyse de données in French, [45]).
The correlation between the genetic distance matrix (Slatkin's linearized FST matrix) and the geographic distances (in km) was evaluated. For this purpose, we used the whole set of Mediterranean populations, and a group that included coastal European (n = 14) and North African (n = 15) populations. Mantel test (using Mantel test subprogram with 10000 permutations [46]) was applied. In order to assess the degree of isolation-by-distance (IBD) that might show the structure of Mediterranean populations, we estimated the extent of such correlation using a linear regression analysis [47].
For visualizing spatial distribution patterns of GM*1,17 5′ African haplotype in the continent and the Mediterranean space, surface maps were created using SURFER v. 11 (Golden Software Inc.). Kriging method [48] was applied for interpolations in such maps. A thorough review of genetic diversity geographic patterns and current tools for landscape genetics studies can be found in [49] and [50], respectively.
3 Results
Phenotypic frequencies of GM and KM in western Andalusians from Granada are shown in Table 1. For the sake of comparison, previously observed results in their counterparts from Huelva [35] are presented. The observed, non-shared phenotypes among eastern and western Andalusians were GM*1,17 23′ 10,11,13,15,16,21,28 (1.02%) and GM*1,3,17 23′ 5*,28 (1.02%) in the former, and GM*1,3,17 23 5*,15, 16 (1.19%) and GM*1,2,17 23′ 5* (0.03%) in the latter. No significant deviations from the Hardy–Weinberg equilibrium under the Hardy–Weinberg exact test [51] were obtained.
Observed and expected GM and KM phenotypic frequencies in Granada province (Andalusia). For the sake of comparison, we also show the phenotypic distribution for such genetic polymorphisms in Huelva province (Andalusia).
| Phenotype | East Andalusia Granada |
West Andalusia Huelvaa |
||
| Observed | Expected | Observed | Expected | |
| GM | ||||
| 3 23 5* | 89 | 86.49 | 105 | 111.32 |
| 3 23′ 5* | 8 | 7.92 | 10 | 8.14 |
| 1,17 23′ 21,28 | 13 | 7.75 | 12 | 13.54 |
| 1,2,17 23′ 21,28 | 2 | 4.47 | 3 | 4.27 |
| 1,17 23′ 10,11,13,15,16,21,28 | 2 | 0.36 | 0 | 0.00 |
| 1,3,17 23 5*,21,28 | 35 | 38.44 | 65 | 59.44 |
| 1,3,17 23′ 5*,21,28 | 11 | 15.67 | 21 | 20.99 |
| 1,2,3,17 23 5*,21,28 | 13 | 9.82 | 10 | 8.74 |
| 1,2,3,17 23′ 5*,21,28 | 3 | 4.00 | 4 | 3.09 |
| 1,3,17 23 5* | 9 | 8.57 | 12 | 9.64 |
| 1,3,17 23′ 5* | 6 | 3.49 | 2 | 3.40 |
| 1,3,17 23′ 5*,28 | 2 | 0.38 | 0 | 0.00 |
| 1,17 23′ 5*,21,28 | 2 | 1.91 | 4 | 4.39 |
| 1,3,17 23 5*,15,16 | 0 | 0.00 | 3 | 1.72 |
| 1,2,17 23′ 5* | 0 | 0.00 | 1 | 0.03 |
| Other phenotypes | 0 | 5.73 | 0 | 3.29 |
| Total (5* = 5,10,11,13,14,26,27) | 195 | 195.00 | 252 | 252.00 |
| χ2 = 11.168 | df = 9 | χ2 = 2.239 | df = 7 | |
| KM | ||||
| 1 | 49 | 49 | 36 | 36 |
| –1 | 151 | 151 | 216 | 216 |
| Total | 200 | 200 | 252 | 252 |
a Data from [35].
GM haplotype and KM allele frequencies are reported in Table 2. Whereas GM system is quite polymorphic, KM allelic variation appears to be diminished, KM*3 being the best represented allele in southern Spain (∼ 85%) as well as in other Iberian populations (∼ 87%). Overall, KM*3 is the most common KM allele in human populations around the world.
GM and KM haplotypic/allotypic frequencies (± SE) and genetic diversity, h in southern Spain.
| Shortened haplotype | East Andalusia Granada | West Andalusia Huelvaa | |||
| Frequency | SE | Frequency | SE | ||
| GM haplotypes | |||||
| GM*1,17 23′ 21,28 | GM*1 21 | 0.1994 | 0.0196 | 0.2317 | 0.0313 |
| GM*1,2,17 23′ 21,28 | GM*1,2 21 | 0.0509 | 0.0115 | 0.0342 | 0.0125 |
| GM*3 23′ 5* | GM*3 23’ 5 | 0.2015 | 0.0204 | 0.1778 | 0.0288 |
| GM*3 23 5* | GM*3 23 5 | 0.4943 | 0.0244 | 0.5107 | 0.0363 |
| GM*1,17 23′ 5* | GM*1,17 5 | 0.0444 | 0.0119 | 0.0378 | 0.0161 |
| GM*1,17 23′ 10,11,13,15,16 | GM*1,17 16 | 0.0048 | 0.0280 | 0.0039 | 0.0002 |
| Others | GM*Other | 0.0046 | 0.0206 | 0.0039 | 0.0002 |
| Genetic diversity (h) | 0.4766 | 0.0367 | 0.4730 | 0.0300 | |
| KM allotypes | |||||
| KM*1 | 0.1311 | 0.0175 | 0.0742 | 0.0119 | |
| KM*3 | 0.8689 | 0.0175 | 0.9258 | 0.0119 |
a Data from [35].
The observed GM genetic profiles in eastern and western Andalusians are quite similar. Both populations, with a nearly identical genetic diversity (0.477 in Granada, 0.473 in Huelva) exhibit typically a European GM component and it is enriched with African GM*1,17 5* haplotype. Local Andalusian genetic substructure based on this specific autosomal locus was not statistically detectable (FST = 0.0024, P = 0.155). This finding agrees with previous results on APOE allele frequency patterns in Andalusia using the same population sample stock [52].
GM*3 5* haplotype (a combination of GM*3 23 5* and GM*3 23′ 5* haplotypes) is considered as a European marker (57–83%) showing higher frequencies (> 80%) in Central and Eastern European populations. A noticeable presence is also detected in North Africa (62–40%) and the Near/Middle East (77% in Lebanon; Dugoujon, unpublished data). In the Iberian Peninsula, GM*3 5* haplotype frequencies vary from 57.1% in Cantabria (northern Spain) [53] to 69% in southern Spain (Andalusia) and Portugal. In Basques, such frequencies range from 59 to 65% [10,54].
GM*1,17 21,28 (or GM*1, 21) is the following most frequent haplotype in Andalusia (Granada: 20%; Huelva: 23%), with a higher incidence in Basques from Guipúzcoa (35%, [10]) (see Table S1). This haplotype is common in human populations [12], except in sub-Saharan Africans.
GM*1,17 5* haplotype registers peak values (≥ 0.80) in Sub-Saharan Africa and Madagascar [5,55]. In Europe, this haplotype is generally absent or its incidence is < 0.01, with the exception of the Iberian Peninsula and other neighbouring Central Mediterranean European populations [Sicily: 0.035 ([56]); Sardinia: 0.029 ([6,57]); Corsica: 0.040 ([34]), and Albania: 0.027 (Dugoujon unpublished data)].
Within Iberia, Andalusians from Granada and Huelva together with Galicians (in the northwest) register frequencies around twice as high (0.044) as in other Iberian samples (1.2–2.6%) (Table S1). As far as we know, no GM/KM studies exploring inland Spanish territories (e.g., Castile region) have been performed. Only a Portuguese general population sample [6] has been characterized for GM/KM allotypes to date. In mainland Portugal, the estimated GM*1,17 5* frequency (2.03%) showed to be lower than in south- and northwestern Spain. This divergent result could be due to the fact that allotype G3M (21) is defined in that study using L224 antibody (a rabbit antibody) followed by an immunization process. This hetero-antibody does not have enough specificity to characterize the epitope. This circumstance might have led to an underestimation of GM 1, 17 5* frequency in that Portuguese sample. Therefore, it is highly likely that when using anti-allotypes of human origins instead, GM*1,17 5* frequencies might rise.
GM*1,17 10,11,13,15,16 (or GM*1,17 16) haplotype is considered a North and Central Asian population marker. Its occurrence in Europe and North Africa is particularly low (< 0.01). Within the Iberian Peninsula, Basques from Guipúzcoa and Biscay show similar frequencies (0.014), with an exception in Pasiegos (0.046), the native population of Montes de Pas, a very small region situated in the Autonomous Community of Cantabria and neighbouring the border with the Castilian province of Burgos, very close to the Basque province of Biscay.
In most continental studied populations, rare GM haplotypes (included in GM* Others here) are the least occurring haplotypes, and often their value is zero. This pattern closely agrees with those observed among Iberian populations (e.g., Andalusian samples: 4 in 1000 individuals). However, a broad variation range has been detected for these rare haplotypes in North Africa [0.3%–2.1% in Moroccan Berbers ([58]); 6.0%–17.9% in Egyptians ([6]; Dugoujon, unpublished data)].
Fig. S1 provides interesting graphical information on the composition and variation of the most recurrent GM haplotypes across the Mediterranean. Histograms enable visualizing the heterogeneous spatial variation that some haplotypes show – like GM*1,17 5* –, whose differences between north and south are certainly easy to observe.
A MDS, based on FST pair-wise genetic distances among Iberian population samples (n = 12) is showed in Fig. 2. MDS is supported by a remarkably low stress value (0.014) according to Kruskal scale [44] and Tucker's coefficient of congruence, the latter being close to one. The genetic map indicates proximity between the two Andalusians samples (Granada, ANDL2; Huelva, ANDL1) in the third quadrant, together with other neighbouring populations settled along the Iberian Atlantic façade: Portugal (PORT) and Galicia (GALC). All four Basque populations used in the analysis are spread over the first dimension. There may be various explanations for the close genetic affinity observed between Cantabrians from Montes del Pas Pasiegos (CANT) and Basques from Guipúzcoa for the GM system (see [36]).
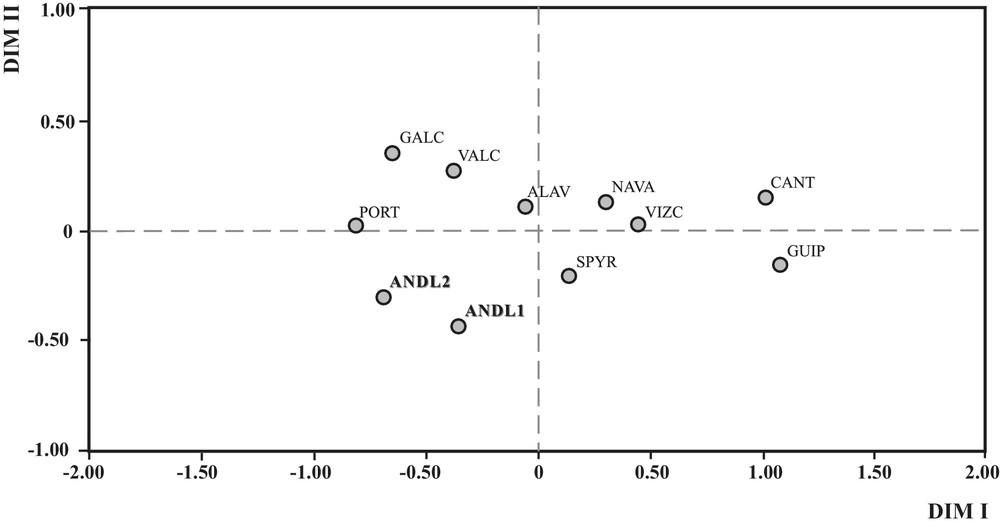
Multidimensional scaling analysis performed on mainland Iberian populations on the basis of seven GM haplotypes. Andalusian subpopulations are showed in bold faced. Populations, associated acronyms and GM haplotype frequencies are reported in Table S1.
By using a different multivariate methodology, Fig. 3 displays the results of HCA, depicting genetic relationships among European, North African and Near/Middle Eastern Mediterranean populations. The first two principal components (PC1 and PC2) account for the 95.26% of absorbed variance of analysed data (PC1: 75.16% and PC2: 20.10%). HCA yields four major clusters. C1 is shaped by 19 populations including all the Iberian (12) and French (4) samples, except for Corsica. This cluster is characterized by significantly high GM*1,2,17 21,28 frequencies (cluster average value = 0.0586; P = 0.000), GM*1,17 21,28 frequencies (average = 0.2477; P = 0.018) and by low levels of GM*1,17 5* haplotype (average = 0.0284; P = 0.001). Our two Andalusian samples appear close to the centroid, despite their position at the edge of the Mediterranean space. This finding can be interpreted from the long and complex history that has characterized Andalusia. Prehistoric and historic migrations towards Andalusia may have had a great impact on its gene pool, and hence on the Iberian genetic landscape.

Population structure within Mediterranean based on GM haplotype data from 8879 individuals. The Hierarchical Cluster Analysis (HCA) shows four different population groups according to geographical origin of statistically analysed population samples. Populations, associated acronyms and GM haplotype frequencies are reported in Table S1.
Cluster C2 contains Eastern and Central European Mediterranean populations, and it is genetically defined by the highest values of the European GM*3 5* haplotype (average = 0.8026; P = 0.000) and the lowest frequencies of the GM*1,17 5* haplotype (average = 0.0193; P = 0.007).
Clusters C3 and C4 include northeastern and northwestern African populations, respectively. C3 is restricted to Egyptian samples from Siwa Oasis and Cairo, and it is well defined by high and significant values of the Sub-Saharan GM*1,17 5* haplotype (average = 0.3030; P = 0.000) and GM*Others (GM rare variants) (average = 0.1195; P = 0.000). All Maghreb samples, except two ones from Tunisia, shape the C4 with high and significant frequencies of the GM*1,17 5* (average = 18.11; P = 0.000) and GM*1,17 21,28 (average = 0.2843; P = 0.000) haplotypes. Both North African groups register similar values of the European GM*3 5* marker.
An analysis of the Mediterranean population structure based on the FST parameter and on related components is presented in Table 3. The degree of genetic differentiation among Iberian populations (12) was close to the significance level of 0.05 (FST value = 0.0028; P = 0.0567). By contrast, the AMOVA showed that the structure of GM genetic variation between Southern European and North African Mediterranean populations was highly significant (FCT = 0.1232, P = 0.0000). Furthermore, we found significant differences between Iberians and several North African groups (0.0331 ≥ FCT ≥ 0.0504) and between Iberian Peninsula and Morocco (FCT = 0.0504, P = 0.0059). Other comparisons, such as Andalusia vs. Morocco or Andalusians vs. Basques do not yield reliable P-values due to the low number of populations per group, which allow performing few permutations [59]. Identification of an accurate number of groups depends critically on the degree of differentiation between groups, and the absence of isolation-by-distance within groups should increase with the number of available loci. Thus, a certain degree of homogeneity in the characteristics of populations within groups (i.e. demographic sizes, historical processes, isolation, etc.) must be considered as an important aspect in the analysis of population genetic structure [60].
FST and FCT fixation indices for several sets of populations in the Mediterranean space obtained by AMOVA.
| Fixation indices | ||||
| Population groups | F ST | P-value | F CT | P-value |
| Iberian Peninsula (12)a | 0.00276 | 0.05670 | ||
| Andalusia (2) + Cantabrian Cornice (5) | 0.00643 | 0.01662** | 0.00000 | 0.36461 |
| Andalusia (2) + Maghreb (13) | 0.04126 | 0.00000 | 0.03259 | 0.00782** |
| Iberian Peninsula (12) + Morocco (3) | 0.05276 | 0.00000 | 0.05044 | 0.00587** |
| Iberian Peninsula (12) + Maghreb (13) | 0.03917 | 0.00000 | 0.03312 | 0.00000 |
| Iberian Peninsula (12) + North Africa (15) | 0.03931 | 0.00000 | 0.03931 | 0.00000 |
| Europe (14) + Africa (15)b | 0.13847 | 0.00000 | 0.12324 | 0.00000 |
a Number of populations per group.
b Territories bordering the Mediterranean Sea.
** P < 0.01.
Fig. 4 shows a Mantel test and regression analysis for genetic and geographical pair-wise distances between population samples, in order to detect the existence of an isolation-by-distance pattern (IBD, [47,61]). When the whole Mediterranean dataset was considered (Fig. 4a), we found a significant positive correlation (r = 0.205, PMantel < 0.001). Measures of relatedness among Mediterranean European against North African populations and their pair-wise geographical distances (Fig. 4b) are even stronger (r = 0.283, PMantel < 0.001). These observed positive correlation coefficients may indicate that the magnitude of genetic relationships—based on GM haplotypes—among populations across the Mediterranean Sea is correlated with their geographical distance.
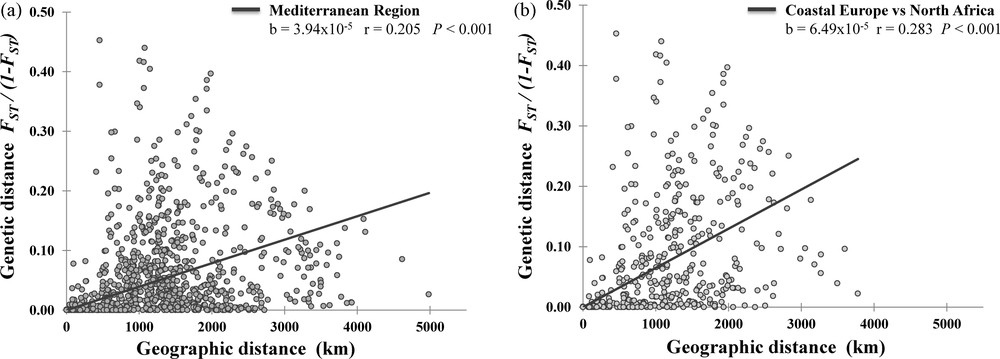
Genetic differentiation among human Mediterranean populations plotted as a function of the geographic distance. The analysis is based on information contained in Table S1.
4 Discussion
The patterns of geographic variation among ethnic groups for GM are heterogeneous, and its genetic structure within continental areas is rather high (FST = 0.391) [12]. This scenario can be extrapolated to less extensive, well-defined areas in terms of geographic and anthropological characteristics. Mediterranean space is a good example of this, and it represents an important fraction of world variation (FST = 0.138) (see Table 3).
Given the human ability for movement and expansion, genetic corridors may have outweighed physical barriers at defining current genetic frequencies landscape. Exploring the role of “migratory routes” from Africa to Europe and Asia thus provides insights into the Mediterranean population composition and genetic diversity. In terms of maritime connections with neighbouring continents, Africa contains three important strategic zones: (1) the Bab el-Mandeb Strait (32 km wide) is bordered by Djibouti, Ethiopia and Somalia on the African side and Yemen on the Arabia Peninsula http://global.britannica.com/EBchecked/topic/31551/Arabia side, (2) the Strait of Gibraltar (14 km wide) in the northwest separates Africa (Morocco) and Europe (Iberian Peninsula), and (3) the Sicilian Channel in the central Mediterranean Sea, between Sicily and Tunisia (145 km wide). Likewise, North Africa is regarded as a corridor between Sub-Saharan Africa (to the south) and the Mediterranean Sea (to the north). Since the domestication of camels (genus Camelus), the Sahara desert has never been an insurmountable barrier between Sub-Saharan Africa and other civilizations.
The presence and the relatively high incidence of the Sub-Saharan GM*1,17 23’ 5* marker in the Maghreb—particularly in Morocco—can be associated with the trans-Saharan trade (beginning around the 5th century). By means of caravans carrying salt, gold and slaves—sometimes reaching up to 50,000 men—this phenomenon connected the Niger basin to the North African fringe. Some of the main trans-Saharan routes arrived in Marrakesh, Morocco, and from there to the Mediterranean. Such caravan traffic enabled population admixture between Mediterranean Africa and Bilad-el-Sudan, Sub-Saharan Africa [62,63].
The Portuguese occupation of Guinea coasts during 15th century motivated part of this trans-Saharan trade to be directed towards the sea. For several centuries, Moroccan rulers controlled the neighbouring Mali region and incorporated some Malian contingents into their army, whereas women were used as concubines in the Maghreb. As a consequence, the Moroccan population has been the subject of an intense admixture with southern, western Saharan populations.
The long and complex Mediterranean history shows that it has been a permeable obstacle to human migration. Nevertheless, the amount of genetic differentiation between contemporary northern Africa and southern Europe is regarded as conspicuous and heterogeneous. Currat et al. [64] used a long array of classical and DNA polymorphisms to show that GM and RH systems and mtDNA produce intermediate levels of population genetic differentiation on both sides of the Strait of Gibraltar. These findings controvert the rather strong genetic barrier inferred by Y-chromosome markers. The detection of genetic discontinuities in specific areas of the Mediterranean based on GM data would support elegantly the above scenario (map not shown).
The observed high FST (and FCT) values in the present survey between Morocco and the Iberian Peninsula – when compared to those of the Maghreb and the Iberian Peninsula – can be explained by the effect of low population numbers per group. In this line, the large increase in the FST (and FCT) value when comparing Mediterranean Europe and North Africa as a whole may be due to the divergence between Central–Eastern Europe and North Africa. Genetic boundaries must be interpreted in terms of geographical and environmental barriers (landscape genetics) [50,65], bearing in mind that both ancient and contemporary population demography and cultural behaviours may play a fundamental role in the structure of genetic variation within and among human populations [49]. The latter factors could be considered especially critical within the Mediterranean history. The large historical differences in population sizes between Southern Europe and North Africa and the strong cultural diversity observed in the mating patterns could greatly explain the current human genetic diversity. In populations of North Africa, Middle East and West Asia, consanguineous marriages – mainly those between close relatives, in particular first cousins, F = 1/16 – have traditionally been a key component of their marital structure. The rates of consanguinity in those geographical areas account for 20–50% of all marriages [66–69] and they are still strongly favoured. In contrast, marriage patterns in Europe have traditionally been less influenced by sociocultural factors than those in other Mediterranean societies [70]. The HCA performed in the present study shows Central and Eastern Mediterranean populations near the edge of the plot, due to its elevated GM*3 5* haplotype frequency. In addition, this map reveals an intermediate genetic location for Iberian and French populations and its proximity to those from Maghreb, which suggests a higher degree of admixture between them. Furthermore, similar mean values of GM*1,17 23′ 21,28 haplotype observed in southwestern Europe (cluster C1, 0.25) and Maghreb populations (C4, 0.28) – positive side of Factor 2 – indicate a shared genetic history on both sides of the sea. Maghreb peopling must then have taken place – at least, partially – from the Iberian Peninsula [71,72], which constituted an important refuge during Last Glacial Maximum (LGM, 11–18 kya). Prolonged and ancient contacts are further explained in Athanasiadis and Moral [31]. The Islamic rule in Iberia favoured those contacts.
Given their considerable genetic diversity – which might be explained by their small population size and persistent isolation – Tunisian samples appear rather disperse in the HCA map. All but two are contained in C4. TBE2 (Berbers) and TAR2 (Arabs) appear within C1 instead, as they show a high (0.617) European GM*3 5* frequency. Two historical events may account for this finding: (i) Cartago's devastation by the Romans (146 BC), after which the place was settled by people of European descent, as the African local population diminished; (ii) the arrival of Iberian moriscos (most of them coming from the kingdom of Granada) during 16th and 17th centuries [63].
Population studies aimed at characterizing molecular DNA markers in North African populations have shown an uneven genetic landscape [73–76]. This picture agrees with the spatial patterns of the GM polymorphism. GM haplotype diversity (H) registered in North African populations is higher (0.524–0.685) than that observed in Mediterranean Europeans, emphasizing that the level of heterozygosity in Iberian populations is more pronounced (H = 0.469–0.570) than in European ones. In agreement with this, Auton et al. [77] studied genetic diversity patterns at a genome-wide scale in four continental populations, and observed that the largest levels of haplotypic diversity in Europe are found in the Iberian Peninsula.
Fig. 5 shows the geographical variations by means of geostatistical surface maps of GM*1,17 23′ 5* haplotype in Africa, the Mediterranean basin, and the Iberian Peninsula. The contour map depicted in Fig. 5a shows how the most prominent source is centred at Sub-Saharan Africa around Guinea Gulf. Here, the highest frequencies are reached by Pygmies (Central Africa), and Ivory Coast and Mali natives [12]. Additionally, such haplotype shows important variations in frequencies from West and Central Africa to the rest of the continent, with decreasing occurrence but with a widely variable distribution across the North African fringe – e.g. northwestern Maghreb Africans: 0.075–0.326; northeastern Africans (Egyptians from Siwa oasis: 0.313; Dugoujon, unpublished data). It should also be noted how the GM*1,17 23′ 5* pattern in Africa roughly overlaps Duffy's blood group silent FY*BES allele pattern (further details in [78]). The relationship between Duffy-negative phenotype FY (a–b–) and resistance against malaria pathogen Plasmodium vivax has long been highlighted, although recent studies in different malaria-endemic regions have begun to reveal new perspectives on that association [79].
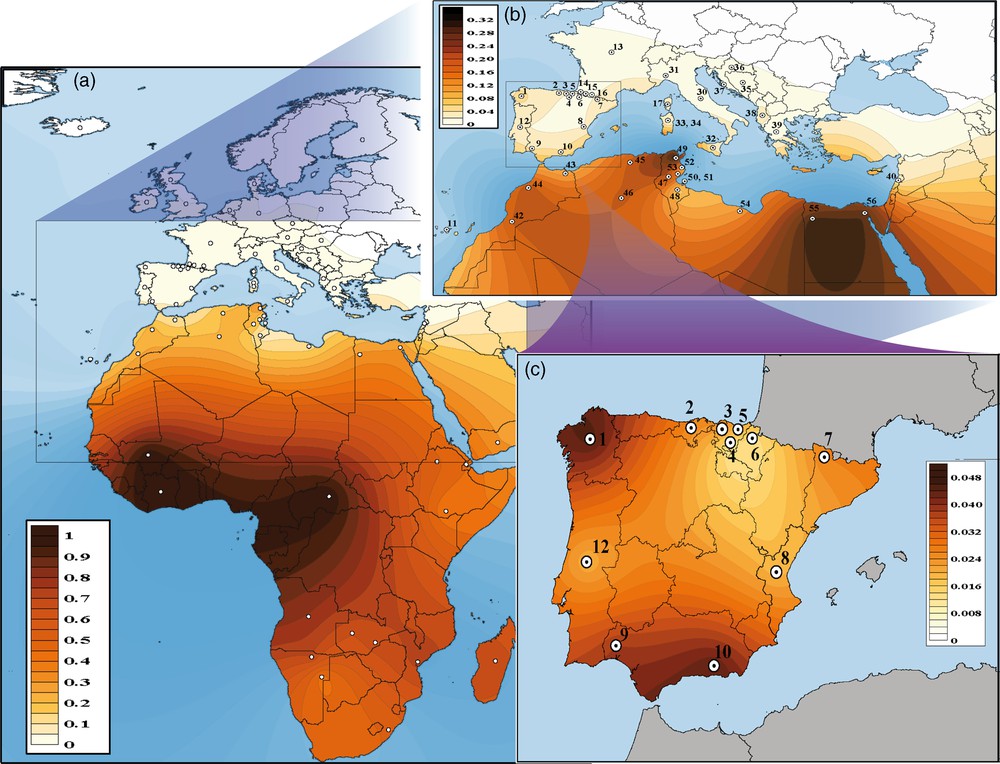
Contour (surface) maps showing the spatial variation of the Sub-Saharan GM 1,17, 5* haplotype: African continent (a), Mediterranean basin (b), and Iberian Peninsula (c).
Outside North Africa, GM*1,17 23′ 5 is comparatively more represented in southern and western regions of the Iberian Peninsula than in other mainland Iberian and southwestern European Mediterranean populations (Fig. 5b, c). The similar GM*1,17 23′ 5* frequencies (∼ 0.04) in Andalusia and Galicia (regions for which Muslim domination was very uneven) can be explained by the connection between southwestern and northwestern Iberia through the Roman Via de la Plata (“silver way”). This road acquired remarkable military and trading importance, since it connected important cities and mining deposits, and facilitated population movements during long periods (this scenario is further explored in [31]). Other possibility are long-range maritime travels along the Iberian Atlantic façade, mainly motivated by tin search at mining sites in northwest peninsular Iberia, that dates from the Bronze Age (the Early Bronze age started in Iberia towards 2250 BC, with a presence recorded in southern Iberia since 3500 BC). These travels connected Huelva and Galicia coasts, with the Tagus estuary (Lisbon) as a halfway stop [80,81]. Frequencies exhibited by sub-Saharan African L maternal lineages in southern Spain (Andalusia; Hernandez et al., manuscript in preparation) and western Iberian regions (see [82,83]) constitute other findings which resemble the pattern showed by the GM*1,17 23′ 5* sub-Saharan marker in the Peninsula.
GM haplotype variation across the Mediterranean basin reflects that the interactions between North Africans and South Europeans along human history must have been intense, complex and implied intricate gene flow processes. Recent relevant advances in the knowledge of the genetic structure – based on both autosomal and haploid markers – in western Mediterranean populations (with special reference to Andalusia region) highlight that the African influence on the Iberian Peninsula does not suit a simple, isotropic pattern. The data on GM obtained from Granada, the autochthonous population studied here, may be useful in order to clarify and get a deeper insight into this scenario.
Disclosure of interest
The authors declare that they have no conflicts of interest concerning this article.
Acknowledgements
Our team is deeply grateful to blood donors from Granada province contributing to this research project. We thank doctors and nurses for their involvement in the collection of blood samples. This study was supported by the Spanish Ministry of Economy and Competitiveness (MINECO) by the official projects CGL2006-04749/BOS and CGL2010-15191/BOS granted to RC. CF-L and CLH are funded by Marie Curie European Programme network (granted to JMD) and Complutense University of Madrid grants, respectively.