

1 Introduction
Purslane (Portulaca oleracea L.) is a highly efficient drought- and salinity-tolerant plant species that grows in hostile environmental conditions in many countries [1–3]. Differences in varieties, harvesting times, and environmental conditions can contribute to purslane nutritional composition and benefits [4], and possibly to its biological activity [5]. Uddin et al. [6] also reported that purslane flourishes in numerous biogeographical locations worldwide and are highly adaptable to many adverse conditions such as drought, saline, and nutrient-deficient conditions. P. oleracea has been identified as one of the richest vegetable source of omega-3 fatty acids [7], which is five times richer than spinach [8]. Purslane is rich in vitamin A, vitamin C, calcium, phosphorus and iron [5,6] antioxidants, such as α-tocopherol [9,10] and melatonin [7]. Its nutritional characteristics suggest that it can offer better nourishment than the 20 major crops currently providing most of our food needs [2]. Many research findings have been published worldwide regarding nutritional quality, medicinal properties, drought and salinity effect on the morpho-physiological attributes of this crop. However, research on genetic diversity among diverse cultivars and collected germplasms are scanty. Information on the genetic diversity and relationships among available germplasms are vital before initiating any rational plant-breeding program. Genetic diversity in crop species can be determined using morphological (phenotypic), biochemical, and molecular (DNA) markers [11]. However, the morphological markers are strongly affected by environmental factors compared to biochemical markers, and therefore are dependent on environmental conditions during cultivation. The limitations associated with morphological and biochemical markers are overcome by molecular markers [11]. Molecular characterizations through the use of molecular markers are independent of the influence of the environment. This characterization could be done through the use of plant DNA from any growth stage [12]. Among the various molecular markers, polymerase chain reaction (PCR)-based markers, such as random amplified polymorphic DNA (RAPD; [13]), inter-simple-sequence-repeat (ISSR; [14]), simple sequence-repeat (SSR; [15]), amplified fragment-length polymorphism (AFLP; [16]), and sequence-related amplified polymorphism (SRAP; [17]) have become popular for genetic diversity analyses. Additionally, ISSR is a kind of simple and quick technique that permits the detection of polymorphisms in inter-microsatellite loci, using a primer designed from dinucleotide or trinucleotide simple repeats, and possesses some advantages of stability and reproducibility, rich polymorphism, reliability [18], much larger numbers of fragments per primer, and relatively low cost. ISSRs have been widely used for DNA fingerprinting, population genetics and phylogenetic studies and so on in field crops, fruit trees and herbs [19] and were described as a powerful technique to assess genetic diversity [20–22] and to detect similarities between and within species levels [23]. ISSR primer-based diversity analysis has been done successfully by several scientists in several crops, e.g., in sesame [24], barley [25], rice [26], and in jatropha [27].
The first and the only available report on purslane AFLP-based drought tolerance and diversity analysis is the article by Ren et al. [2], which deals with ten collected accessions from six countries. Lokhande et al. [28] described the genetic diversity 14 collected clones of sea purslane (Sesuvium portulacastrum L.) using RAPD markers. However, studies about the comparison between the collected purslane germplasms and the genetic relationships obtained using an ISSR marker are not yet reported. The present study surveys the molecular diversity in 45 accessions of purslane collected from seven states of Western Peninsular Malaysia, by using 28 ISSR primer combinations. The genotyping data were used to understand the relationships among the collected germplasms and identify genetically diverse lines for a hybridization program for future genetic improvement of purslane.
2 Materials and methods
2.1 Plant materials
A total of 45 purslane accessions collected from seven states of Western Peninsular Malaysia were used in this study. Among 45 samples, 11 samples were collected from Selangor, five from Melaka, five from Negeri Sembilan, nine from Kedah, five from Perak, five from Penang and the remaining five from Perlis. The collected purslane samples were transplanted in glass house of Field-2 at the Faculty of Agriculture, Universiti Putra Malaysia, and the whole molecular study was done in the Plant Breeding and Molecular Genetic Laboratory, AgroBio Complex, Faculty of Agriculture, Universiti Putra Malaysia. Brief morphological descriptions and collection details of purslane accessions have been given in Table 1 and Fig. 1.
Brief morphological descriptions and collection details of purslane samples.
| Sl. No. | Sample code | State | Locations | Latitude (°N) | Longitude (°E) | Brief morphology of the collected purslane plants |
| 1 | Slg-1 | Selangor | Sungai Buloh | 03°19′ | 101°59′ | Pink flower, wedge shaped margin red-green leaf, red stem |
| 2 | Slg-2 | – | Sungai Buloh | 03°19′ | 101°59′ | White-pink colored flower, wedge shaped green leaf, red stem |
| 3 | Slg-3 | – | Sungai Buloh | 03°19′ | 101°59′ | Yellow flower, paddle shaped green leaf, red stem |
| 4 | Slg-4 | – | AgroBio. UPM | 02°98′ | 101°73′ | Yellow flower, red margin wedge shaped green leaf, red stem |
| 5 | Slg-5 | – | UPM | 03°01′ | 101°706′ | Wild, yellow flower, wedge shaped green leaf, green-red stem |
| 6 | Slg-6 | – | Seri Kembangan | 03°00′ | 101°713′ | Wild, yellow flower, small paddle shaped red-green leaf, red stem |
| 7 | Slg-7 | – | Tanjung Karang | 03°41′ | 101°19′ | Yellow flower, paddle shaped green leaf, red stem. |
| 8 | Slg-8 | – | Tanjung Karang | 03°41′ | 101°19′ | Pink flower, paddle shaped green leaf, red stem. |
| 9 | Slg-9 | – | Nursery, Klang | 03°02′ | 101°26′ | Purple flower, wedge shaped red-green leaf, pink stem |
| 10 | Slg-10 | – | Nursery, Klang | 03°02′ | 101°26′ | Pink flower, wedge shaped green leaf, green-red stem |
| 11 | Slg-11 | – | Port Klang | 03°00′ | 101°36′ | Wild, yellow flower, wedge shaped green-red leaf, red stem |
| 12 | Mlk-1 | Melaka | Kg. Pulau Gadong | 02°24′ | 102°21′ | Wild, yellow flower, wedge shaped green leaf, red-green stem |
| 13 | Mlk-2 | – | Kg. Pulau Gadong | 02°21′ | 102°19′ | Wild, yellow flower, wedge shaped green leaf, green stem |
| 14 | Mlk-3 | – | Kg. Bukit Gadong | 2° 93′ | 102°29′ | Wild, yellow flower, small green leaf, red stem |
| 15 | Mlk-4 | – | Taman Pertam Jaya | 2°19′ | 102°27′ | Wild, yellow flower, wedge shaped green leaf, red stem |
| 16 | Mlk-5 | – | Alor Gajah | 2°38′ | 102°22′ | Wild, yellow flower, wedge shaped green leaf, red stem |
| 17 | PD-1 | Negeri Sembilan | Kg. Ayer Meleleh | 02°54′ | 101°80′ | Wild, yellow flower, paddle shaped green leaf, red-green stem |
| 18 | PD-2 | – | Kg. Ayer Meleleh | 02°54′ | 101°81′ | Wild, yellow flower, wedge shaped green-red leaf, red stem |
| 19 | PD-3 | – | Jln Persiaran, Seremban | 02°43′ | 101°56′ | Wild, yellow flower, wedge shaped green leaf, red stem |
| 20 | PD-4 | – | Jelebu | 03°07′ | 102°17′ | Wild, yellow flower, paddle shaped green leaf, red stem |
| 21 | PD-5 | – | Kuala Pilah, | 02°75′ | 102°25′ | Wild, yellow flower, wedge shaped green leaf, green-red stem |
| 22 | Kdh-1 | Kedah | Nursery, Kedah | 06°11′ | 100°37′ | Orange-yellow flower, wedge shaped green leaf, red stem |
| 23 | Kdh-2 | – | Nursery, Kedah | 06°11′ | 100°37′ | Pink flower, wedge shaped green leaf, Red stem |
| 24 | Kdh-3 | – | Nursery, Kedah | 06°11′ | 100°37′ | Purple flower, paddle shaped green leaf, red stem |
| 25 | Kdh-4 | – | Kuala Kedah | 06°11′ | 100°29′ | Wild, yellow flower, green wedge shaped leaf, green stem |
| 26 | Kdh-5 | – | Kota Setar | 06°16′ | 100°54′ | Wild, yellow flower, green wedge shaped leaf, green-red stem |
| 27 | Kdh-6 | – | Jitra-1 | 06°24′ | 100°43′ | Wild, yellow flower, green wedge shaped leaf, green-red stem |
| 28 | Kdh-7 | – | Jitra-2 | 06°23′ | 100°42′ | Wild, yellow flower, wedge shaped green-red leaf, red stem |
| 29 | Kdh-8 | – | Jitra-3 | 06°33′ | 100°42′ | Wild, yellow flower, wedge shaped green-red leaf, red stem |
| 30 | Kdh-9 | – | Jitra-4 | 06°27′ | 100°41′ | Wild, yellow flower, green wedge shaped leaf, green-red stem |
| 31 | Prk-1 | Perak | Kuala Kangsar | 04°77′ | 100°94′ | Wild, yellow flower, wedge shaped green-red leaf, red stem |
| 32 | Prk-2 | – | Ipoh | 04°77′ | 100°95′ | Wild, yellow flower, wedge shaped green-red leaf, red stem |
| 33 | Prk-3 | – | Perak Tengah | 04°36′ | 100°98′ | Wild, yellow flower, wedge shaped green leaf, green- red stem |
| 34 | Prk-4 | – | Bota Perak | 04.34′ | 100°88′ | Wild, yellow flower, wedge shaped green leaf, red stem |
| 35 | Prk-5 | – | Teluk Intan | 04°02′ | 101°02′ | Wild, yellow flower, wedge shaped green-red leaf, red stem |
| 36 | Png-1 | Penang | Seberang Perai, | 05°54′ | 100°47′ | Yellow flower, paddle shaped, margin green-red leaf, Red stem leaf |
| 37 | Png-2 | – | Seberang Perai, | 05°54′ | 100°47′ | Pink flower, wedge shaped green-red leaf, red stem |
| 38 | Png-3 | – | Seberang Perai, | 05°54′ | 100°47′ | Wild, yellow flower, wedge shaped green-red leaf, red stem |
| 39 | Png-4 | – | Bumbung Lima | 05°55′ | 100°44′ | Wild, yellow flower, wedge shaped green-red leaf, red stem |
| 40 | Png-5 | – | Lorong Malinja, | 05°51′ | 100°42′ | Yellow flower, wedge shaped green-red leaf, red stem |
| 41 | Pls-1 | Perlis | Balai Baru Beseri | 06°51′ | 100°23′ | Wild, yellow flower, wedge shaped green leaf, red stem |
| 42 | Pls-2 | – | Jalan Kalei Bukit | 06°52′ | 100°24′ | Wild, yellow flower, wedge shaped red-green leaf, red stem |
| 43 | Pls-3 | – | Kg. Simpang Empat | 06°34′ | 100°19′ | Wild, yellow flower, wedge shaped green-red leaf, red stem |
| 44 | Pls-4 | – | Kuala Perlis | 06°23′ | 100°82′ | Wild, yellow flower, wedge shaped green leaf, red stem |
| 45 | Pls-5 | – | Kg. Telok Jambu | 06°45′ | 100°17′ | Wild, yellow flower, wedge shaped green leaf, red stem |
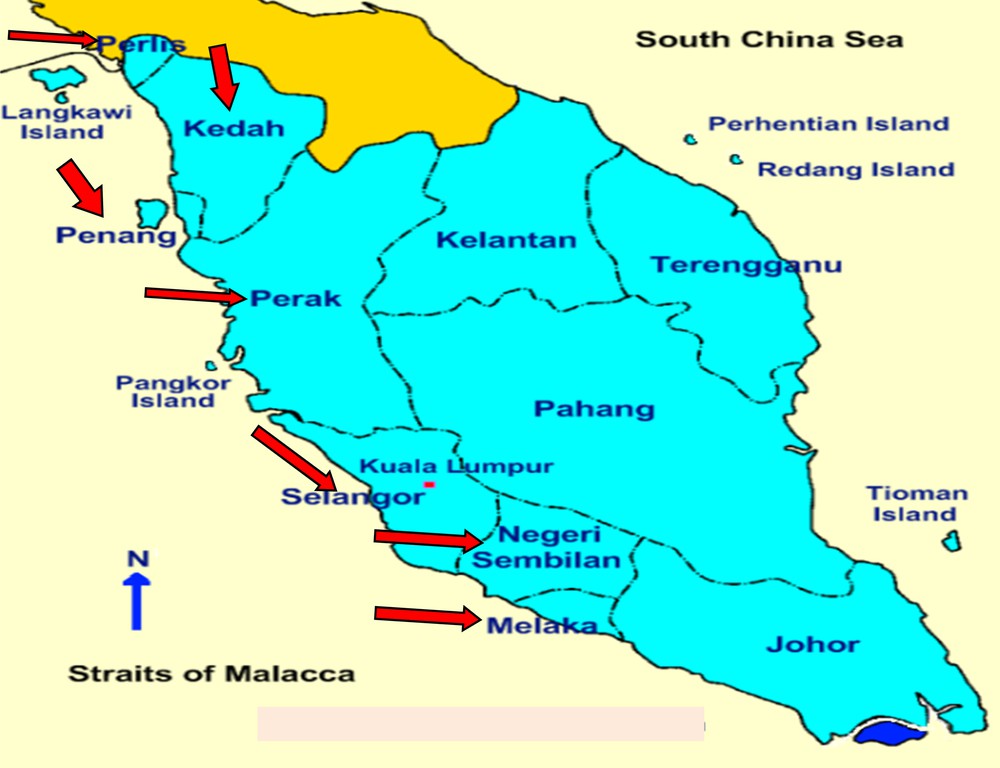
(Color online). Map showing the seven states (red arrow) of Western Peninsular Malaysia from where purslane samples were collected (for interpretation of the references to color in this figure legend, the reader is referred to the web version of this article).
2.2 Genomic DNA extraction
Genomic DNA from each accession was isolated from fresh leaf tissue of 20-day-old plants using the cetyltrimethylammonium bromide (CTAB) method slightly modified from Doyle and Doyle [29]. About 0.5 g of fresh leaf tissue was finely milled using mortar and pistil within liquid nitrogen. About 0.5 g of fresh leaf tissue was ground in liquid nitrogen and taken into a 2-mL micro-centrifuge tube and then combined with 1000 μL of CTAB buffer [100 mM Tris-HCl pH8.0, 20 mM ethylenediaminetetraacetate (EDTA) pH 8.0, 1.4 mM NaCl, 2% (w/v) CTAB, 2% (w/v) polyvinylepyrrolidone (PVP) and β-mercaptaphenol and 3 μL of mercapethanol. The samples were incubated at 500 rpm at 65 °C for 1 h (60 min), and the tubes were gently shaken at 10-min intervals to ensure the mixture was homogeneous. After the incubation step, the samples were centrifuged at 13,000 rpm for 5 min to precipitate the solid parts of the cell. Afterwards, the total amount of supernatant was transferred into a new 2-mL Eppendorf tube. Then, an equal volume of chloroform:isoamyl alcohol (24:1, v/v) was added to each sample and the tube was gently inverted to homogenize the mixture and centrifuged at 13,000 rpm for 5 min to precipitate polysaccharides. The upper phase was then transferred into a new 2-mL Eppendorf tube, excluding the green and white lower phases, and again, 600 μL of cold isopropanol were incorporated and mixed gently by inverting the tube at least 50 times. All samples were then incubated at –20 °C for 30 min. The samples were removed from the ambience at –20 °C and were centrifuged for 10 min at 13,000 rpm to get a DNA pellet. The resultant supernatant was carefully removed and the pellet was allowed to dry in the air. The DNA pellet was then washed and dried out 1–2 times by adding 600 μL of 75% ethanol at 4 °C until white a DNA fiber appeared. Finally 50 μL of TE buffer (10 mM tris-HCl pH 8.0, 1 mM EDTA pH 8.0) and 1 μL of Rnase (Dnase free) were added and vortexed with the finger to ensure the complete dissolution of DNA in the TE buffer. The samples were later incubated at 37 °C for 1 h to break down RNA, and then stored at –4 °C.
2.3 DNA quantification
One microliter of each DNA sample was put on a NanoDrop spectrophotometer (ND-1000, NanoDrop Technologies Inc., Wilmington, DE, USA), and the relative purity with the concentration of the extracted DNA was displayed. The final concentration of each DNA sample was diluted with 1 × TE buffer (10 mM Tris-HCl, pH 8.0, 1 mM EDTA, pH 8.0) to get the required concentration and kept in a refrigerator at –20 °C for PCR analysis.
2.4 ISSR primers used in the PCRs
A total of 30 ISSR primers obtained from various publications were screened with P. oleracea DNA. Out of these, 28 primers that formed clear and reproducible polymorphic bands were chosen and used for genetic diversity analysis among 45 purslane accessions. The ISSR primers’ sequence with annealing temperature is presented in Table 2.
List of ISSR primers used in this study.
| S/N | Oligo name (marker) | Sequence | Tm (°C) |
| 1 | ISSR1 | 5′-ACA CAC ACA CAC ACA CG- 3′ | 62.7 |
| 2 | ISSR2 | 5′-ACA CAC ACA CAC ACA CT-3′ | 61.4 |
| 3 | ISSR3 | 5′-ACA CAC ACA CAC ACA CC-3′ | 62.7 |
| 4 | ISSR4 | 5′AGA GAG AGA GAG AGA GC-3′ | 58.9 |
| 5 | ISSR5 | 5′-AGA GAG AGA GAG AGA GT-3′ | 57.2 |
| 6 | ISSR6 | 5′-GAG AGA GAG AGA GAG-3′ | 56.6 |
| 7 | ISSR7 | 5′-GAG AGA GAG AGA GAG AT-3′ | 55.4 |
| 8 | ISSR8 | 5′-CTC TCT CTC TCT CTC TG-3′ | 56.7 |
| 9 | ISSR9 | 5′-AGA GAG AGA GAG AGA GGT-3′ | 60.0 |
| 10 | ISSR10 | 5′-ACA CAC ACA CAC ACA CGG-3′ | 65.1 |
| 11 | ISSR11 | 5′-ACA CAC ACA CAC ACA CGA-3′ | 63.8 |
| 12 | ISSR12 | 5′-TAG AGA GAG AGA GAG AGA G-3′ | 57.1 |
| 13 | ISSR13 | 5′-GAC ACA CAC ACA CAC ACA C-3′ | 62.8 |
| 14 | ISSR14 | 5′-CCA CTC TCT CTC TCT CTC T-3′ | 60.9 |
| 15 | ISSR15 | 5′-AGA GAG AGA GAG AGA GG-3′ | 58.3 |
| 16 | ISSR16 | 5′-ATG ATGATGATGATGATG-3′ | 52.9 |
| 17 | ISSR17 | 5′-GAC AGA CAG ACA GAC A-3′ | 57.82 |
| 18 | ISSR18 | 5′-GGA AGA GAG AGG AGA-3′ | 59.6 |
| 19 | ISSR19 | 5′ -GGG TGG GGT GGG GTG- 3′ | 71.4 |
| 20 | ISSR20 | 5′-CAC ACA CAC ACA CAC ATA-3′ | 59.0 |
| 21 | ISSR22 | 5′-ACA CAC ACA CAC ACA CGA-3′ | 63.8 |
| 22 | ISSR23 | 5′-TCC TCCTCCTCCTCC TG-3′ | 65.6 |
| 23 | ISSR24 | 5′-AGA GAG AGA GAG AGA GGC-3′ | 61.2 |
| 24 | ISSR25 | 5′-ACA CAC ACA CAC ACA CGT-3′ | 64.1 |
| 25 | ISSR26 | 5′-CAC ACA CAC ACA CAC AG-3′ | 62.7 |
| 26 | ISSR27 | 5′-TCT CTC TCT CTC TCT CG-3′ | 65.6 |
| 27 | ISSR28 | 5′-AGA GAG AGA GAG AGA GCT T-3′ | 56.0 |
| 28 | ISSR30 | 5′-GGA TGG ATG GAT GGA T-3′ | 57.1 |
2.5 Polymerase chain reactions (PCR) amplification and gel electrophoresis
Polymerase chain reaction for amplification of ISSR fragments was performed in 15 μL of reaction volume containing 1 μL of a mixture of 70 ng of template DNA, 2.0 μL of ISSR primer, 7.4 μL of master mix (Dream Taq green PCR master mix-2X containing green buffer, dNTPs and 4 mM of MgCl2, supplied by Fermentas-Fisher Scientific, UK) and 4.6 μL of nuclease-free water. PCR amplification was carried out in a thermocycler (T100TM, Bio-Rad) following the 3-phase Touchdown PCR protocol [30], with slight modifications. In the first phase, the initial temperature was adjusted to 95 °C for 3 min and the initial denaturation temperature was set at 95 °C for 30 s, annealing at Tm = 62 °C for 60 s; the elongation temperature was set at 72 °C for 30 s. In the second phase, the denaturation temperature was set at 95 °C for 30 sec, annealing at Tm = 52 °C for 60 s and the elongation at 72 °C for 2 min; finally the elongation temperature was set at 72 °C for 10 min in the third phase. The first and second phases were repeated 9 and 30 times, respectively, followed by cooling; finally, the sample was hold at 4 °C. For electrophoresis, 1.5% of molecular grade Agarose (Nacalai Tesque Inc., Kyoto, Japan) gel was prepared containing 1 μL of Midori green in 1X TBE buffer (0.05 M Tris, 0.05 M boric acid, 1 mM EDTA, pH 8.0). The gel was run at a constant voltage of 80 V for 80 min and visualized under Molecular Imager® (GelDocTM XR, Bio-Rad). However, most of the patterns with extremely good polymorphism and useful information were often accompanied with a background smear. To reduce this smear, 2% formamide was used in the reaction. All the patterns generated were repeated at least three times in order to obtain reproducible data.
2.6 Data scoring
The molecular weight for each band was measured by using Alfa Imager software version 5.5. Each amplification product position was considered as a locus. The amplified products for ISSR marker loci at a specific position in a gel were scored visually as “1” for the presence and “0” for the absence of a band to generate a binary data matrix. A 50-bp DNA ladder was added with the first load of the gel to score of the bands in each gel. The only bands that were scored are those that are > 50 bp in length and reproducible. The scoring of the visual bands was done according to the size of the DNA ladder bands.
2.7 Data analysis
From the data generated through binary scoring of the gel photo, genetic distance and similarity coefficient were estimated using Jaccard's similarity coefficients [31]. Cluster analysis was performed to construct a dendrogram based on the similarity matrix data using the unweighted pair group method using arithmetic averages (UPGMA) using NTSYS-pc 2.10 software [32]. Polymorphism information content (PIC) values were calculated to evaluate diverse levels of each ISSR primer according to Anderson et al. [33] using the formula: PIC = 1–ΣP2ij, where Pij is the frequency of the jth allele (marker) for the ith ISSR locus. The binary data were also subjected to PCA (Principal Component Analysis) to investigate the structure of our collection. The PCA of the 45 purslane accessions were calculated by EIGEN module of NTSYS-pc 2.10 [32] software. The genetic diversity parameters of each geographic group, which included the percentage of polymorphic loci (PLP), the observed number of alleles per locus (na), the effective number of alleles per locus (ne), Nei's gene diversity (h) and Shannon's information index (I) were calculated by POPGENE software version 3.2 [34].
2.8 Analysis of molecular variance (AMOVA)
After obtaining the optimum number of subpopulations, an analysis of molecular variance (AMOVA) was performed using Arlequin software version 3.1 (Excoffier et al., 2005) [35] to estimate the genetic variance components within populations and between populations.
3 Results
3.1 Allelic variation among the accessions using ISSRs
Twenty-eight ISSRs were used to estimate the genetic diversity of 45 accessions of P. oleracea. A total of 167 alleles were identified, and 163 (97.6%) of them were polymorphic. The sizes of the amplicons ranged from 200 to 1500 bp (Fig. 2). The number of alleles for each ISSR ranged from three (ISSR20) to nine (ISSR15 and ISSR24) with a mean of 5.96. The PIC values for the evaluated 28 ISSR primers were moderately high (0.223 to 0.375), with a mean value of 0.337, indicating that the ISSR primers used in this study were effective and polymorphic (Table 3). The maximum numbers of effective alleles (1.766) were found in ISSR2 and the lowest alleles were detected in ISSR10 (Table 3). Furthermore, the highest expected heterozygosity was estimated in ISSR2 (0.499) and the lowest was recorded in ISSR10 (0.257) with the mean value of 0.433. The Nei's index varied from 0.215 to 0.427 with the highest value in ISSR2 and the lowest in ISSR10 and the mean value was 0.346, whereas the Shannon's information index varied from 0.330 to 0.616 with the highest value in ISSR2 and the lowest in ISSR20 with the mean value of 0.513 (Table 3).
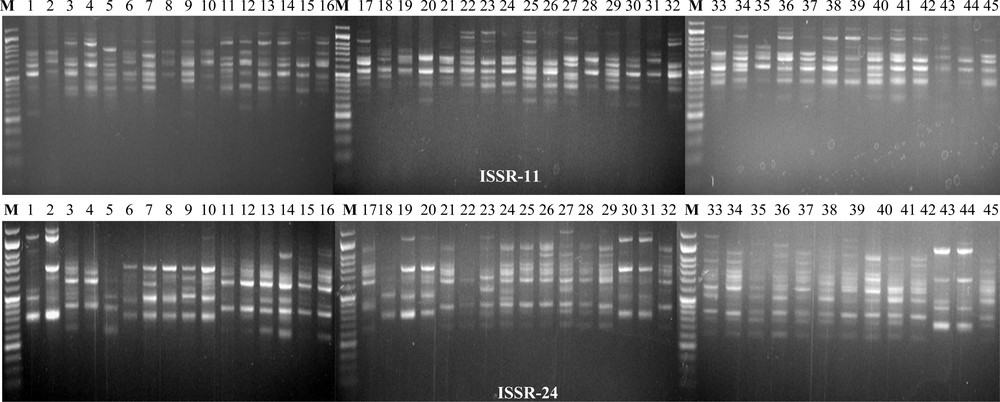
Polymorphic banding patterns of ISSR11 and ISSR24 among all 45 genotypes. Lane M: 50 bp DNA ladder (Genedirex) (1 = Ac1; 2 = Ac2; 3 = Ac3; 4 = Ac4; 5 = Ac5; 6 = Ac6; 7 = Ac7; 8 = Ac8; 9 = Ac9; 10 = Ac10; 11 = Ac11; 12 = Ac12; 13 = Ac13; 14 = Ac14; 15 = Ac15; 16 = Ac16; 17 = Ac17; 18 = Ac8, 19 = Ac19; 20 = Ac20; 21 = Ac21; 22 = Ac22; 23 = Ac23; 24 = Ac24; 25 = Ac25; 26 = Ac26; 27 = Ac27; 28 = Ac28; 29 = Ac29; 30 = Ac30; 31 = Ac31; 32 = Ac32; 33 = Ac33; 34 = Ac34; 35 = Ac35; 36 = Ac36; 37 = Ac37; 38 = Ac38; 39 = Ac39; 40 = Ac40; 41 = Ac41; 42 = Ac42; 43 = Ac43; 44 = Ac44 and 45 = Ac45).
Genetic diversity parameters among 28 ISSR markers for all 45 accessions of P. oleracea.
| Locus | Observed number of alleles | Effective number of alleles | Expected heterozygosity | Polymorphic Information Content (PIC) | Nei's index | Shannon's information index |
| ISSR1 | 5 | 1.638 | 0.4656 | 0.357 | 0.359 | 0.524 |
| ISSR2 | 4 | 1.766 | 0.4999 | 0.375 | 0.427 | 0.616 |
| ISSR3 | 7 | 1.595 | 0.4701 | 0.360 | 0.335 | 0.498 |
| ISSR4 | 4 | 1.597 | 0.4701 | 0.360 | 0.360 | 0.542 |
| ISSR5 | 5 | 1.706 | 0.4917 | 0.371 | 0.412 | 0.603 |
| ISSR6 | 7 | 1.551 | 0.4923 | 0.371 | 0.326 | 0.493 |
| ISSR7 | 6 | 1.543 | 0.4999 | 0.375 | 0.323 | 0.489 |
| ISSR8 | 5 | 1.630 | 0.3911 | 0.315 | 0.361 | 0.533 |
| ISSR9 | 5 | 1.666 | 0.4414 | 0.344 | 0.374 | 0.548 |
| ISSR10 | 5 | 1.339 | 0.2565 | 0.224 | 0.215 | 0.352 |
| ISSR11 | 6 | 1.525 | 0.4701 | 0.360 | 0.311 | 0.474 |
| ISSR12 | 5 | 1.669 | 0.4502 | 0.349 | 0.378 | 0.559 |
| ISSR13 | 7 | 1.394 | 0.3084 | 0.261 | 0.238 | 0.369 |
| ISSR14 | 8 | 1.757 | 0.4918 | 0.371 | 0.423 | 0.612 |
| ISSR15 | 9 | 1.704 | 0.4838 | 0.367 | 0.391 | 0.561 |
| ISSR16 | 8 | 1.667 | 0.4938 | 0.372 | 0.383 | 0.565 |
| ISSR17 | 7 | 1.642 | 0.4787 | 0.364 | 0.383 | 0.569 |
| ISSR18 | 8 | 1.691 | 0.4938 | 0.372 | 0.380 | 0.552 |
| ISSR19 | 7 | 1.557 | 0.3018 | 0.256 | 0.339 | 0.514 |
| ISSR20 | 3 | 1.395 | 0.3018 | 0.256 | 0.220 | 0.330 |
| ISSR22 | 5 | 1.437 | 0.4182 | 0.331 | 0.280 | 0.440 |
| ISSR23 | 4 | 1.597 | 0.3859 | 0.311 | 0.361 | 0.544 |
| ISSR24 | 9 | 1.717 | 0.4908 | 0.370 | 0.413 | 0.602 |
| ISSR25 | 7 | 1.368 | 0.3044 | 0.258 | 0.221 | 0.349 |
| ISSR26 | 6 | 1.692 | 0.4394 | 0.343 | 0.394 | 0.579 |
| ISSR27 | 5 | 1.565 | 0.4384 | 0.342 | 0.349 | 0.529 |
| ISSR28 | 6 | 1.546 | 0.4867 | 0.368 | 0.337 | 0.514 |
| ISSR30 | 4 | 1.683 | 0.4287 | 0.337 | 0.387 | 0.568 |
| Mean | 5.96 | 1.594 | 0.4338 | 0.337 | 0.346 | 0.515 |
3.2 Cluster analysis
The ISSR marker data from the selected primers were subjected to cluster analysis using NTSYS program. The similarity was constructed using Dice coefficient method. Cluster analysis was done to group the genotypes into a dendrogram. From this dendrogram, the 45 purslane accessions were grouped into seven major clusters at a coefficient of 0.76 and the similarity coefficient value ranged from 0.53 to 0.91.
Cluster VII consisted of 22 accessions and is the biggest group among seven clusters, followed by cluster VI which contained nine accessions; cluster III comprised five accessions; cluster II four accessions; cluster I and IV were both composed of four accessions and only Ac18 formed single group in cluster V (Fig. 3 and Table 4). The genetic differences between 45 P. oleracea accessions ranged from 0.91 to 0.38 where the highest distance was observed between Ac24 and Ac23 and the lowest distance was found between Ac42 and Ac10 (see Supplementary data). The pairwise population matrix of Nei's genetic distance according to seven states has been presented in Table 5. The highest genetic distance (0.29) was observed between the Penang and Negeri Sembilan populations, while the least (0.08) was found in the Negeri Sembilan one in relation to Selangor.
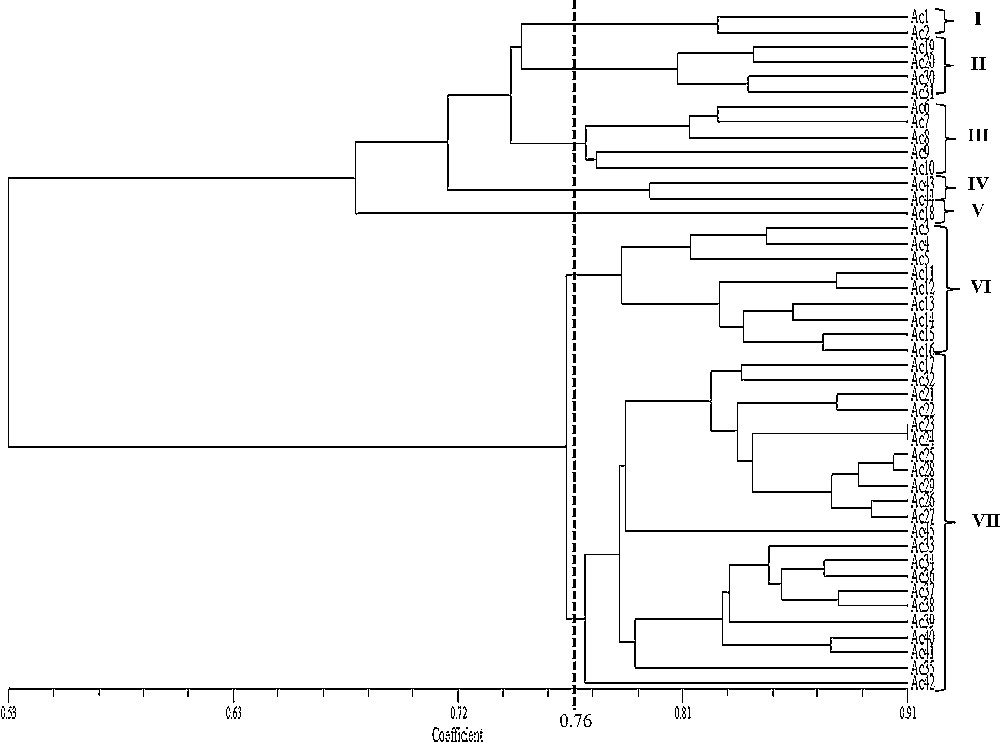
Dendrogram based on unweighted pair group method with arithmetic average (UPGMA), depicting the genetic relationship among the P. oleracea accessions from Western Peninsular Malaysia.
Accessions in their corresponding clusters as shown by the ISSR-based dengrogram using unweighted pair group method with arithmetic average (UPGMA) method.
| Clusters | Accessions |
| Cluster I | Ac1 and Ac2 = 2 accessions |
| Cluster II | Ac19, Ac20, Ac30 and Ac31 = 4 accessions |
| Cluster III | Ac6, Ac7, Ac8, Ac9 and Ac10 = 5 accessions |
| Cluster IV | Ac43 and Ac44 = 2 accessions |
| Cluster V | Ac18 = 1 accession |
| Cluster VI | Ac3, Ac4, Ac5, Ac11, Ac12, Ac13, Ac14, Ac5 and Ac16 = 9 accessions |
| Cluster VII | Ac17, Ac21, Ac22, Ac23, Ac24, Ac25, Ac26, Ac27, Ac28, Ac29, Ac32, Ac33, Ac34, Ac5, Ac36, Ac37, Ac38, Ac39, Ac40, Ac41, Ac42 and Ac45 = 22 accessions |
Pairwise population matrix of Nei genetic distance using ISSR markers.
| States | Selangor | Melaka | Negeri Sembilan | Kedah | Perak | Penang | Perlis |
| Selangor | 0.00 | ||||||
| Melaka | 0.25 | 0.00 | |||||
| Negeri Sembilan | 0.08 | 0.28 | 0.00 | ||||
| Kedah | 0.15 | 0.18 | 0.14 | 0.00 | |||
| Perak | 0.12 | 0.19 | 0.13 | 0.09 | 0.00 | ||
| Penang | 0.26 | 0.20 | 0.29 | 0.13 | 0.12 | 0.00 | |
| Perlis | 0.10 | 0.27 | 0.10 | 0.14 | 0.11 | 0.19 | 0.00 |
3.3 Principal component analysis
PCA analysis was done to see the displacement of the accessions and to further confirm the clustering pattern obtained from the dendrogram. The result of the three-dimensional (3D) and two-dimensional (2D) plots of PCA for ISSR marker analysis was also similar to that of clustering in the dendrogram (Figs. 4 and 5). Eigenvectors help to show the contribution from each axis (pc1–pc3) to the total variation present in the germplasm. Principal components analysis (PCA) indicated the first three axes accounted for 57.7% of total variation among all the accessions studied. The first, second and third axes represented 36.2, 16.7 and 4.8% of the variation respectively (Table 7). From PC1, the highest value was 0.196 followed by 0.195 and 0.194 while the least were–0.035,–0.014, and–0.013, respectively. The highest (0.196) was found in Ac25, while the least was found in Ac43.
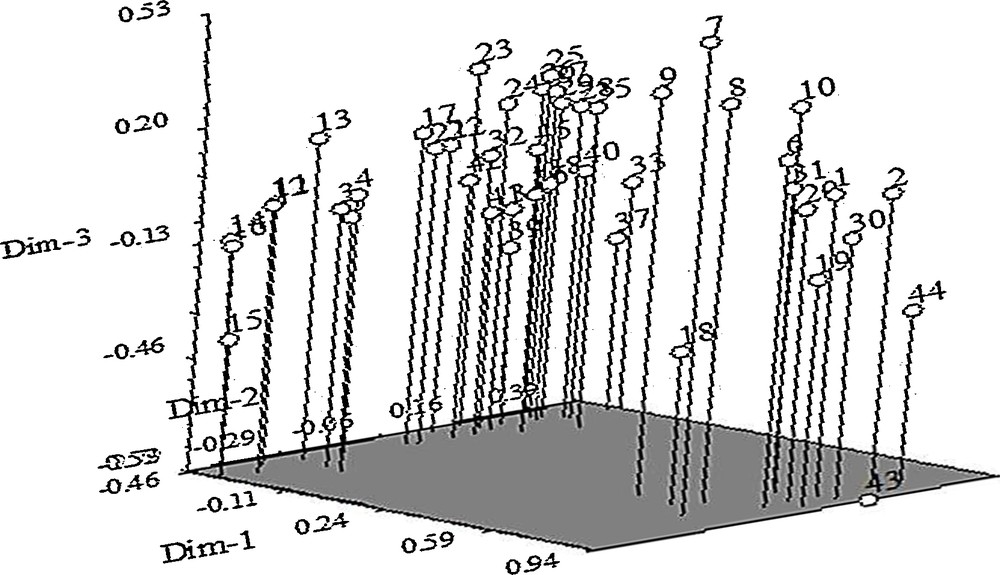
Three-dimensional plots of PCA indicating relationships among 45 purslane accessions based on ISSR markers (1 = Ac1; 2 = Ac2; 3 = Ac3; 4 = Ac4; 5 = Ac5; 6 = Ac6; 7 = Ac7; 8 = Ac8; 9 = Ac9; 10 = Ac10; 11 = Ac11; 12 = Ac12; 13 = Ac13; 14 = Ac14; 15 = Ac15; 16 = Ac16; 17 = Ac17; 18 = Ac8, 19 = Ac19; 20 = Ac20; 21 = Ac21; 22 = Ac22; 23 = Ac23; 24 = Ac24; 25 = Ac25; 26 = Ac26; 27 = Ac27; 28 = Ac28; 29 = Ac29; 30 = Ac30; 31 = Ac31; 32 = Ac32; 33 = Ac33; 34 = Ac34; 35 = Ac35; 36 = Ac36; 37 = Ac37; 38 = Ac38; 39 = Ac39; 40 = Ac40; 41 = Ac41; 42 = Ac42; 43 = Ac43; 44 = Ac44 and 45 = Ac45).
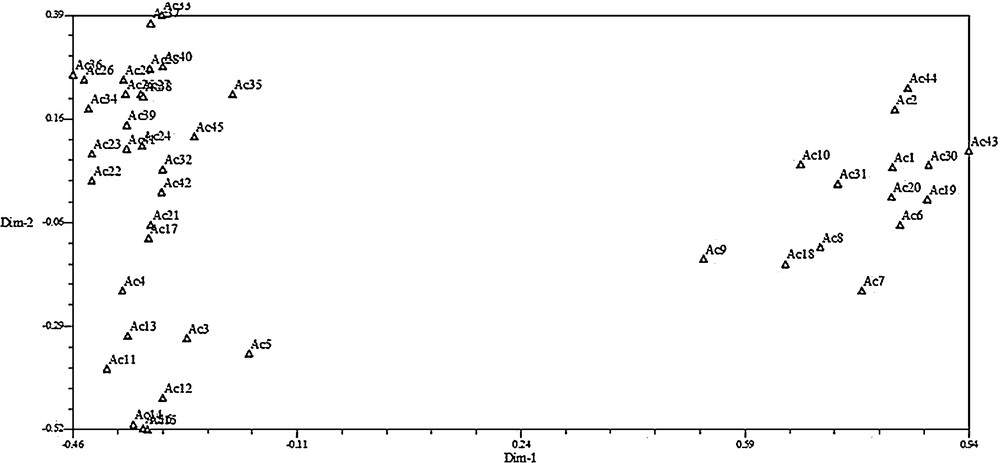
Two-dimensional plots of PCA indicating relationships among 45 purslane accessions based on ISSR markers.
Principal component analysis and percentage variation with first three principal components for 45 purslane accessions by ISSR markers.
| Accessions | PC1 | PC2 | PC3 |
| Percent | 36.2 | 16.7 | 4.8 |
| Cumulative | 36.2 | 52.9 | 57.8 |
| Ac1 | –0.01 | –0.276 | 0.016 |
| Ac2 | –0.013 | –0.256 | 0.071 |
| Ac3 | 0.165 | –0.018 | –0.218 |
| Ac4 | 0.181 | 0.014 | –0.152 |
| Ac5 | 0.143 | –0.029 | –0.218 |
| Ac6 | 0.002 | –0.294 | –0.051 |
| Ac7 | –0.011 | –0.254 | –0.126 |
| Ac8 | 0.021 | –0.275 | –0.081 |
| Ac9 | 0.043 | –0.222 | –0.086 |
| Ac10 | 0.024 | –0.259 | 0.058 |
| Ac11 | 0.174 | 0.037 | –0.248 |
| Ac12 | 0.175 | –0.012 | –0.286 |
| Ac13 | 0.189 | –0.003 | –0.225 |
| Ac14 | 0.167 | 0.017 | –0.302 |
| Ac15 | 0.166 | 0.024 | –0.249 |
| Ac16 | 0.169 | 0.018 | –0.303 |
| Ac17 | 0.186 | –0.019 | –0.093 |
| Ac18 | 0.015 | –0.224 | –0.098 |
| Ac19 | –0.012 | –0.294 | 0 |
| Ac20 | –0.004 | –0.28 | –0.027 |
| Ac21 | 0.184 | –0.017 | –0.057 |
| Ac22 | 0.194 | 0.019 | –0.011 |
| Ac23 | 0.171 | 0.044 | 0.051 |
| Ac24 | 0.184 | –0.013 | 0.065 |
| Ac25 | 0.196 | –0.01 | 0.134 |
| Ac26 | 0.195 | 0.021 | 0.156 |
| Ac27 | 0.193 | –0.014 | 0.117 |
| Ac28 | 0.19 | –0.02 | 0.183 |
| Ac29 | 0.185 | 0 | 0.168 |
| Ac30 | –0.014 | –0.285 | 0.028 |
| Ac31 | 0.02 | –0.277 | –0.014 |
| Ac32 | 0.174 | –0.009 | 0.012 |
| Ac33 | 0.185 | –0.019 | 0.224 |
| Ac34 | 0.187 | 0.032 | 0.122 |
| Ac35 | 0.159 | –0.031 | 0.121 |
| Ac36 | 0.193 | 0.035 | 0.168 |
| Ac37 | 0.176 | 0.002 | 0.238 |
| Ac38 | 0.181 | –0.008 | 0.134 |
| Ac39 | 0.182 | 0.008 | 0.097 |
| Ac40 | 0.188 | –0.033 | 0.176 |
| Ac41 | 0.181 | 0.005 | 0.047 |
| Ac42 | 0.156 | 0.013 | –0.015 |
| Ac43 | –0.035 | –0.245 | 0.102 |
| Ac44 | –0.008 | –0.263 | 0.127 |
| Ac45 | 0.169 | –0.02 | 0.041 |
3.4 Analysis of molecular variance (AMOVA)
The analysis of molecular variance was carried out to enable differentiation of purslane population. This analysis revealed that variation within population accounted for 89% of the total variation, while among the populations was found to be 11% (Table 6). The AMOVA also expressed that variation among populations and within populations were highly significant (at P < 0.010).
AMOVA within and between 45 purslane accessions using ISSR markers.
| Source | df | SS | MS | Est. Var. | % | F st | P-value |
| Among Pops | 6 | 36.011 | 6.002 | 0.408 | 11 | 0.106 | < 0.010 |
| Within Pops | 38 | 130.679 | 3.439 | 3.439 | 89 | < 0.010 | |
| Total | 44 | 166.690 | 3.846 | 100 |
4 Discussion
The study of genetic diversity is a critical component of applied plant breeding for optimizing the choice of parents in a crop-breeding program. An effective germplasm assessment provides the scientific basis for the selection of parents/donors for recombination breeding or hybrid breeding, and to breed for specific agro-ecological conditions and situations [24]. Diversity analysis at the molecular level using PCR-based markers is the efficient and rapid method of identifying the relationships and/or differences among the genotypes [36]. Among the PCR-based markers, microsatellites are becoming more popular and suitable for large-scale analysis, both for genetic diversity and breeding research [37,38]. Proficient and consistent use of molecular markers such as ISSR for study of genetic diversity in any food crop or tree crop requires selection and application of primers which will give clear, distinct, reliable and sufficient information required to study the divergence that occurs within the crop [27]. In our research the number of polymorphic loci detected per primer combination varies according to the primer. ISSR markers amplified distinct band patterns among the 45 P. oleracea accessions and each marker revealed polymorphism.
The 28 ISSR markers detected 167 alleles (97.6%) with a mean of 5.96 showing a higher discrimination power. Also, PIC values presented a similar result (Tables 6 and 7). The observed PIC values were ranged from 0.223 to 0.375 with a mean of 0.337. Our result is in agreement with the findings of Hu and Wang [39], who estimated genetic diversity among cucumber germplasm collections using SSR and EST-SSR markers. On the other hand, the number of polymorphic bands per primer of ISSR and their average was very similar to the results described by Kumar et al. [24], who also used ISSR primers for genetic diversity analysis among sesame germplams, but our calculated PIC value was lower than their analysis.
The ISSR markers also demonstrated different levels of genetic diversity among P. oleracea accessions under the present study. Shannon's information index ranged from 0.33 to 0.62 with an average of 0.51 (Table 3). This average value was almost similar to the value reported earlier by Arolu et al. [27], who found 0.55 for Jatropha. But the present value of Shannon's index was higher than the value found by another scientist in rice [40,41] who got 0.43 and 0.34 respectively. Greater value of Shannon's information index in the present study is another indication of the presence of higher genetic diversity in the genotypes under study. Nei's gene diversity varied from 0.22 to 0.43 and their average value was 0.35, which also indicated the presence of adequate genetic diversity (Table 3). This average value was higher than the value recorded in rice by Zai-quan et al. [40] who found 0.33. The expected heterozygosity from this study was found to vary from 0.26 to 0.49 and the average value was 0.43, which was higher than the values reported by several scientists previously in jatropha [27] and in Sonneratia alba [42]. Their analyzed average expected heterozygosity values were 0.34 and 0.18 respectively.
A better resolution of the relationship among the 45 purslane accessions was provided by the UPGMA cluster analysis using ISSR markers. Seven major groups were found at similarity coefficient levels of 0.76 where the purslane accessions were widely clustered (Fig. 3) and the similarity coefficient varied from 0.53 to 0.91. It is notable that ISSRs produced seven groups, but in the subgroup of VII the number of accession was the highest (22) and the reason could be explained in this way that ISSR markers might target a larger number of repeated sequences specifically in the centromeric region that might heavily influence the classification pattern [43]. These clustering patterns prove the acceptability and adaptability of ISSR markers for the genetic diversity analysis among purslane germplasm collections.
Pairwise population matrix of Nei's genetic distance using ISSR markers also clarify the genetic distances among 45 purslane accessions collected from seven states. The highest distance was observed between Penang and Negeri Sembilan (0.29), whereas the lowest (0.08) was seen between Negeri Sembilan and Selangor (Table 5) and they are neighbor state. Genotypes under Penang and Negeri Sembilan could be used as parents in hybridizations to obtain maximum heterosis. Several authors previously described similar results [44–46]. Yan et al. [47] conducted AFLF marker based genetic diversity analysis among P. oleracea accessions sampled worldwide regarding α-linolenic fatty acid (ALA) composition analysis. Whereas the first based on taxonomy Danin et al. [48] noted the high level of diversity in Australian P. oleracea accessions which differed from those in all other parts of the world.
It was found that cluster analysis was profoundly supported by principal component analysis (PCA). The genetic diversity results that were observed under this study were supported by the consonance between cluster and PC analyses (Figs. 3–5). The first three principal components axes indicated 57.7% of total variation among all the accessions studied. ISSR-based 36.2, 16.7 and 4.8% variations were observed in the first three principal components (PC1, PC2 and PC2) from the eigenvectors analysis (Table 7).
The AMOVA revealed that the higher percentage of variation was attributed to variation within populations (89%), followed by variation among populations (11%; Table 6). This indicates that ISSR marker was able to detect higher variation within and among populations of P. oleracea accessions. Li et al. [49] opined that, assessment of genetic diversity within a population is essential to characterize germplasm and provides insights into evolutionary aspects, conservation, utilization, and establishment of breeding programs.
5 Conclusions
Genetic diversity in any crop is basically important for improving heterotic crop genotypes over the existing ones. The user-friendly nature of ISSR markers was successfully exploited in many crop species for a better understanding of the genetic diversity, domestication process and geographic divergence and distribution. But this is the first report on using ISSR markers to study the genetic diversity on P. oleracea germplasm collections. There was a high level of genetic diversity among accessions of P. oleracea in this study, suggesting that ISSR markers were very effective in the detection of polymorphism in this species. To broaden the genetic base and improvement of P. oleracea, accession populations having the lowest genetic similarities could be selected as parents. Therefore, hybridization should be made between two distant populations. Purslane is already proved as moderate to high tolerant to salinity and drought and rich in vitamins, minerals and antioxidant properties, which has made this plant a unique candidate for future vegetable research. Considering all these criteria and results from marker-assisted diversity analysis accessions that are far apart based on their genetic coefficient (like Ac1 and Ac42; Ac19 and Ac45; Ac9 and Ac23; Ac18 and A25; Ac24 and Ac18) could be selected as parents for further breeding programs. This will bring about greater diversity, which will lead to a high productive index in terms of increase in yield and overall quality.
Disclosure of interest
The authors declare that they have no conflicts of interest concerning this article.
Acknowledgements
The authors sincerely acknowledge UPM Research University Grant (01-02-12-1695RU) for financial support of the project and International Graduate Research Fellowship (IGRF, UPM) for PhD Fellowship.