

1 Introduction
Barley is an important cereal crop in terms of productivity and global area of cultivation [1]. Cultivated barley, Hordeum vulgare L. ssp. vulgare (H. vulgare), descended from wild barley, H. vulgare L. ssp. spontaneum (H. spontaneum). Barley is a self-pollinating diploid with 7 pairs of chromosomes and a nuclear genome size of 5.1 Gb [2], and it harbors high levels of genetic variation [3,4] that helps it survive in low input and climatically marginal climates. Although H. vulgare is well-studied in terms of genetics, genomics and breeding, little is known about the genetic makeup and genome function of its wild ancestor H. spontaneum. Cultivated barley was earlier reported to contain about 40% of H. spontaneum alleles [5].
Salt tolerance in wild barley has been reviewed by many researchers because it provides a rich source of genes that can be transferred to other crop plants by genetic transformation as well as to cultivated barley by classical breeding methods [6,7]. For plants to survive under salt stress, they must be able to activate cascades of molecular networks involved in stress perception or sensing [8], signal transduction [9], as well as the induction of specific stress-related genes and their encoded metabolites [10–12]. Some of the signaling pathways are specific, but others may cross talk; e.g., MAPK cascades and the cross talk between ABA signaling and biotic signaling [13]. Previous studies on various plant species demonstrated that cross talk involves complex networks of gene regulation [14,15], some of which are mediated by plant hormones such as abscisic acid [9] and ethylene [16], and influenced through specific transcription factors [17]. Cross talk also results in the expression of diverse functional genes for osmoregulation, cell protection and acclimation, such as dehydrins, aquaporins and chaperones [10,12,18].
A draft genome sequence of cultivated barley has been recently described [2] and transcript profiling for the cataloguing of stress-responsive genes has been reported [19,20]. The present study utilizes mRNA-Seq analysis of leaves of the wild barley (H. spontaneum) to examine salt-related genes and biological processes in order to discover novel genes and transcription factors to improve the understanding of the mechanisms underlying the process of salt stress tolerance. The RNA-Seq method has considerable potential to generate high-resolution transcriptome maps sensitive enough to display transcripts with low-levels of expression [21].
2 Materials and methods
2.1 Plant material
Seeds of the self-pollinated wild H. spontaneum were collected from a location in Rafah, North Sinai, Egypt (31.313559, 34.205973) near the Mediterranean Sea (∼38 g/L), where no specific permission is required. Besides, no endangered or protected plant or animal species are grown in this location. Seeds were germinated in the greenhouse in trays filled with potting mix consisting of vermiculite:perlite (1:1) and grown at 14 h of light per day, 80% humidity and 22 °C for two weeks and watered with half-strength Hoagland solution [22]. Seedlings were then salt stressed (500 mM NaCl or 29.22 g/L in half-strength Hoagland solution) at 0, 2, 12 and 24 h time intervals. Leaves of individual plants in three replicates were harvested at each time point except at time point 0 where only two replicates were gathered. All tissues were flash-frozen in liquid nitrogen and stored at −80 °C.
2.2 RNA isolation
Flash-frozen leaf material from individual plants was crushed into a fine powder in a microcentrifuge tube using a sterilized metal rod. Total RNAs were extracted from similar-sized leaf samples collected from emergent leaves using Trizol (Invitrogen, Life Tech, Grand Island, NY, USA) and treated with RNase-free DNase (Promega Corporation, Madison, WI, USA) in the presence of 1 U/μL of RNasin® Plus RNase Inhibitor (Promega) for 2 h at 37 °C. RNAs were quantified and 30 μg (400 ng/μL) was used for RNA-Seq. To test for the presence of DNA contamination in RNA samples, the actin gene was amplified by PCR of the original RNA samples. Purified RNA samples were shipped to Beijing Genomics Institute (BGI), Shenzhen, China in three replicates of each treatment for deep sequencing and generation of datasets (at least 100 million reads per sample).
2.3 Next-generation mRNA sequencing
Filtered reads were aligned with up to two mismatches to the cultivated barley genome as the reference after downloading the H. vulgare unigene transcript sequences from the NCBI database (http://www.ncbi.nlm.nih.gov/unigene). This database consisted of 26,941 transcripts including those annotated as complete and partial CDSs. RSEM v1.1.6, an RNA-Seq quantification tool, was used to estimate the relative abundances and expected read counts for the transcripts. By default, RSEM uses the Bowtie aligner (Bowtie v0.12.1) to map the reads against the transcripts. Transcript quantification of the reference-aligned reads was performed with RSEM, which allowed for the assessment of transcript abundances based on the mapping of RNA-Seq reads to the assembled transcriptome.
Expected read counts were used as input to differential expression analysis by EdgeR (version 3.0.0, R version 2.1.5). Because we had three biological replicates per time point, the median of these values was used as the common dispersion factor for differential expression (DE) analyses. The remaining unmapped sequences were re-aligned against the contigs collectively assembled de novo using the Trinity RNA-Seq Assembly package (r2013-02-25) from total unmapped sequences of all treatments and replicates. Trinity was selected for transcriptome assembly based on recent studies that showed that it performs better than other available methods [23]. DE transcripts were annotated using blast-2-GO software (version 2.3.5, http://www.blast2go.org/). Blastx was performed against the NCBI non-redundant protein database with an E-value cut off of 1 e−5. GO terms were obtained for mapped and unmapped barley transcripts with the default parameters.
To identify clusters with functional enrichment, we determined a significant Pearson correlation through permutation analysis [24]. The resulting clusters were refined by visual inspection and analyzed for GO term enrichment using Blast2GO (http://www.blast2go.org/). We also clustered the RPKM data to provide a representation of absolute abundance of the transcripts.
2.4 Validation of RNA-seq findings by real time PCR
Six transcripts were randomly selected for validating the RNA-Seq data by real time PCR with the actin gene as the reference [25]. Primers were designed using Netprimer software (http://www.premierbiosoft.com/netprimer/index.html) with the following criteria: length ∼20 bases, GC content ∼50%, minimal secondary structures, comparable annealing temperatures (55 °C) of the primer pairs, and PCR products of ∼500 bp. Total RNAs were extracted from individual plants salt-stressed for 2, 12 and 24 h and control plants. Extraction was done in three replicates and RNAs from each treatment were then bulked. Expression levels of transcripts were detected by real time PCR using the Agilent Mx3000P qPCR Systems (Agilent technology, USA). First-strand cDNA was synthesized using 1 μg of total RNA, 0.5 μg of reverse primers of each gene (Table S1) and Superscript II reverse transcriptase (Invitrogen). All cDNA-synthesized samples were diluted (1:10) prior to amplification. The reaction (25 μL) components were 12.5 μL Maxima™ SYBR Green/ROX qPCR master mix, 0.2 μM of each gene forward and reverse primers (Table S1), and PCR-grade water was added up to 22.5 μL. Finally, 2.5 μL of diluted cDNA template were added to the reaction mix. Forty PCR cycles for each gene product included denaturation at 94 °C for 15 s, annealing at 55 °C for 30 s, and extension at 72 °C for 45 s. Amplification for each sample was carried out in triplicate along with a no-template control (NTC, PCR-grade water). Data was collected and amplification plots of ΔRn versus cycle number were generated for analysis. Calculations were made to detect the expression level of each gene under a given treatment relative to its expression under control condition.
3 Results
3.1 Analysis of RNA-Seq datasets
Sequencing of cDNA samples yielded between 103 and 115 million reads corresponding to over 10 billion nucleotides per sample (Table 1). The raw sequencing reads were deposited in the Small Read Archive (SRA) at GenBank (accession number SRP032854). Between 74.8 and 80.3% of the wild barley reads could be mapped to the cultivated barley reference genome; the remaining 20–25% matched no sequences (Table 1). The percentage of transcripts of wild barley found in H. vulgare unigene database (unigene-mapped) ranged from 77.4 to 81.7%. All mapped sequences were in exonic regions of the genome. The unmapped wild barley reads of all treatments and replicates were assembled de novo and the resulting contigs were used as a new reference genome. Then, the unmapped wild barley reads were aligned to this new reference genome and results indicated that between 94.3 and 95.3% of them were de novo-mapped to the new reference. The total number of transcripts generated from alignment with both reference genomes ranged from 54,572 to 59,353. The percentage of transcripts generated from alignment with the wild barley genome contigs ranged from 60.9 to 63.9%.
Statistics of RNA-Seq numerical data analysis of Horduem spotanium.
| Filea name | Treatment time (h) | Total number of readsb | Number of mapped reads (unigene)c | %d of reads | Number of unmapped reads (unigene)e | Number of reads mapped (de novo)f | %g of reads | Number of unmappedh reads | Number of transcripts (unigene)i | % of transcriptsj | Number of transcripts (de novo)k | Number of transcripts (Total)l |
| Bs2c_1.fastq/Bs2c_2.fastq | 0 | 106,495,036 | 85,560,630 | 80.3 | 20,934,406 | 19,814,424 | 94.7 | 1,119,982 | 21,160 | 78.5 | 33,962 | 55,122 |
| Bs3c_1.fastq/Bs3c_2.fastq | 0 | 115,111,594 | 91,065,533 | 79.1 | 24,046,061 | 22,922,643 | 95.3 | 1,123,418 | 21,698 | 80.5 | 33,830 | 55,528 |
| Bs1_2_1.fastq/Bs1_2_2.fastq | 2 | 104,137,914 | 79,466,902 | 76.3 | 24,671,012 | 23,417,657 | 94.9 | 1,253,355 | 21,518 | 80.0 | 37,498 | 59,016 |
| Bs2_2_1.fastq/Bs2_2_2.fastq | 2 | 111,668,026 | 83,885,570 | 75.1 | 27,782,456 | 26,366,413 | 94.9 | 1,416,043 | 21,439 | 80.0 | 37,914 | 59,353 |
| Bs3_2_1.fastq/Bs3_2_2.fastq | 2 | 106,843,457 | 81,125,022 | 75.9 | 25,718,435 | 24,274,948 | 94.4 | 1,443,487 | 21,687 | 80.5 | 37,319 | 59,006 |
| Bs1_12_1.fastq/Bs1_12_2.fastq | 12 | 110,659,611 | 83,224,420 | 75.2 | 27,435,191 | 26,120,724 | 95.2 | 1,314,467 | 20,702 | 76.8 | 35,890 | 56,592 |
| Bs2_12_1.fastq/Bs2_12_2.fastq | 12 | 106,831,568 | 80,825,061 | 75.7 | 26,006,507 | 24,649,525 | 94.8 | 1,356,982 | 21,418 | 80.0 | 36,467 | 57,885 |
| Bs3_12_1.fastq/Bs3_12_2.fastq | 12 | 103,860,256 | 77,694,090 | 74.8 | 26,166,166 | 24,841,786 | 94.9 | 1,324,380 | 21,747 | 80.7 | 36,572 | 58,319 |
| Bs1_24_1.fastq/Bs1_24_2.fastq | 24 | 112,611,535 | 87,575,012 | 77.8 | 25,036,523 | 23,769,264 | 94.9 | 1,267,259 | 20,841 | 77.4 | 33,731 | 54,572 |
| Bs2_24_1.fastq/Bs2_24_2.fastq | 24 | 113,972,947 | 89,370,676 | 78.4 | 24,602,271 | 23,437,546 | 95.3 | 1,164,725 | 21,346 | 79.2 | 34,425 | 55,771 |
| Bs3_24_1.fastq/Bs3_24_2.fastq | 24 | 112,207,066 | 89,834,579 | 80.1 | 22,372,487 | 21,098,577 | 94.3 | 1,273,910 | 22,017 | 81.7 | 34,277 | 56,294 |
a Names of RNA-Seq files.
b Total number of reads recovered from wild barley RNA-Seq.
c Number of wild barley reads aligned with Hordeum vulgare reference genome in the unigene database of NCBI (http://www.ncbi.nlm.nih.gov/unigene).
d Percentage of wild barley reads aligned with H. vulgare reference genome.
e Number of reads unaligned with H. vulgare reference genome.
f Number of reads aligned with the new (de novo-assembled) wild barley reference genome generated from contigs generated by de novo-assembly from total unaligned wild barley reads of all treatments and replicates with the reference H. vulgare genome.
g Percentage of reads aligned with the new (de novo-assembled) wild barley reference genome.
h Number of reads unaligned with the new wild barley reference genome.
i Number of wild barely transcripts found in H. vulgare unigene database.
j Percentage of wild barely transcripts found in H. vulgare unigene database.
k Number of wild barley transcripts generated from alignment with the new reference genome.
l Total number of wild barley transcripts generated from alignment with the two reference genomes.
3.2 Clusters of gene expression across time of salt treatment
RNA-Seq data was used to detect the differential expression (DE) of previously annotated barley transcripts, as well as novel transcripts uncovered in this study. To statistically obtain confirmation of the differences in gene expression across treatment time, RPKM-derived read counts were compared using a likelihood ratio test [21]. Statistical analysis was reliable when applied to genes with an RPKM value ≥ 2. To determine DE transcripts, a two-fold (or greater) change in expression and false discovery rate (FDR) of 10−3 or less was required. The resulting number of DE transcripts was 9277 (Fig. 1a), 3861 of which represent DE transcripts from the alignment with H. vulgare reference genome in the unigene database (Fig. 1b). The remaining DE transcripts (5416) resulted from the alignment with the generated wild barley reference genome (Fig. 1c). The number of unigene-mapped DE transcripts with no blast hits was less than 100, while that of de novo-mapped transcripts was over 2300 (Fig. 1b and c, respectively).

(Color online.) Total number of differentially expressed (DE) transcripts under salt stress: a: total number of DE transcripts (9277 transcripts) subjected to blast2go resulting from reads either aligned or unaligned with Hordeum vulgare reference genome in the unigene database of NCBI (http://www.ncbi.nlm.nih.gov/unigene); b: number of DE transcripts (3861 transcripts) aligned with H. vulgare reference genome; c: number of DE transcripts (5416 transcripts) unaligned with H. vulgare reference genome.
Annotated unigene- and de novo-mapped transcripts (5100) were utilized in generating the expression clusters across time of salt stress treatment. Expression profiles of the DE transcripts were determined by a cluster analysis based on the k-means method using Pearson's correlation distance so that the similarity in relative change for each transcript or among transcripts across time of salt treatment was determined. These data were then subjected to hierarchical clustering using the Pearson correlation as the distance metric. Fig. 2 shows the expression clusters for the DE transcripts mapped on the H. vulgare reference genome (Fig. 2a) and those mapped on the de novo-assembled wild barley reference genome using the unigene unmapped reads (Fig. 2b). Two-dimensional hierarchical clustering classified DE profiles into nine expression clusters according to the similarity of their expression profiles. Visual inspection of these expression groups suggested diverse and complex patterns of regulation. Four out of the nine expression clusters were selected for further comparisons across the time of salt tolerance treatment (Fig. 3). In general, heterogeneity and redundancy were two significant characteristics for selection. Another criterion for selection was the importance of the expression pattern. We did not have a cluster for genes that were upregulated at 2, 12 and 24 h. All upregulated genes at the 2 h time point returned to the 0 h expression level either at 12 or 24 h time points (Fig. 3a–b). We selected both expression patterns as two clusters of upregulation. The third cluster includes transcripts that were downregulated at 2, 12 and 24 h time points (Fig. 3d), and the fourth represents downregulated transcripts at 2 and 12 h time points then returned to the 0 h expression level at 24 h time point (Fig. 3c).
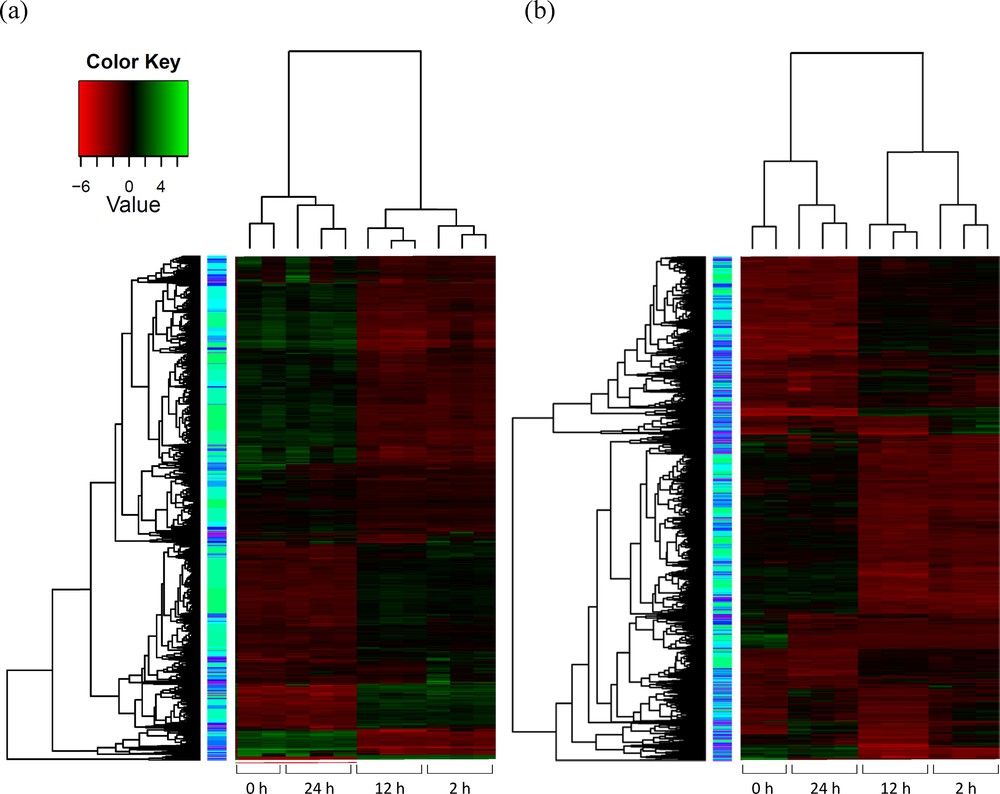
(Color online.) Hierarchical cluster analysis of gene expression based on log ratio RPKM data for transcripts. Reads were either aligned (a) or unaligned (b) with H. vulgare reference genome in the unigene database of NCBI (http://www.ncbi.nlm.nih.gov/unigene).

(Color online.) Four selected clusters of gene expression under salt stress (C1 (a), C2 (b), C3 (c) and C4 (d)). See Table 3 for transcripts generated from reads either aligned or unaligned with H. vulgare reference genome in the unigene database of NCBI (http://www.ncbi.nlm.nih.gov/unigene).
3.3 Validation of transcript profiles by real time PCR
Real time PCR of six randomly selected DE transcripts from the mRNA-Seq data resulted in successful amplification of the bands of expected sizes (Fig. S1). Quantification of the band intensities in relation to the actin control supported the direction of change of expression as detected by mRNA-Seq for these transcripts in which expression pattern of four of them fit within cluster 2, while those of the other two fit within cluster 3.
3.4 Analysis of differentially expressed genes
Differentially expressed genes were assigned to functional categories using blast2GO (http://www.blast2go.org/), which provided a valuable resource for detecting specific processes, functions, and pathways during salt stress in wild barley. The results indicated that 3184, 4189 and 4106 transcripts were assigned to the three main categories; “biological process”, “cellular component” and “molecular function”, respectively (Tables 2–4). Most transcripts were assigned to the cluster 3 pattern of gene expression for downregulated transcripts across time of treatment followed by cluster 2 for upregulated transcripts at 2 and 12 h time points (Fig. 3). The number of transcripts recovered by gene ontology analysis for the three main categories was higher than the total number of DE transcripts, which likely indicates that some transcripts were assigned to more than one category. The same criterion was observed for the number of subgroups in a functional group. The numbers of functional groups for the three main categories were 21, 8 and 12 transcripts, respectively (Tables 2–4). The numbers of subgroups within groups of the three categories were 71, 12 and 49 transcripts, respectively. In the three categories, numbers of groups for cluster(s) with more than 1000 transcripts were 2, 3 and 2, respectively. These groups were “cellular process” and “metabolic process” for the “biological process” category, “membrane”, “organelle” and “cell” for the “cellular component” category, and “binding” and “catalytic activity” for the “molecular function” category. The numbers of subgroups for cluster(s) with more than 1000 transcripts were 3, 3 and 0, respectively. These subgroups were “primary metabolic process”, “macromolecule metabolic process” and “cellular metabolic process” for the “biological process category”, and “membrane-bounded organelle”, “organelle part” and “cell part” for the “cellular component” category (Tables 2–4). There were some groups and subgroups of the three main categories in which DE transcripts were either upregulated (clusters 1 and/or 2) or downregulated (clusters 3 and/or 4). The most important components were “cell–cell signaling” (cluster 2) and “cell death” (clusters 3 and 4) subgroups of the “biological process” category and the “electron carrier activity”, “superoxide dismutase activity”, “electron transporter transferring electrons within the cyclic and noncyclic electron transport pathways of photosynthesis activity”, “electron transporter transferring electrons within cytochrome b6/f complex of photosystem II activity” and “structural constituent of cytoskeleton” (clusters 1 and 2) subgroups of the “molecular function” category. There were six subgroups in the “response to stimulus” group that demonstrated both upregulation and downregulation of many different transcripts under salt stress. These subgroups were “cellular response to stimulus”, “response to abiotic stimulus”, “response to stress”, “response to external stimulus”, “response to endogenous stimulus”, and “response to chemical stimulus”.
GO functional categorization of DE barley transcripts based on biological process. C1, C2, C3 and C4 represent four clusters of gene expression patterns under salt stress.
| Level | GO ID | GO Term | *C1 | C2 | C3 | C4 |
| 1 | GO:0008150 | Biological Process | 80 | 505 | 2422 | 177 |
| 2 | GO:0008283 | Cell proliferation | 4 | 5 | ||
| 2 | GO:0002376 | Immune system process | 8 | 66 | ||
| 3 | GO:0002252 | Immune effector process | 2 | 2 | 8 | |
| 2 | GO:0015976 | Carbon utilization | 2 | 6 | ||
| 2 | GO:0040007 | Growth | 1 | 15 | 46 | 2 |
| 3 | GO:0016049 | Cell growth | 1 | 15 | 37 | 1 |
| 3 | GO:0048589 | Developmental growth | 1 | 10 | 33 | |
| 2 | GO:0043473 | Pigmentation | 1 | 7 | ||
| 3 | GO:0043476 | Pigment accumulation | 1 | 7 | ||
| 2 | GO:0040011 | Locomotion | 5 | |||
| 3 | GO:0042330 | Taxis | 4 | |||
| 2 | GO:0022610 | Biological adhesion | 4 | |||
| 3 | GO:0007155 | Cell adhesion | 4 | |||
| 2 | GO:0065007 | Biological regulation | 16 | 102 | 438 | 28 |
| 3 | GO:0065008 | Regulation of biological quality | 6 | 23 | 101 | 5 |
| 3 | GO:0065009 | Regulation of molecular function | 15 | 53 | ||
| 3 | GO:0050789 | Regulation of biological process | 13 | 89 | 394 | 23 |
| 2 | GO:0051179 | Localization | 10 | 69 | 429 | 30 |
| 3 | GO:0033036 | Macromolecule localization | 3 | 12 | 112 | |
| 3 | GO:0051234 | Establishment of localization | 10 | 66 | 417 | 30 |
| 2 | GO:0000003 | Reproduction | 6 | 28 | 170 | 8 |
| 3 | GO:0019953 | Sexual reproduction | 2 | 17 | ||
| 3 | GO:0022414 | Reproductive process | 6 | 28 | 164 | 4 |
| 2 | GO:0023052 | Signaling | 1 | 35 | 95 | 22 |
| 3 | GO:0007267 | Cell-cell signaling | 1 | |||
| 2 | GO:0071840 | Cellular component organization or biogenesis | 9 | 54 | 430 | 13 |
| 3 | GO:0016043 | Cellular component organization | 9 | 51 | 385 | 13 |
| 3 | GO:0044085 | Cellular component biogenesis | 12 | 242 | ||
| 3 | GO:0071554 | Cell wall organization or biogenesis | 8 | 55 | ||
| 3 | GO:0071841 | Cellular component organization or biogenesis at cellular level | 6 | 42 | 392 | |
| 2 | GO:0009987 | Cellular process | 60 | 380 | 1899 | 126 |
| 3 | GO:0006928 | Cellular component movement | 5 | 10 | ||
| 3 | GO:0016044 | Cellular membrane organization | 3 | 89 | ||
| 3 | GO:0019725 | Cellular homeostasis | 3 | 3 | 48 | 3 |
| 3 | GO:0007017 | Microtubule-based process | 5 | 17 | ||
| 3 | GO:0007049 | Cell cycle | 5 | 19 | 31 | 1 |
| 3 | GO:0007059 | Chromosome segregation | 2 | 1 | 6 | |
| 3 | GO:0007154 | Cell communication | 2 | 43 | 131 | 23 |
| 3 | GO:0010118 | Stomatal movement | 1 | 2 | 13 | |
| 3 | GO:0019725 | Cellular homeostasis | 11 | 5 | ||
| 3 | GO:0030029 | Actin filament-based process | 3 | 24 | ||
| 3 | GO:0051641 | Cellular localization | 2 | 17 | 137 | |
| 3 | GO:0048869 | Cellular developmental process | 3 | 20 | 102 | 3 |
| 3 | GO:0051301 | Cell division | 1 | 11 | 32 | |
| 2 | GO:0016265 | Death | 3 | 39 | 3 | |
| 3 | GO:0008219 | Cell death | 39 | 3 | ||
| 2 | GO:0032502 | Developmental process | 7 | 69 | 339 | 14 |
| 3 | GO:0007568 | Aging | 1 | 8 | 5 | |
| 3 | GO:0021700 | Developmental maturation | 1 | 8 | 19 | |
| 3 | GO:0022611 | Dormancy process | 1 | 7 | ||
| 3 | GO:0048856 | Anatomical structure development | 4 | 55 | 269 | 6 |
| 2 | GO:0008152 | Metabolic process | 64 | 408 | 2022 | 135 |
| 3 | GO:0006807 | Nitrogen compound metabolic process | 25 | 120 | 701 | 19 |
| 3 | GO:0044238 | Primary metabolic process | 307 | 1453 | 91 | |
| 3 | GO:0009056 | Catabolic process | 6 | 81 | 307 | 29 |
| 3 | GO:0009058 | Biosynthetic process | 13 | 108 | 988 | 38 |
| 3 | GO:0019637 | Organophosphate metabolic process | 1 | 13 | 140 | |
| 3 | GO:0019748 | Secondary metabolic process | 1 | 5 | 83 | 4 |
| 3 | GO:0032259 | Methylation | 5 | 112 | ||
| 3 | GO:0042440 | Pigment metabolic process | 3 | 3 | 128 | |
| 3 | GO:0043170 | Macromolecule metabolic process | 38 | 182 | 1004 | 55 |
| 3 | GO:0044281 | Small molecule metabolic process | 8 | 90 | 560 | |
| 3 | GO:0055114 | Oxidation-reduction process | 6 | 69 | 476 | |
| 3 | GO:0070988 | Demethylation | 1 | |||
| 3 | GO:0071704 | Organic substance metabolic process | 4 | 41 | 254 | |
| 3 | GO:0042445 | Hormone metabolic process | 1 | 2 | 20 | |
| 3 | GO:0044237 | Cellular metabolic process | 50 | 299 | 1617 | 77 |
| 2 | GO:0032501 | Multicellular organismal process | 7 | 62 | 317 | 14 |
| 3 | GO:0007585 | Respiratory gaseous exchange | 1 | 1 | ||
| 3 | GO:0008037 | Cell recognition | 1 | 3 | ||
| 3 | GO:0007275 | Multicellular organismal development | 6 | 58 | 310 | 14 |
| 3 | GO:0043480 | Pigment accumulation in tissues | 1 | 7 | ||
| 3 | GO:0032504 | Multicellular organism reproduction | 1 | 1 | 20 | |
| 3 | GO:0009606 | Tropism | 3 | 3 | ||
| 2 | GO:0051704 | Multi-organism process | 8 | 25 | 185 | 2 |
| 3 | GO:0044419 | Interspecies interaction between organisms | 3 | 4 | ||
| 3 | GO:0035821 | Modification of morphology or physiology of other organism | 1 | 3 | ||
| 3 | GO:0051707 | Response to other organism | 7 | 22 | 171 | |
| 2 | GO:0048511 | Rhythmic process | 3 | 13 | ||
| 3 | GO:0007623 | Circadian rhythm | 3 | 13 | ||
| 2 | GO:0016032 | Viral reproduction | 2 | 3 | ||
| 3 | GO:0022415 | Viral reproductive process | 2 | 3 | ||
| 2 | GO:0050896 | Response to stimulus | 26 | 159 | 52 | 55 |
| 3 | GO:0051716 | Cellular response to stimulus | 6 | 55 | 99 | 22 |
| 3 | GO:0009628 | Response to abiotic stimulus | 9 | 998 | 388 | 14 |
| 3 | GO:0006955 | Immune response | 2 | 7 | 61 | |
| 3 | GO:0006950 | Response to stress | 19 | 92 | 435 | 26 |
| 3 | GO:0009605 | Response to external stimulus | 2 | 11 | 54 | 2 |
| 3 | GO:0009607 | Response to biotic stimulus | 7 | 23 | 172 | 12 |
| 3 | GO:0009719 | Response to endogenous stimulus | 6 | 32 | 111 | 11 |
| 3 | GO:0042221 | Response to chemical stimulus | 11 | 77 | 387 | |
| 3 | GO:0051606 | Detection of stimulus | 4 | 12 | ||
| *Time | 0 | 2 h | 12 h | 24 h | ||
| C1 (cluster 1): | Control level | Up | Down | Down | ||
| C2 (cluster 2): | Control level | Up | Up | Down | ||
| C3 (cluster 3): | Control level | Down | Down | Up | ||
| C4 (cluster 4): | Control level | Down | Down | Down |
GO functional categorization of DE barley transcripts based on cellular component. C1, C2, C3 and C4 represent four clusters of gene expression patterns under salt stress.
| Level | GO ID | GO term | *C1 | C2 | C3 | C4 |
| 1 | GO:0005575 | Cellular component | 79 | 1302 | 2636 | 172 |
| 2 | GO:0016020 | Membrane | 30 | 449 | 1110 | 62 |
| 3 | GO:0044425 | Membrane part | 6 | 57 | 416 | |
| 2 | GO:0043226 | Organelle | 66 | 837 | 2348 | 106 |
| 3 | GO:0043227 | Membrane-bounded organelle | 63 | 822 | 2304 | 104 |
| 3 | GO:0044422 | Organelle part | 12 | 76 | 1082 | 9 |
| 3 | GO:0043228 | Non-membrane-bounded organelle | 4 | 43 | 399 | 8 |
| 3 | GO:0031982 | Vesicle | 25 | 91 | 335 | |
| 3 | GO:0019867 | Outer membrane | 2 | 9 | ||
| 2 | GO:0005623 | Cell | 72 | 1189 | 2523 | 159 |
| 3 | GO:0044464 | Cell part | 72 | 1184 | 2523 | 157 |
| 2 | GO:0032991 | Macromolecular complex | 2 | 49 | 532 | 3 |
| 3 | GO:0043234 | Protein complex | 2 | 28 | 226 | |
| 3 | GO:0032993 | Protein-DNA complex | 15 | |||
| 2 | GO:0005576 | Extracellular region | 5 | 35 | 159 | 9 |
| 3 | GO:0048046 | Apoplast | 4 | 7 | 143 | |
| 3 | GO:0044421 | Extracellular region part | 2 | |||
| 2 | GO:0055044 | Symplast | 5 | 9 | 48 | |
| 2 | GO:0031974 | Membrane-enclosed lumen | 30 | 179 | 9 | |
| 2 | GO:0030054 | Cell junction | 5 | 9 | 48 | |
| 3 | GO:0005911 | Cell-cell junction | 5 | 9 | 48 |
GO functional categorization of DE barley transcripts based on molecular function. C1, C2, C3 and C4 represent four clusters of gene expression patterns under salt stress.
| Level | GO ID | GO term | *C1 | C2 | C3 | C4 |
| 1 | GO:0003674 | Molecular function | 97 | 1459 | 2368 | 182 |
| 2 | GO:0060089 | Molecular transducer activity | 1 | 27 | 27 | |
| 2 | GO:0000988 | Protein binding transcription factor activity | 2 | |||
| 3 | GO:0000989 | Transcription factor binding transcription factor activity | 2 | |||
| 2 | GO:0045735 | Nutrient reservoir activity | 1 | 4 | ||
| 2 | GO:0016209 | Antioxidant activity | 2 | 33 | ||
| 3 | GO:0004784 | Superoxide dismutase activity | 3 | 2 | ||
| 3 | GO:0004601 | Peroxidase activity | 2 | 22 | ||
| 2 | GO:0005488 | Binding | 66 | 982 | 1414 | 134 |
| 3 | GO:0001871 | Pattern binding | 4 | 6 | 9 | |
| 3 | GO:0003676 | Nucleic acid binding | 19 | 265 | 375 | 23 |
| 3 | GO:0003682 | Chromatin binding | 5 | |||
| 3 | GO:0005515 | Protein binding | 6 | 141 | 160 | 16 |
| 3 | GO:0008144 | Drug binding | 9 | |||
| 3 | GO:0008289 | Lipid binding | 1 | 23 | 13 | 4 |
| 3 | GO:0008430 | Selenium binding | 5 | |||
| 3 | GO:0019825 | Oxygen binding | 1 | 4 | ||
| 3 | GO:0030246 | Carbohydrate binding | 4 | 19 | 24 | 7 |
| 3 | GO:0031406 | Carboxylic acid binding | 1 | 3 | 14 | |
| 3 | GO:0036094 | Small molecule binding | 32 | 377 | 557 | 67 |
| 3 | GO:0042277 | Peptide binding | 1 | 1 | 4 | |
| 3 | GO:0042562 | Hormone binding | 1 | |||
| 3 | GO:0043021 | Ribonucleoprotein complex binding | 1 | |||
| 3 | GO:0043167 | Ion binding | 21 | 143 | 541 | |
| 3 | GO:0046906 | Tetrapyrrole binding | 1 | 8 | 112 | |
| 3 | GO:0048037 | Cofactor binding | 4 | 38 | 136 | |
| 3 | GO:0051540 | Metal cluster binding | 6 | 48 | ||
| 2 | GO:0003824 | Catalytic activity | 65 | 949 | 1519 | 125 |
| 3 | GO:0004133 | Glycogen debranching enzyme activity | 3 | |||
| 3 | GO:0008641 | Small protein activating enzyme activity | 1 | |||
| 3 | GO:0008907 | Integrase activity | 1 | |||
| 3 | GO:0016491 | Oxidoreductase activity | 10 | 79 | 418 | |
| 3 | GO:0016740 | Transferase activity | 31 | 404 | 511 | 57 |
| 3 | GO:0016787 | Hydrolase activity | 19 | 271 | 450 | 28 |
| 3 | GO:0016829 | Lyase activity | 5 | 18 | 99 | |
| 3 | GO:0016853 | Isomerase activity | 2 | 12 | 83 | |
| 3 | GO:0016874 | Ligase activity | 2 | 24 | 62 | |
| 3 | GO:0070283 | Radical SAM enzyme activity | 3 | |||
| 2 | GO:0009055 | Electron carrier activity | 7 | 179 | ||
| 3 | GO:0045156 | Electron transporter, transferring electrons within the cyclic electron transport pathway of photosynthesis activity | 6 | 2 | ||
| 3 | GO:0045157 | Electron transporter, transferring electrons within the noncyclic electron transport pathway of photosynthesis activity | 3 | 1 | ||
| 3 | GO:0045158 | Electron transporter, transferring electrons within cytochrome b6/f complex of photosystem II activity | 3 | |||
| 2 | GO:0030234 | Enzyme regulator activity | 1 | 30 | 17 | |
| 3 | GO:0004857 | Enzyme inhibitor activity | 8 | 6 | ||
| 3 | GO:0008047 | Enzyme activator activity | 5 | 4 | ||
| 3 | GO:0019207 | Kinase regulator activity | 1 | |||
| 3 | GO:0060589 | Nucleoside-triphosphatase regulator activity | 1 | 5 | 3 | |
| 3 | GO:0061134 | Peptidase regulator activity | 7 | 3 | ||
| 3 | GO:0004871 | Signal transducer activity | 1 | 27 | 27 | |
| 2 | GO:0001071 | Nucleic acid binding transcription factor activity | 4 | 52 | 37 | |
| 3 | GO:0003700 | Sequence-specific DNA binding transcription factor activity | 4 | 52 | 37 | 4 |
| 2 | GO:0004872 | Receptor activity | 4 | 32 | 32 | 12 |
| 3 | GO:0038023 | Signaling receptor activity | 1 | 1 | 8 | |
| 2 | GO:0005198 | Structural molecule activity | 5 | 248 | 2 | |
| 3 | GO:0003735 | Structural constituent of ribosome | 2 | 223 | ||
| 3 | GO:0005199 | Structural constituent of cell wall | 1 | |||
| 3 | GO:0005200 | Structural constituent of cytoskeleton | 5 | |||
| 2 | GO:0005215 | Transporter activity | 3 | 93 | 229 | |
| 3 | GO:0022857 | Transmembrane transporter activity | 3 | 31 | 173 | |
| 3 | GO:0022892 | Substrate-specific transporter activity | 3 | 23 | 153 | |
| 3 | GO:0042910 | Xenobiotic transporter activity | 3 | 3 | ||
| 3 | GO:0051184 | Cofactor transporter activity | 6 |
Annotated unigene-mapped and de novo-mapped transcripts under subgroups of “electron carrier activity” and “response to abiotic stimulus” that were upregulated after 12 h of salt stress exposure with fold change (FC) of ≥4 (Table S2) fit within the expression pattern cluster 2. These subgroups were selected because they included the most important highly upregulated transcripts related to salt stress. There were thousands of GO hits whose expression was altered ≥4 fold under salt stress (Table S2). The number of GO hits under the selected “electron carrier activity” subgroup was 44, 13 of which were unigene-mapped and 31 were de novo-mapped. These GO hits represented nine genes/gene families, one unigene-mapped and eight de novo-mapped. The number of GO hits under “response to abiotic stimulus” subgroup was 866, 432 unigene-mapped, 99 de novo-mapped and 335 unigene/de novo-mapped. These GO hits represented 88 genes/gene families, 55 unigene-mapped, 15 de novo-mapped and 18 unigene/de novo-mapped.
4 Discussion
Organisms that survive in saline water possess mechanisms to maintain their osmotic balance [26]. It is evident that the number and percentage of transcripts generated from the RNA-Seq data of different replicates grown under salt stress at 2 or 12 h time points are slightly higher than at 0 or 24 h time points (Table 1). This increase may be due to the high level of salt-related gene expression at time points 2 and 12 h, followed by recovery of gene expression after 24 h exposure to salt stress to similar levels as the control plants. The number of DE transcripts (5416) from the alignment with the de novo-assembled wild barley reference genome indicates that many of these transcripts likely represent more than one contig of single genes (Fig. 1c). This conclusion is supported by the fact that the number of annotated DE transcripts mapped on the H. vulgare unigene reference genome is over 3000 out of 3861 (Fig. 1b), whereas transcripts mapped to the de novo-assembled wild barley reference genome number less than 2000 out of 5416 (Fig. 1c).
4.1 Salt stress tolerance via electron transport and exchanger mechanisms
Many cytochrome p450 proteins detected in salt-stressed wild barley are likely involved in electron transfer chains as a mechanism of salt tolerance regulation. p450 usually acts as a terminal oxidase in electron-transfer chains under salt stress with a number of fundamental redox domains, e.g., FAD-containing flavoproteins, ferredoxins [27]. Besides cytochrome p450, we detected a number of salt-regulated transcripts encoding electron transfer flavoproteins and ferredoxins. Flavoproteins function in detoxifying salts in the plant cell [28,29], while ferridoxins were recently reported for their role in abiotic stress signaling [29]. Other detected transcripts encoding vacuolar cation as well as cation proton exchanger in wild barley may act as key factors in the sequestration of sodium (Na+) into vacuoles to avert ion toxicity in the cytosol of plants under salinity stress. Upon influx of N+ into the cell, different ATPases (PM-ATPases, V-ATPases, and V/H-ATPases) are activated [30]. This results in Na+ efflux into the outer rhizosphere by PM Na+/H+ antiporters and/or influx into vacuoles by tonoplast Na+/H+ leading to cellular ion homeostasis, consequently salt tolerance [31]. The cytoplasmic domain of the vacuolar H+-ATPase (V-ATPase), whose transcripts were also salt-regulated in wild barley, were reported to present in a SOS (salt overly sensitive)-containing protein complex [32] with a key role in regulating ion transport under salt stress. Regulation of V-ATPase activity represents an additional key function of SOS2 in the coordination of ion transport changes during salt stress, thus promoting salt tolerance [32]. Upregulation of transcripts encoding plasma membrane (PM)-ATPase in wild barley complements those of other ATPases, as it supported the occurrence of an electrochemical gradient generated under salt stress in the intertidal C4 grass Spartina patens [33]. Although wild barley plants in the present study were stressed by NaCl, an additional transcript encoding calcium-transporting ATPase was upregulated. This enzyme transport protein in the plasma membrane serves to remove calcium (Ca2+) from the cell [34].
4.2 Salt stress tolerance via flavonoid biosynthesis
Flavonoid biosynthesis seems to be one of the biological processes regulating salt tolerance in wild barley. One upregulated transcript, major latex protein gene (MLP) (Table S2), was previously studied in cotton (Gossypium hirsutum) and expression in roots was induced by salt stress [35]. The Gh-MLP promoter contains potential cis-acting elements for response to salt stress and fungal elicitors. Results of RT-PCR showed that expression of Gh-MLP in Arabidopsis is rapidly induced by NaCl, and induction was maintained over 72 h [35]. In our case, expression of this gene dropped back to the control level after 24 h of salt stress exposure. Gh-MLP-transgenic A. thaliana plants showed enhanced salt stress tolerance and transgenic plants allowed seeds to germinate normally after treatment with 75 mM NaCl. Total flavonoid was also enhanced in transgenic Arabidopsis as compared to the control, suggesting that Gh-MLP might also be involved in altering flavonoid content under salt stress [35]. Two wild barley transcripts coding for chalcone synthase (CHS) and two others coding for chalcone isomerase (CHI) were reported to interact under salt stress [36]. CHS, which belongs to a family of polyketide synthase enzymes (PKS), is ubiquitous in higher plants and serves as the initial step for flavonoid biosynthesis [36]. CHI was recently reported to enhance salt tolerance in salt-sensitive yeasts [37]. In the salt-tolerant Millettia pinnata, the level of transcripts involved in flavonoid biosynthesis showed the most remarkable change under salt stress [37]. A transcript for isoflavone reductase-like enzyme was also upregulated in the present study. The enzyme is a key in the isoflavonoid phytoalexin biosynthesis pathway [38] and over expression in transgenic rice (Oryza sativa) reportedly conferred resistance to reactive oxygen species (ROS) stress [39]. Two additional wild barley transcripts encoding transcription factors of the basic helix-loop-helix (bHLH) superfamily are involved in a wide range of growth and developmental signaling pathways, including abscisic acid signaling [40], flavonoid biosynthesis [41] and abiotic stress [42].
4.3 Salt stress tolerance via reactive oxygen species scavenging
It is well-known that cytosolic superoxide dismutase enzymes, either cytSODs (Cu,ZnSOD) or mitSODs (MnSOD), act as antioxidants and protect cellular components during salt stress from being oxidized by reactive oxygen species (ROS) [43–45]. Our results suggest that this mechanism may also be playing a role in salt stress tolerance of wild barley as three transcripts for superoxide dismutase (SOD) activity were highly expressed, while two were less expressed (FC ≤ 4) under salt stress. Other wild barley transcripts encoding electron transporter iron ion binding proteins function in iron-sulfur cluster binding. In several studies, iron ion binding proteins function in detoxification of ROS under salt stress [46–48].
A highly expressed dehydrin (DHN) transcript (FC = 8.44) was also detected. DHNs, or group 2 late embryogenesis abundant (LEA) proteins, have several roles in protecting the plant cell from dehydration stress. One of them exhibits ROS scavenging [49] mediated by the interactions between their amino acid residue and ROS species (e.g., superoxide anion radical O2−; singlet oxygen 1O2; hydroxyl radical HO−; Hydrogen peroxide H2O2). DHNs also function as antioxidants [50], ion sequestrants [51], and metal ion transporters in plant phloem sap [52]. Under reduced hydration, the K-segments of DHNs adopt α-helical conformation [53]. The amphipathic α-helices can interact with partly dehydrated surfaces of various other proteins protecting them from further loss of the water envelope. DHNs also act as “space-fillers” in which they participate in keeping the original, non-harmful distances among different intracellular complexes that helps maintain the original cell volume, thus preventing cellular collapse [49].
4.4 Salt stress tolerance via ethylene production
Ethylene production is suggested to be a mediator of the stress responses in wild barley. A detected transcript, encoding the ethylene-forming enzyme (e.g., 1-aminocyclopropane-1-carboxylate [ACC] oxidase or ACO), was shown earlier to be indirectly induced under salt stress [54] as it relies on the expression of another set of genes, ethylene receptor genes (such as NTHK1 in tobacco, see Cao et al. [55]). Recent studies have demonstrated that salt tolerance was induced by exogenous 1-aminocyclopropane-1-carboxylate in Arabidopsis [56,57]. More recently, Li et al. [58] indicated that ethylene production and activities of ACO in cucumber (Cucumis sativus) seedlings were increased significantly under salt stress (75 mM). Another detected transcript encoding ethylene-responsive element binding factor (ERF) was considered crucial in earlier studies of cotton under stress [59]. Over expression of sugarcane and soybean ERFs in tobacco conferred tolerance to dehydration [60] and high salinity [61] (200 mM NaCl) stresses.
4.5 Salt stress tolerance via a signaling network
Transcripts encoding two serine threonine-protein kinases (STKs), SpkG and SkpC, were salt-regulated in wild barley. These STKs were previously reported to regulate various cellular functions including stress responses [62,63]. Nonetheless, Liang et al. [64] indicated that growth characteristics of a spkC mutant of the unicellular cyanobacterium Synechocystis were not affected under high salt stress conditions, while, growth of a spkG mutant was completely impaired. The spkG gene plays an essential role in sensing high salt signal directly, rather than mediating signals among other kinases [64,65]. Two transcripts encoding mitogen-activated protein kinases (MAPK) and MAP2K seem to complement the effect of SpkG in wild barley as the MAKP superfamily is part of the serine/threonine kinases. This superfamily is a key player in some of the most essential roles in plant signaling networks, and is tolerant to a variety of stresses including drought and salinity [66].
4.6 Salt stress tolerance via a protein refolding mechanism
Salt stress, like other stresses, results in aggregation of cytoplasmic proteins. The present study is the first to indicate the possible role of a transcript encoding ATP-dependent Clp protease adaptor protein (ClpS) in plants with FC of 9.4. This de novo-mapped transcript was previously recovered in rice (NCBI database, http://www.uniprot.org/uniprot/Q0JNQ7) but information on its response to salt stress was not reported. Expression of ClpS in a metagenomic clone recovered [26] was shown to be involved in increased recognition of aggregated protein for refolding or degradation by the ClpA protease (ClpAP) complex resulting in salt stress tolerance. The Clp family has been shown to act as a molecular chaperone in bacteria [12]. These proteins can reverse protein aggregation resulting from salt stress and also play a role in ATP-dependent degradation of polypeptide chains under salt stress [67].
We can conclude that mRNA-Seq is an efficient high-throughput method for analyzing the wide diversity of genes expressed under salt stress. This technology is a very valuable tool to enhance our understanding of the genetics underlying salt stress tolerance mechanisms in plants. In the present study, a valuable dataset of thousands of DE transcripts was detected, some of which are involved in novel biological processes regulating salt tolerance. Some of the most likely candidates involved in salt stress in wild barley are genes involved in electron transport and exchanger mechanisms, flavonoid biosynthesis, superoxide dismutase (SOD) activity, ethylene production, signaling network, and protein refolding. The results of these comparisons can be utilized to improve salt stress tolerance in cultivated barley as well as other important cereal crops.
Acknowledgements
This project was funded by the Deanship of Scientific Research (DSR), King Abdulaziz University, Jeddah, under Grant no. (14-3-1432/HiCi). The authors, therefore, acknowledge with thanks DSR technical and financial support.