

1 Introduction
Among the classes of mollusks, bivalve species play an important role in marine ecosystems. As filter feeders, they form a significant link between primary producers and act as calcium and carbon accumulators, used for shell construction. Mactra corallina (4.5 to 5.5 cm) and Eastonia rugosa (5.1 to 16.5 cm) are two species belonging to the Mactridae family. They are characterized by an equivalve and inequilateral shell; each valve has two cardinal and lateral teeth, internal ligament, and pallial sinus [1]. They are benthic and sympatric clams living in the infralittoral area of the beach, at depths from 1 m to 100 m. Their geographical distribution extends in the Mediterranean Sea and the Atlantic Ocean [2].
Some species of Mactridae (Macro chinensis and Macra veneriformis) are an important commercial seafood [3–5]; however, M. corallina and E. rugosa are not yet included in the Mediterranean market. The reproductive cycle, biochemical composition and ecology of M. veneriformis [6–8], M. chinensis [9], and Coelomactra antiquata [10] have been investigated. Genetic structure and differentiation were examined for different species of the Mactridae family [11], more specifically in C. antiquate from the Pacific Sea [12] and in two sibling species of the genus Mactra (M. corallina and M. lignaria) [13] from the Adriatic Sea as well as for three Tunisian populations of M. corallina using allozymic and morphological markers [14]. Moreover, scientific studies of E. rugosa species (Helbling, 1799) are rare. Therefore, no genetic marker has been tested on these species.
The identification of Mactridae species is difficult by morphological markers due to the existence of phenotypic plasticity and morphological convergence. Nevertheless, Habe (1977) [15] proposed a classification system for the Mactridae family, but no phylogenetic relationship is still available. Despite this classification, some Mactra species showed confusion. For this reason, the genetic markers might help solve effectively the confusion and distinguish some closely allied Mactridae species.
Since 1990, molecular markers have been used to detect polymorphisms among and within species [16]. They are useful because DNA was more thermostable than isoenzymes and because of the higher probability of variation being neutral. So, DNA was considered as a set of genetic markers involved in 80% of phylogenetic studies [17]. Currently, a fragment of the mitochondrial gene cytochrome c oxidase I (COI) was designed as the molecular barcode “DNA Barcoding” and it was suggested to use it as a universal marker for the identification of the animal's species [18]. Some authors used this reliable method to explain the interspecific relationships between marine bivalves and phylogeographic relationships among Atlantic, Pacific, and Mediterranean species [19–22], so it will be used to identify species and to analyze the structure and phylogeny of populations.
A work carried out on M. corallina [13] resolved the confused and contradictory systematics of the putative species of M. corallina collected from the North Adriatic Sea by analyzing molecular markers (12S, 16S, 18S and COI genes, partial sequences and morphological features). Nevertheless, no studies had been reported about the genetic structure along the South Mediterranean coast.
The aim of the present study is to analyze the genetic variation of two Tunisian Mactridae species, M. corallina and E. rugosa, using the partial sequences of mitochondrial cytochrome c oxidase (COI) to evaluate the potential of DNA barcoding to identify the species of Mactridae and to investigate the phylogenetic relationships with some Mactridae species.
2 Materials and methods
2.1 Specimen sampling
The studied species M. corallina and E. rugosa were represented by 18 and 19 individuals, respectively. The samples were collected in sandy beaches of Kalaât El Andalous (KA) in the month of Medjerda wadi in the Gulf of Tunis, in northern Tunisia, at latitude 33°41′20′′N and longitude 10°22′40′′E (Fig. 1).
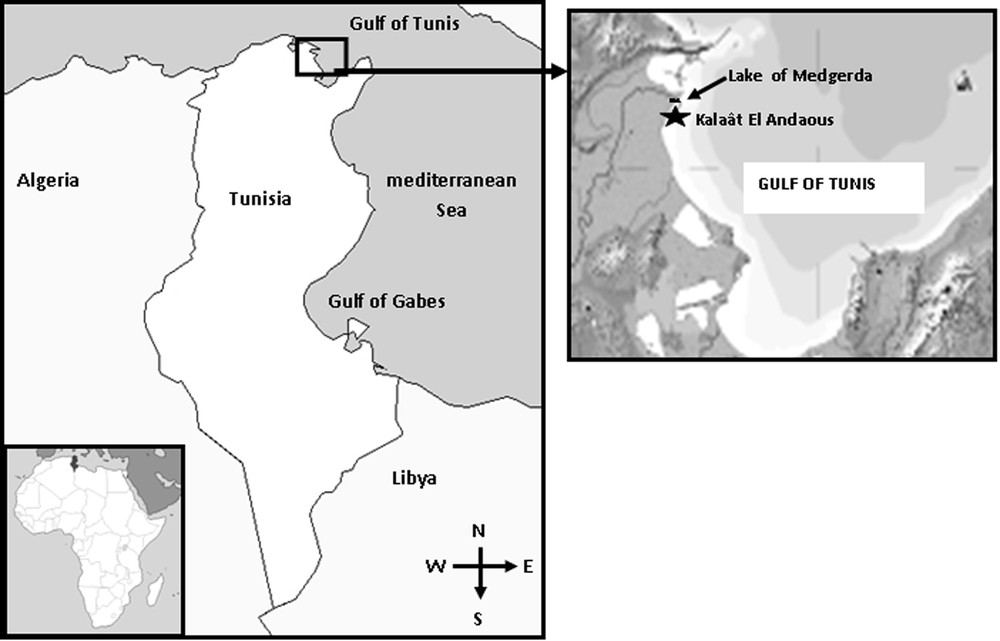
Map of Tunisia: location of the sampling site.
From each sample, a fragment of adductor muscles was taken and preserved at room temperature in absolute ethanol before DNA extraction.
2.2 DNA extraction, PCR amplification and sequencing
DNA was extracted using a 2% CTAB solution and standard proteinase K [23]. A 591-pb fragment of the cytochrome c oxidase subunit I (COI) of mtDNA was amplified from genomic DNA (Fig. 2). The amplification primers: FuCOI-a (5’GGT-CAA-CAA-ATC-ATA-AAG-ATA-TTG-G3’) and RuCOI-a (5’TAA-ACT-TCA-GGG-TGA-CCA-AAA-AAT-CA3’) were designed according to the method of Folmer et al. [24].
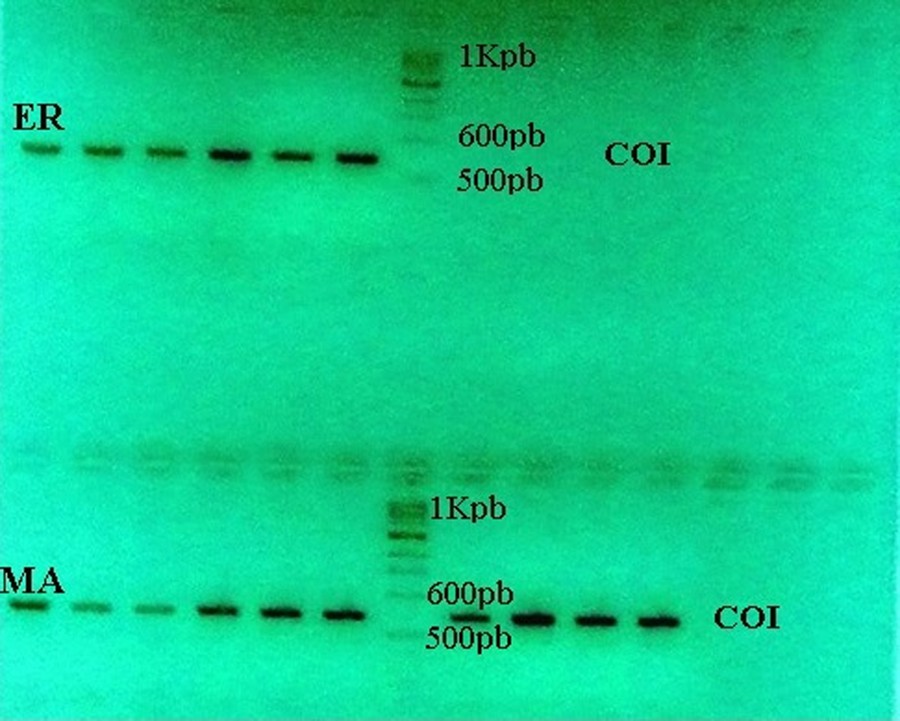
Electrophoresis gel of the COI marker.
PCR amplification reactions were obtained for a total volume of 25 μL containing pure Taq Amersham Ready-To-Go-PCR Kit, 23 μL H2O, 1 μL of each primer (10 pmol) and 1 μL of ADN extract (25 μg/mL). Amplifications were carried out on a Biometra TGRADIENT Thermal Cycler. The program began by a pre-cycling denaturation cycle at 94 °C for 3 min; 40 cycles of denaturing at 94 °C for 1 min, annealing at 40 °C for 30 s, extension at 72 °C for 2 min, and a post-cycling extension at 72 °C for 10 min. The size and quality of PCR products were visualized on a 1% agarose gel with ethidium bromide on a UV transilluminator. Purification of DNA target fragments was carried out using a QIAquick gel extraction Kit (Qiagen) following the manufacturer's instructions. They were sequenced using the Big Dye TM terminator cycle sequencing chemistry following the manufacturer's protocol. The sequences were recorded with an ABI Prism TM 310 automated sequencer.
2.3 Data analysis
All sequences were aligned using the multiple-alignment program CLUSTAL W [25] as implemented in the software BioEdit v. 7.0.5.3. Sequence alignment was adjusted by visual inspection. The nucleotide sequences were deposited in NCBI with accession numbers from KM673272 to KM673288. From the NCBI (Genbank), we make a blast.
The specific genetic diversity was performed using the programs DNAsp 5.10.01 [26] and ARLEQUIN 3.0 [27]. The number of haplotypes, polymorphic sites, transitions, transversions, haplotype diversity (H), nucleotide diversity (π) and mean number of pairwise differences (k) were evaluated. The interpopulation divergence was determined by the FST index. The significance of FST was examined with a bootstrap analysis with 1000 replicates; P-values of pairwise tests were adjusted with the sequential Bonferroni correction. The genetic relationships among haplotypes for the COI gene sequence data were reconstructed using the Neighbor-Joining tree model using MEGA 4 software [28]. Using program DnaSP 5.10 [26], the null hypothesis of neutral evolution of the COI gene was tested using Fu and Li's D* and F* statistics, [29] and Tajima's D test [30]; the significant D values could be due to factors such as selection population expansion and bottlenecks [31].
The demographic history was inferred by analyzing the mismatch distribution, and the validity of the expansion model was evaluated using the sum of square deviations (SSD) between the observed mismatch and the expected one [32], Ramos-Onsis and Rozas R2 statistics, [33] and raggedness statistics rg [34] were also computed as implemented in DnaSP 5.10.
3 Results
3.1 Phylogenetic analysis
The Neighbor-Joining (NJ) tree (Fig. 3) showed two major clusters corresponding to the two Tunisian Mactridae species (Fig. 4). M. corallina population showed a high heterogeneity, which is characterized by the presence of 3 branches to more than 90% bootstraps. So, Fig. 2 shows the phylogenetic tree for the Mactridae family from COI gene analysis. According to this figure, we assume that all species were monophyletic, with support from 50 to 100%, and the genus Mactra was closer to the Coelomactra species, with support from 35% to 43%. However, E. rugosa was in a different clade, far from the genus Mactra (56%) and more closer to Spisula solidissima and Rangia curneata (80%). This bootstrap value (80%) is supported by the monophyly of the Eastonia and Spisula genus, which are two sister groups.
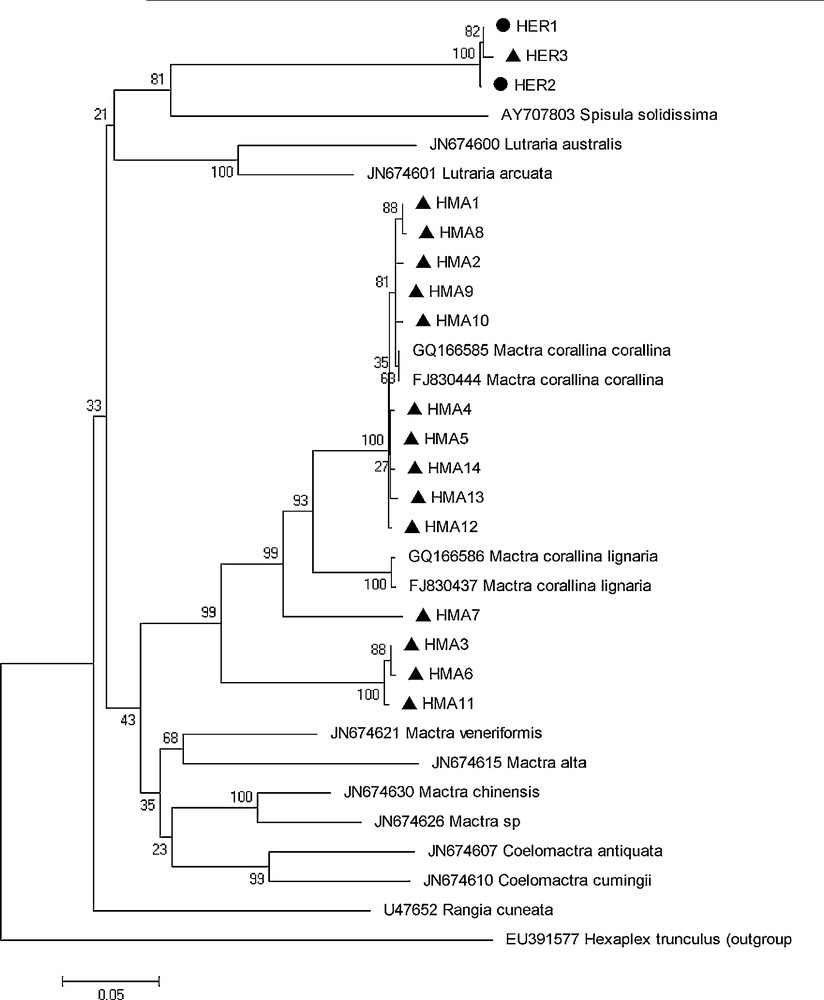
Neighbor-joining tree (model Kimura-2 parameter) presenting the phylogenetic relationships among Mactra corallina, Eastonia rugosa and other species of Mactridae family based on the COI gene. Bootstrap (1000 replicates) HMA: Haplotype of M. corallina, and HER: haplotype of E. rugosa.
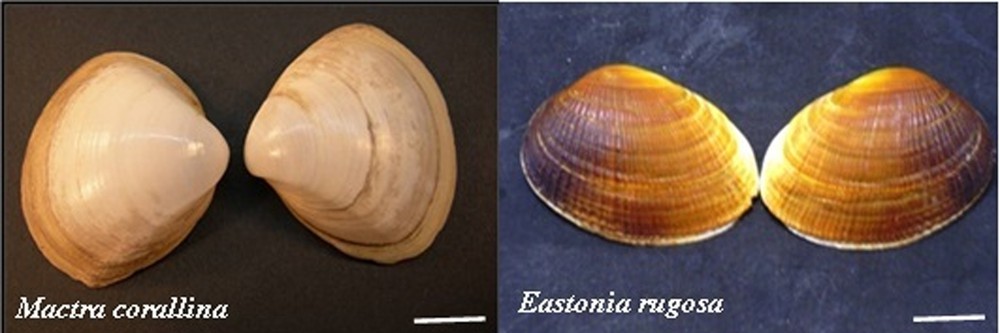
Photo of the two Mactridae species.
3.2 Genetic diversity
For the two species, a COI fragment of length 591 pb was analyzed. E. rugosa presents three haplotypes with a high frequency of HER1 estimated at 0.894. M. corralina shared 14 haplotypes with frequencies ranging from 0.055 to 0.222 and with the highest frequency for HMA3 (H = 0.222). The nucleotide compositions were characterized by a lower rate of C (13.87% for E. rugosa and 16.29% for M. corallina) and a higher rate of T (37.50% for E. rugosa and 39.15% for M. corallina). So M. corallina was genetically variable as it showed a high number of polymorphic sites (126 substitutions), while E. rugosa was weakly variable, with only three polymorphic sites. Statistical analyzes showed that haplotypic diversity H was equal to 0.205 and 0.954, respectively, for E. rugosa and M. corallina. The nucleotide diversity (π) and the mean number of pairwise differences (k) were higher for M. corallina (π = 0.0818 and k = 48.356) (Table 1).
Molecular diversity indices for COI sequences of Mactra corallina and Eastonia rugosa (Mactra rugosa).
| Species | Mactra corallina | Eastonia rugosa |
| N | 18 | 19 |
| Haplotype number | 14 | 3 |
| Polymorphic sites | 126 | 3 |
| H | 0.954 ± 0.0019** | 0.205 ± 0.014* |
| π | 0.0818 ± 0.0416* | 0.00053 ± 0.00063** |
| k | 48.356 ± 21.987 | 0.316 ± 0.336 |
| Number of sites with transitions | 97 | 2 |
| Number of sites with transversions | 41 | 1 |
| Number of sites with subtitutions | 138 | 3 |
The mismatch frequency spectra for the species studied are shown in Fig. 5. The observed distribution was unimodal for the E. rugosa population, indicating a demographic expansion in the past. This result was supported by the significant negative values in Tajima's D test (D = –1.71, P < 0.05), Fu's Fu test (Fu's Fu = –1.084, P < 0.05) Fu and Li's D* test (Fu D* = –2.34, P < 0.001) and Fu & Li's F* test (Fu's F* = –2.24, P < 0.001). So, the values of the sum of squared differences (SSD = 0.008, P > 0.1), the raggedness index (rg = 0.49, P > 0.1) and the Ramos-Onsins and Rozas test (R2 = 0.162, P > 0.1) were non-significant. The hypothesis of selective neutrality is rejected. So it confirms a recent sudden expansion population scenario. For M. corallina, the observed multimodal mismatch distribution underlined a constant population size. This population showed non-significant values of neutrality tests: Tajima's D test (D = 1.35, P > 0.1), Fu's Fu test (Fu's Fu = 2.25, P > 0.1), and Fu F* test (Fu F* = 0.26, P > 0.1); they suggested a contraction of population size due to the balanced selection. Moreover, the value of the sum of squared differences (SSD) was high (SSD = 0.075, P < 0.1), which rejects the contraction hypothesis and confirms the stability size of the M. corallina population (Table 2).

Pairwise mismatch distributions; observed (dashed line) and expected (solid line) curves for two species of Mactridae. X-axis: number of pairwise differences; Y-axis: frequency of mismatches; Exp: expected and Obs: observed.
Neutrality test, mismatch distribution fitting to a sudden expansion model and estimates of the expansion statistic R2 for Mactra corallina and Eastonia rugosa (Mactra rugosa). P-values were obtained by coalescent simulations with 100 replicates.
| Species | N | Test D (Tajima) | Test D* (Fu and Li) | Test F* (Fu and Li) | Fu's Fs | R 2 | rg | Mismatch | SSD |
| Mactra corallina | 18 | 1.353NS | –0.236 | 0.269 | 0.250NS | 0.184 | 0.04 | 48.366 | 0.075* |
| Eastonia rugosa | 19 | –1.719* | –2.345** | –2.498** | –1.084* | 0.162 | 0.49 | 0.316 | 0.008NS |
4 Discussion
The development of molecular techniques and tools could to reduce the problems of confusion of similar morphological sibling species and to identify them.. A new approach based on COI sequences could overcome these difficulties. It has been efficient in many animal species (e.g. birds [35], fishes [36], crustaceans, [37] and mollusks [38]. Also, the COI marker is considered a good genetic marker because of its power for identifying specimens [39], for evaluating biodiversity [40], for discriminating the species genetically close [41], and for defining the cryptic species [42]. But this marker presents two criteria for species delimitations: (1) the unequal ratio of intraspecific variations and interspecific divergence, and (2) the reciprocal monophyly of species [35,43]. So, in our study, we were interested first to analyze the phylogenetic relationship between haplotypes for two clam species (M. corallina and E. rugosa). Some different sequences of other species of the Mactridae family from GenBank were used for comparative purposes (Table 3). According to the N-J tree, we observed as well that the sequences of M. Corallina from our study and sequences of M. corallina coralllina and M. Corallina lignaria from gene bank formed a single clade with a high bootstrap support (63% to 99%). We assumed that all species of the Mactridae family were monophyletic (having a common ancestor) and M. corallina species was considered a paraphyletic group. On the other hand, we considered that the genus Coelomactra was closer to Mactra (43%) than to other genus of Rangia (33%), Spisula, and Eastonia (21%). So our results showed D = 0.24 between M. corallina and Mactra species and D = 0.27 between M. corallina and Coelomactra species). This value of D fell between the limits established for these species by [11]. Only the genus (Mactra) was reciprocally monophyletic with 99% bootstrap support. Several authors have confirmed these hypotheses after studying the phylogeny of Mactridae species based on genetic markers (16S and COI) [11] and on two other molecular markers, 12S and18S [14].
Species and GenBank accession numbers.
| Species | GenBank accession numbers |
| Mactra veneriformis | JN674621 |
| Mactra corallina corallina | GQ166585 and FJ830444 |
| Mactra corallina lignaria | GQ166586 and FJ830437 |
| Mactra alta | JN674615 |
| Mactra chinensis | JN674630 |
| Coelomactra cumingui | JN674610 |
| Lutraria australis | JN674600 |
| Lutraria arcuata | JN674601 |
| Spisula solodissima | AY707811 |
| Rangia cuneata | U47652 |
| Hexaplex trunculus ( outgroups) | EU391577 |
E. rugosa was a paraphyletic species (with a separate group); it was closer to the genus Spisula and Rangia and showed low genetic distances (D) equal to 0.33 and 0.32, respectively.
The subdivision of the M. corallina population (MA) into two distinct clades (NJ) shows the high genetic divergence within this population. This large genetic divergence can be caused by the freshwater of Medjerda wadi. So, this genetic differentiation has been demonstrated by allozymic markers in M. Corallina in the same locality, whose difference in salinity could probably explain the presence of genetic differences (allelic frequencies difference and absence of some alleles) between populations. As well Kong et al. (2007) [44] suggest that the freshwater outflow of the Yangtze River and upwellings of the Zhejiang province are probably the causes of the high genetic divergence in the C. antiquata populations.
In a second part, we analyzed the genetic variation of M. corallina and E. rugosa using the cytochrome c oxidase subunit I (COI) region of mtDNA. The results demonstrate that DNA sequence polymorphism in the COI was effective in the characterization of interspecific structures.
The value of haplotype diversity (H) of mtDNA of M. corallina (0.954) appears to be relatively higher than those reported in other bivalve species [21,22,45,46] and show a great similarity with those recorded in Spissula solidissima [47], while this value for E. rugosa was lower than for the species previously cited. There are several possible explanations for such reduced genetic diversity of E. rugosa: it could result from population life history traits (after demographic crashes or selective events) or be related to the current population's size. But the high haplotype and nucleotide diversity of M. corallina are related to the stability of the population. So, haplotype and nucleotide diversity depend essentially on the pelagic larval phase and on their dispersal ability. Both biological phenomena have an impact on population size [48].
Moreover, as COI is considered more polymorphic than other mitochondrial genes [49], it was frequently used to study the population genetic structure of marine species [17,50] and could be very useful for phylogenetic reconstructions [22] for close species. Therefore, this marker showed a variable number of polymorphic sites for the two species of Mactridae. It demonstrated a range of nucleotide substitution rates that can be used for different evolutionary analyses. So we can say that the M. corallina population was more heterogeneous. However, the E. rugosa population seems to be homogenous, with a low number of polymorphic sites equal to 3.
For the E. rugosa population, Tajima's D neutrality tests and Fu's Fu test revealed significant negative values. A unimodal model mismatch distribution and high haplotype diversity (0.205) were observed. We can conclude to a sudden demographic expansion model of Rogers and Harpending [34]. These negatives values of neutrality tests will be more effective to reject the null hypothesis of constant size and sustain a recent population expansion scenario due to recent selective sweeps. The low and non-significant values of the sum of squared differences (SSD) confirm this hypothesis and reject the bottleneck event. However, we noted that the expansion model of the E. rugosa population was represented by Tajima's D and Fu's Fu tests, but not by the R2 test, due to small sample size [51–53]. According to previous studies, the same signal in favor of a sudden and recent population expansion was found in bivalves, such as Pinna nobilis from the Mediterranean Sea [22], Cerastoderma glaucum in shallow waters [45], S. solidissima from the Atlantic coast [47], Ruditapes philippinarum in the Pacific coast [20], which was related to the recent colonization of the present area and the historical episodes corresponding to the major warm interstadial period during the last glacial cycle [54].
For the M. corallina population, we tested two hypotheses in order to determine the demographic history of this population. Firstly, non-significant and positives values of neutrality tests (Tajima's D and Fu's Fu tests) have suggested a contraction of the population size due to the balanced selection (multiple haplotypes with low and high frequencies). Secondly, the high and significant value of the sum of squared differences (SSD) and nucleotide diversity (π) confirmed the stability size of the M. corallina population. So, we can deduce that this stability of M. corallina population was significantly related to the power of the sum of squared differences (SSD) test. The same example was observed in cephalopods (Octopus vulgaris) from the Mediterranean Sea [55]. They demonstrated the demographic stability of these populations, determined by non-significant values of Fu's [33] FS and Ramos-Onsins and Rozas’ R2 [34] tests, knowing that they observed multimodal mismatch distributions for all populations.
5 Conclusion
The mitochondrial COI has demonstrated its power firstly for identifying Mactridae species (M. corallina and E. rugosa) in this study, secondly for explaining the genetic diversity and demographic history for both studied species.
Nevertheless, it is necessary to improve the genetic study of these two species, first by referring to other populations (samples) collected all along the Mediterranean coast, and then by using a vast other genetic markers such as (microsatellites).
Disclosure of interest
The authors declare that they have no competing interest.
Acknowledgements
Special thanks are extended to different members of the “Station de biologie marine” of Concarneau.