

1 Introduction
Habitat selection is especially important for specialized groups of birds. Herons Ardeidae, colonially breeding waterbirds, explore particular types of habitats. They select habitats on the basis of structural characteristics and quality of foraging grounds, i.e. availability of food (e.g., [1,2]). The location of a colony is affected by a multitude of factors, including vegetation structure, quantity and quality of feeding habitats, interspecies associations and human disturbance, etc. [2–6]. Colonies of such birds attract the researchers’ attention worldwide due to their influence on fish communities [7] and vegetation [8–10]. They also provide data to large-scale studies on a habitat selection of colonial birds [11,12].
Breeding sites must meet the fundamental requirements for successful nesting, such as availability of sufficient foraging habitats [13–15]. Here, we study factors affecting the location of colonies of the grey heron Ardea cinerea. Herons are highly mobile predators that show high plasticity in habitat use within a landscape, exploiting a range of habitat types from river channels to flooded fields [16,17]. The grey heron is mainly piscivorous, however, as an opportunistic predator, it also preys upon amphibians, reptiles, aquatic insects, and small mammals [18]. Thus, both aquatic and terrestrial habitats may serve as important feeding areas for the species (e.g., [6,16,18,19]). Colonies of grey heron are situated in a variety of habitats and landscapes from wetlands, agricultural land to villages and ornamental parks in city centres [4,18]. The specific local landscape characteristics often influence colony distribution, e.g., in France, the type and spatial organization of hydrographical networks surrounding the colonies affects the distribution of grey heron colonies [19]. Many studies on breeding and/or feeding ecology of colonial birds have been conducted at a single spatial scale (e.g., 1 km around the colony [5], 5 km [20], 15 km [2], 25 km [21]). However, birds often explore various spatial scales (e.g., [22]), sometimes as a consequence of the depletion of food resources in close foraging grounds (“Ashmole halo” [23,24]).
In this study, we analysed habitat features in three zones: 0–1 km from the colony representing close proximity to the colony, 0–10 km representing closer foraging grounds and 0–20 km representing a combination of close and far foraging grounds. Identification of key habitats at all relevant scales is necessary to comprehend a particular pattern of distribution across the landscape [25].
The main aim of this study was to identify landscape factors (hydrographic and habitat features) characterizing areas around grey heron colonies in geographical regions (subprovinces) in Poland differing in landscape characteristics (Table 1). The second aim was to determine habitat preferences of grey herons in close proximity to the colony site and close and far foraging grounds around colonies. We expected that:
- • colonies of grey herons in different geographical regions characterized by various types of hydrographic and habitat features (Tables 2 and 3) would be located in areas with different habitat composition, i.e. close to lakes in lakelands and close to rivers in regions with smaller area of natural water bodies;
- • considering the spatial pattern of habitat heterogeneity in the studied area (water bodies are mainly situated in N Poland; Table 3, Fig. 1B), there would be some habitats types indicative for foraging areas of birds from colonies in particular regions, e.g., seacoast zone (with presence of seacoast wetlands, river estuaries, salt marshes) for coastal regions, lakeland (with high contribution of waterbodies and forests) for lakeland regions with postglacial landscape, and riparian (with high area of river banks and small area of lakes) for inland regions;
- • hydrographic features would characterize areas around colonies in all subprovinces. Grey herons would prefer these habitats at all considered scales as aquatic habitats represent optimal foraging areas [26] with their close location reducing the range of foraging trips between the colony and foraging sites [2];
- • forests would be preferred at local scales because the majority of colonies are located in forests and woodlots [18]. Moreover, colonies situated in forests are often less conspicuous for predators and less exposed to human disturbance;
- • grey herons would generally avoid urban zones in close proximity to their colonies because of the negative influence of human disturbance on breeding success and colony size (e.g., [27]). However, considering the successful functioning of some colonies in the city centres [4,18], we expected the existence of some colonies in highly urbanized areas.
Codes, names and short characteristics of subprovinces in Poland, according to [28]. Short characteristics contain areas of habitats (% of the whole surface in particular subprovinces). Habitat codes: see Table 2.
| Code | Subprovince (Polish name) | No. of colonies | Short characteristics and comments |
| CPL | Central Polish Lowlands (Niziny Środkowopolskie) |
30 | Mainly denudation plains, separated by river valleys. Low areas of water bodies (0.3%), rivers (0.6%), and inland marshes (0.1%). Relative area of forests 23%. The original subprovince [22] has been enlarged by adding the following neighbouring subprovinces: Sudetes with Sudeten Foreland, Sasko-Łużyce Lowlands and Silesian–Kraków Upland |
| EBL | Eastern Baltic Lakelands (Pojezierze Wschodniobałtyckie) |
33 | Postglacial landscape with the highest number and area of lakes (6%) and forests (35%). Low areas of rivers and inland marshes (0.2% and 0.4%, respectively). The original subprovince has been enlarged by adding the Eastern Baltic Littoral Region |
| LLU | Lublin–Lviv Upland (Wyżyna Lubelsko-Lwowska) |
6 | Uplands, valley rivers with gentle slope. This subprovince is one of the best developed agricultural regions of Poland (76% of area). Low area of water courses (< 1%). Relative area of forests 20% |
| NPCU | Northern Pre-Carpathian Uplands (Podkarpacie Północne) |
3 | Upland, mainly forested areas (74%) with some wide river valleys. The least urbanized subprovince (0.8%). Lack of inland marshes. Water bodies and rivers make up 0.9% and 0.6%, respectively |
| PBU | Podlasie–Byelorussian Upland (Wysoczyzny Podlasko-Białoruskie) |
20 | Uplands with small area of lakes (0.3%), with considerable contribution of inland marshes (2.2%) |
| POL | Polesia (Polesie) |
12 | Flat area with shallow and wide inland marshes (1%) and moraine plains. This subprovince is mainly covered by agricultural areas (69%) and forests (26%). Water bodies and rivers represent 0.7% and 0.4%, respectively |
| SBCA | South Baltic Coastal Area (Pobrzeże Południowobałtyckie) |
18 | Coastal area (e.g., dunes and sands), with few large lakes (area > 20 km2), swamps and upland areas, and estuaries. Water bodies 2.6%, rivers 0.8%, inland marshes 0.8%, and forests 28% |
| SBL | South Baltic Lakelands (Pojezierze Południowobałtyckie) |
85 | Postglacial landscape with high number and area of lakes (2%). Subprovince with the highest area of forests (35%). Rivers 0.4% and inland marshes 0.3% |
Codes for hydrographic and habitat features, and short characteristics [62].
| Code (habitat) | Short characteristics |
| ComCultPat (Complex cultivation patterns) |
Juxtaposition of small parcels of, annual crops, city gardens pastures, fallow lands and/or permanent crops somewhere with scattered houses |
| Forest (Forests) |
Broad-leaved, coniferous and mixed forests combined |
| NoIrriAr (Non-irrigated arable land) |
Cereals, legumes, fodder and root crops and fallow land. Includes flowers, tree (nurseries cultivation), vegetables, city gardens and areas with scattered house |
| Land (Land principally occupied by agriculture) |
Land occupied by agriculture with areas of natural or semi-natural areas |
| Marsh (Inland marshes) |
Low-lying land usually flooded in winter and more or less saturated by water all year round. Covered by specific low ligneous, semi-ligneous or herbaceous vegetation |
| Past (Pastures) |
Dense grass cover, of floral composition, dominated by graminaceae, not under a rotation system. Mainly for grazing, but the folder may be harvested mechanically |
| Riv (Rivers) |
Natural or artificial water courses serving as water drainage channels. Includes natural canal banks and rivers that have been canalized |
| Urban (Urban zones) |
Land covered by structures and the transport network (roads, motorways and railways, including associated installations, e.g., stations), buildings, artificially surfaced areas (e.g., asphalt), infrastructure of port areas, marinas, airports, dump sites, mineral extraction sites and industrial fabric structures |
| WatBod (Water bodies) |
Natural or artificial stretches of water, also with low floating aquatic vegetation, archipelago of lakes inside land areas and fish farms |
Area [km2]/[%] covered by particular habitat types in subprovinces of Poland and inter-subprovinces comparison (G test). For the codes of subprovinces and habitats, see Tables 1 and 2. The percentage values ≥ 40 are in bold.
| Subprovince | Area [km2/%] in particular subprovinces | ||||||||
| Riv | WatBod | ComCultPat | Past | NoIrriAr | Forest | Urban | Land | Marsh | |
| CPL | 509/43.7 | 211/6.4 | 5517/49.0 | 9680/40.9 | 42342/39.6 | 20042/29.2 | 3364/50.9 | 4009/37.1 | 117/12.2 |
| EBL | 41/3.5 | 996/30.5 | 709/6.3 | 1195/5.1 | 6789/6.3 | 6065/8.9 | 215/3.3 | 1118/10.3 | 74/7.7 |
| LLU | 53/4.6 | 15/0.5 | 808/7.2 | 520/2.2 | 5367/5.0 | 1920/2.8 | 293/4.4 | 474/4.4 | 7/0.7 |
| NPCU | 13/1.1 | 20/0.6 | 129/1.2 | 250/1.0 | 113/0.1 | 1633/2.4 | 17/0.3 | 31/0.3 | 0/0 |
| PBU | 51/4.4 | 48/1.5 | 654/5.8 | 2882/12.2 | 6122/5.7 | 4770/7.0 | 263/4.0 | 966/9.0 | 357/37.2 |
| POL | 28/2.4 | 50/1.5 | 574/5.1 | 1252/5.3 | 2364/2.2 | 1842/2.7 | 172/2.6 | 716/6.6 | 69/7.2 |
| SBCA | 126/10.8 | 428/13.1 | 420/3.7 | 2148/9.1 | 7683/7.2 | 4752/7.0 | 664/10.0 | 416/3.8 | 136/14.2 |
| SBL | 344/29.5 | 1498/45.9 | 2442/21.7 | 5720/24.2 | 36,255/33.9 | 27360/40.0 | 1624/24.5 | 3086/28.5 | 199/20.8 |
| Total | 1165/100 | 3266/100 | 11,253/100 | 23647/100 | 10,7035/100 | 68,384/100 | 6612/100 | 10,816/100 | 959/100 |
| G test | 82.7* | 3179.5* | 1513.1* | 2220.6* | 1797.1* | 2616.7* | 873.7* | 1267.5* | 1031.0* |
* P < 0.001
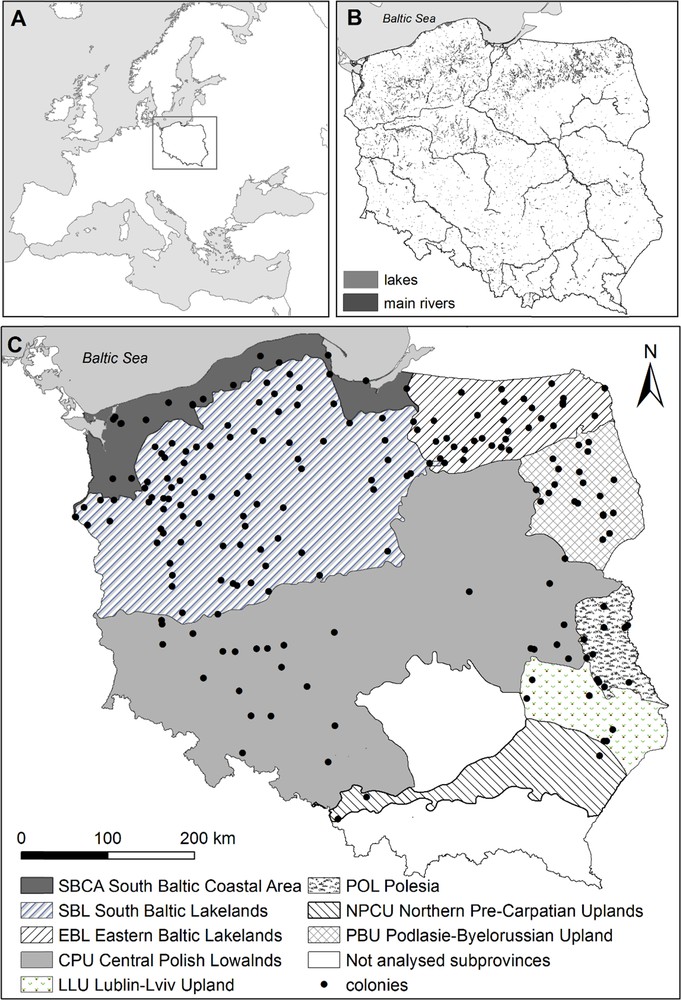
Location of the study area in Europe (A), distribution of water bodies and main rivers in Poland (data from [62]) (B), and distribution of the studied 207 colonies of grey herons in eight subprovinces in Poland (division after [28], modified) (C).
2 Materials and methods
2.1 Study area
Our study was based on 207 known locations (we collected data from literature and observers) of the grey heron colonies in Poland functioning between 1958 and 2015 (Fig. 1). We defined a colony as breeding aggregations containing at least five nests. The studied area consists of eight geographical regions, i.e. subprovinces according to [28], differing in areas covered by particular hydrographic and habitat features: Central Polish Lowland (CPL), Eastern Baltic Lakelands (EBL), Lublin–Lviv Upland (LLU), northern Pre-Carpathians Uplands (NPCU), Podlasie–Byelorussian Upland (PBU), Polesia (POL), South Baltic Coastal Area (SBCA) and South Baltic Lakelands (SBL). We expanded the range of original subprovinces CPL and EBL by adding a few neighbouring subprovinces (see details in Table 1).
Distribution of habitats serving as potential foraging areas for the grey heron in Poland, such as water bodies, rivers and inland marshes [19,29], is uneven (G test, G56 = 16,050.5, P < 0.001) (Table 3). Only one subprovince is coastal (SBCA). Lakes in Poland are concentrated mainly in the northern part with postglacial landscape (SBL – 46% of total water bodies area in all studied subprovinces, EBL – 31% and SBCA – 13%) and only 10% of lakes are located in remaining subprovinces [30] (Table 3). Inland marshes are located mainly in PBU (37% of total inland marshes areas in all subprovinces) and in SBL (21%). Areas of rivers are concentrated mainly in CPL (44%) and SBL (30%). Forests are located mainly in CPL (29%) and SBL (40%).
3 Methods
3.1.1 Data analyses
To identify factors influencing the location of grey heron colonies, we analysed the following landscape features around the colonies (codes, names and characteristics in Table 2):
- • presence/absence of seacoast (coded as 1/0);
- • area of coastal zone (2 m wide) available for foraging herons [31]; we used this feature only in indicator species analyses;
- • area of hydrographic network serving as an important foraging area for grey herons during the breeding season [26]:
- ∘ water bodies (lakes, ponds and fish farms),
- ∘ rivers,
- ∘ inland marshes;
- • area of suboptimal foraging grounds:
- ∘ pastures,
- ∘ non-irrigated arable land,
- ∘ complex cultivation patterns
- ∘ land principally occupied by agriculture with significant areas of natural vegetation;
- • area of forests (all types combined) often serving as nesting sites;
- • area of urbanized zones which may be avoided by herons.
Those data were extracted from CORINE Land Cover model CLC2006 containing information on land cover derived from Landsat 7 satellite images. This land cover model is characterised by moderate resolution (including habitat patches > 25 ha [32]). Thus, some small patches of habitats (e.g., woodlots, groups of buildings, or water bodies/ponds) were not covered by our analyses.
We analysed all of those features in three buffers of different radius around the colony representing the following spatial scales:
- • 0–1 km – close proximity to the colony; studies on herons and egrets colonies distribution in USA suggest that this is the best scale for explaining the distribution of the colony [5]; in some colonies, herons may forage in such close proximity to the colony [33];
- • 0–10 km – close foraging grounds in cost-effective distance from the colony – often exploited by breeding herons; the best scale to indicate relationship between landscape features and productivity in herons [5,12,20,34];
- • 0–20 km – close and distant foraging grounds – grey herons regularly forage at such distance range (e.g., [26,35]), especially if distant foraging areas offer profitable prey species; this buffer size has been used in European studies on habitat use by grey herons [19,21,36].
All the spatial analyses (extraction of particular landscape and hydrological features) were performed using ArcMap software, version 9.3 (ArcGIS, ESRI, Redlands, California, USA).
3.2 Statistical analyses
To compare areas of hydrographic and habitat features among the studied subprovinces, we used the G test. To determine groups of colonies with characteristic groups of habitats in buffer zones around, we used a Hierarchical Cluster Analysis (HACA) using the paired-group method and Bray–Curtis similarity. For each cluster obtained, we calculated bootstrap probability (BP) via multiscale bootstrap resampling [37]. BP of a cluster may have value between 0 and 100, indicating how strong the cluster is supported by data. Only clusters with highest BP values (≥ 80) were interpreted. To determine how well the generated clusters represent dissimilarities between objects, we calculated the cophenetic correlation coefficient with values close to 0, indicating poor clustering, and close to 1, indicating good clustering.
To investigate inter-region dissimilarities in habitat structure around the colonies, we used ANOSIM (Analysis of Similarities based on Bray–Curtis measure of dissimilarity) [38]. To assess the contribution of particular habitats to inter-subprovinces dissimilarity, we used the SIMPER procedure (Similarity Percentage) with the Bray–Curtis dissimilarity matrix [38]. Only contributions > 10% were interpreted. We performed all the mentioned analyses on ln-transformed data.
To identify ‘indicator habitats’ for colonies in particular subprovinces, we used the function ‘multipatt’ in the ‘indicspecies’ package [39], usually used for identifying indicator species.
To investigate habitat selectivity, we used Pearre's selectivity index C [40]. The terms of the equation are defined in Table 4. We calculated the selectivity index C values from the relative area (percentage) of a particular habitat around the colonies (in buffers 0–1 km and 0–10 km; not for 0–20 km due to expanding beyond subprovince range in many cases) in particular subprovinces in relation to the total area of this habitat in the whole subprovince. We calculated this index for all the subprovinces separately. The direction of the selectivity index is deciphered from the sign of the result of the adbe–aebd subtraction. The index ranges from–1 to 1 with positive values indicating selection, negative values indicate avoidance, and a value of zero indicates no selection. We tested the statistical significance of the index with the χ2 statistic with df = 1 [40] at a significance level of 0.05.
Terms used to calculate Pearre's selectivity index: C = ± {(|adbe – bdae| – n/2)2/(adbe)}1/2.
| Area of… | Particular habitat type | All other habitats | All habitats combined |
| Habitat in buffer | a d | b d | ad + bd = d |
| Habitat in region outside the buffer | a e | b e | ae + be = e |
| Habitat in region (total) | ad + ae = a | bd + be = b | ad + ae + bd + be = n |
We performed HACA, ANOSIM and SIMPER procedures using PAST 3.0 software [41] and ‘multipatt’ in the ‘indicspecies’ – package [39] in R software [42]. We conducted all other analyses in STATISTICA 10.0 [43].
4 Results
4.1 Habitat characteristics for all studied colonies
In all colonies, combined HACA recognized some clusters characterized by habitat associations. For all considered buffers, the cophenetic correlation coefficient was relatively high (0.94 for 0–1 km, 0.98 for 0–10 and 0.98 for 0–20 km). At all scales, two main clusters of habitats were distinguished (Fig. 2): one representing coastal colonies or coastal and marsh colonies (only in a 0–10-km buffer), and the second representing inland colonies. Among the second clusters representing inland habitats, inland marshes and rivers clustered together at 0–20 km buffers (BP = 80). Inland marshes also clustered in separate position at a 0–10 km scale. Pastures and forests clustered together at 0–10 and 0–20 km scales (BP = 95 and 99, respectively). At scale 0–10 km, urbanized areas and rivers clustered together (BP = 83). Urbanized areas, complex cultivation patterns and lands principally occupied by agriculture clustered together at 0–20 km scale (BP = 98). Pastures, non-irrigated arable lands and forests clustered together in close proximity to the colony (BP = 99) (Fig. 2).

Hierarchical dendrograms of habitats in buffers 0–1 (A), 0–10 (B) and 0–20 km (C) around colonies of grey heron in all subprovinces combined, obtained using the paired-group method and the Bray–Curtis similarity. Numbers below the branches indicate bootstrap probability values (bootstrap N = 1000); bold values indicate high values (≥ 80). For habitat codes, see Table 2.
For all studied colonies combined, in buffer 0–1 km, SIMPER revealed that the following habitats accounted the most for overall dissimilarity: forests (20%), non-irrigated arable lands (20%), and water bodies (18%). In buffers 0–10 km, the most dissimilar habitats were represented by water bodies (19%), urban zones (12%), forests (12%), and inland marshes (11%). For buffer 0–20 km, habitats were represented by water bodies (23%), inland marshes (15%), and urban zones (11%).
4.2 Habitat characteristics for colonies in subprovinces
In the 0–1-km buffer around the colonies, we found significant dissimilarities in habitat composition among subprovinces (ANOSIM, R = 0.19, P < 0.001): CPL vs. SBL, CPL vs. EBL, CPL vs. PBU, SBCA vs. EBL, SBL vs. EBL, SBL vs. PBU, EBL vs. POL and EBL vs. NPCU (Supplementary material).
SIMPER procedure revealed that pastures, non-irrigated arable lands and forests mainly accounted for overall dissimilarities among studied subprovinces in buffer 0–1 km (11–27%, 15–23% and 16–22%, respectively) (Supplementary material). In six out of seven inter-subprovince comparisons, the area of water bodies account for 15–27% of all dissimilarities (especially in the case of Lakeland EBL subprovince; Supplementary material). Only in one case (EBL vs. POL) did land principally occupied by agriculture account considerably (11%) for inter-subprovince dissimilarity (Supplementary material).
We found significant inter-subprovinces differences in habitat structure in 0–10 km buffers around colonies (ANOSIM, R = 0.33, P < 0.001): CPL vs. SBL, CPL vs. EBL, SBCA vs. EBL, SBL vs. POL, EBL vs. POL, EBL vs. LLU, PBU vs. CPL, PBU vs. SBCA, PBU vs. EBL, PBU vs. LLU and POL vs. LLU. SIMPER procedure showed that the following habitats accounted the most for inter-subprovince dissimilarities: water bodies (11–26%; in 10 of 12 cases), inland marshes (11–20%; in 6 of 12 cases), pastures (11–17%; in 6 of 12 cases), forests (11–16%; in 6 of 12 cases), urban zones (11–16%; in 6 of 12 cases), complex cultivation patterns (11–15%; in 5 of 12 cases) and lands principally occupied by agriculture (12–16%; in 4 of 12 cases) (Supplementary material). Area covered by rivers accounted only for dissimilarity between POL and LLU (in 11%) (Supplementary material).
We found significant inter-subprovince differences in habitat structures in 0–20 km buffers around colonies (ANOSIM R = 0.43, P < 0.001) (Supplementary material): CPL vs. SBCA, CPL vs. SBL, CPL vs. EBL, CPL vs. PBU, SBCA vs. SBL, SBCA vs. EBL, SBCA vs. POL, SBCA vs. LLU, SBCA vs. PBU, SBL vs. POL, SBL vs. LLU, SBL vs. PBU, EBL vs. POL, EBL vs. LLU, EBL vs. PBU and EBL vs. NPCU. SIMPER procedure revealed that the following habitats accounted for the most inter-subprovince dissimilarities in buffer 0–20 km: water bodies (19–36%; in all cases), inland marshes (12–21%; in 14 of 16 cases), urban zones (11–20%; in 7 of 16 cases), lands principally occupied by complex cultivation patterns, agriculture and forests (10–14%, 11–13% and 10–13%, respectively; in 3 of 16 cases) (Supplementary material).
The number of habitats accounting for inter-subprovince dissimilarities increased with the buffer size (5 in 0–1 km buffer, 8 in 0–10 km and 16 in 0–20 km). Area covered by water bodies (in 32 out of 35 cases) and inland marshes (in 20 out of 35 cases) contributed the most to inter-subprovinces dissimilarities at all scales studied.
4.3 Indicator habitats
In buffer 0–1 km, the following habitats around colonies displayed significant indicator values for combinations of subprovinces:
- • pastures for CPL, LLU, NPCU, PBU, POL and SBCA;
- • urbanized zones for CPL, LLU, NPCU and POL;
- • water bodies for CPL, EBL, LLU, NPCU, POL and SBL (Table 5).
Indicator habitats for combinations of subprovinces groups in buffers 0–1, 0–10 and 0–20 km around colonies of grey heron. For the variable codes of subprovinces and habitats, see Tables 1 and 2.
| Habitat | Buffer (km) | Group of subprovinces | Indicator value | P |
| Marsh | 0–10 | EBL + PBU + POL + SBCA | 0.78 | 0.007 |
| 0–20 | EBL + LLU + NPCU + PBU + POL + SBCA + SBL | 0.90 | 0.006 | |
| Past | 0–1 | CPL + LLU + NPCU + PBU + POL + SBCA | 0.88 | 0.001 |
| Sea | 0–10 | SBCA | 0.47 | 0.04 |
| 0–20 | SBCA | 0.75 | 0.002 | |
| Urban | 0–1 | CPL + LLU + NPCU + POL | 0.61 | 0.03 |
| WatBod | 0–1 | CPL + EBL + LLU + NPCU + POL + SBL | 0.77 | 0.001 |
| 0–10 | CPL + EBL + NPCU + POL + SBCA + SBL | 0.99 | 0.001 |
In buffer 0–10 km, we recognized the following indicator habitats:
- • inland marshes for EBL, PBU, POL and SBCA;
- • seacoast for SBCA;
- • water bodies for CPL, EBL, NPCU, POL, SBCA and SBL.
For buffer 0–20 km, the following habitats around colonies displayed significant indicator values:
- • inland marshes for EBL, LLU, NPCU, PBU, POL, SBCA and SBL;
- • seacoast only for SBCA (Table 5).
In summary, water bodies were habitat indicators for 6 subprovinces in buffers 0–1 and 0–10 km, while inland marshes in 4 and 7 subprovinces in 0–10 and 0–20 km buffers, respectively. Pastures were indicative only in buffer 0–1 km, for six regions. Despite that the most of colonies (77%) have no urbanized zone within a radius of 1 km (χ2 test, χ21 = 32.13, P < 0.001), this zone has been recognized as an indicator habitat in buffer 0–1 km, for four regions. Seacoast was indicative only for SBCA in buffers 0–1 and 0–10 km.
4.4 Habitat selectivity
In buffer 0–1 km around the colony, grey herons from all subprovinces, except for SBCA, preferred water bodies (0.09–0.49) (Table 6). Pastures were preferred in all regions (0.10–0.34), except for EBL, inland marshes in three regions (0.11–0.25). Rivers were preferred only in LLU (0.11). Non-irrigated arable lands were selected by herons only in NPCU (0.46), while were avoided in three other subprovinces (–0.14 to –0.25). Forests were avoided in all subprovinces (–0.16 to –0.71) (Table 6). The majority (59%) of the studied colonies were situated outside large forest patches (< 25 ha) (χ2 test, χ21 = 3.72, P = 0.05). Among the colonies situated in large forest patches, the proportion of those situated in broad-leaved, coniferous and mixed forests was similar (G test, G2 = 4.9, P = 0.09). In contrast to the close proximity to the colony, in buffer 0–10 km, forests were preferred in seven subprovinces (0.13–0.40). However, they were avoided in one example (–0.25 in NPCU) (Table 6). Urban zones were selected in five subprovinces (0.12–0.21) and inland marshes only in one (0.25 in LLU). Non-irrigated arable lands were avoided in six subprovinces (–0.19 to –0.51) and pastures in three regions (–0.16 to –0.21) (Table 6). In summary, water bodies and rivers were preferred only in close proximity to colonies (in 7 and 1 subprovinces, respectively). Forests were avoided in all regions in buffer 0–1 km, while this habitat was preferred in seven regions in the 0–10-km buffer. In seven regions, pastures were preferred in close proximity to the colony, although also avoided in close foraging areas in three subprovinces. Non-irrigated arable lands were avoided in three and six regions at 0–1 km and 0–10 km, respectively. Urban zones were preferred in five regions only in buffer 0–10 km.
Pearre's selectivity index for buffers 0–1 km and 0–10 km around colonies of grey heron. Only significant relationships (χ2 test) P < 0.05. For the variable codes of subprovinces and habitats, see Tables 1 and 2. Index values ≥ 0.3 are in bold.
| Subprov. | Riv | WatBod | ComCultPat | Past | NoIrriAr | Forest | Urban | Land | Marsh |
| Buffer 1 km | |||||||||
| CPL | – | 0.35 | – | 0.10 | –0.25 | –0.24 | – | – | 0.11 |
| EBL | – | 0.49 | – | – | –0.14 | –0.39 | – | – | – |
| LLU | 0.11 | 0.14 | – | 0.34 | –0.21 | –0.21 | – | – | 0.25 |
| NPCU | – | 0.26 | – | 0.16 | 0.46 | –0.71 | – | – | – |
| PBU | – | 0.09 | – | 0.34 | – | –0.39 | – | – | – |
| POL | – | 0.25 | – | 0.13 | – | –0.36 | – | – | – |
| SBCA | – | – | – | 0.15 | – | –0.16 | – | – | 0.18 |
| SBL | – | 0.17 | – | 0.10 | – | –0.30 | – | – | – |
| Buffer 10 km | |||||||||
| CPL | – | – | – | – | –0.39 | 0.37 | – | – | – |
| EBL | – | – | – | – | –0.35 | 0.15 | 0.21 | – | – |
| LLU | – | – | – | – | –0.51 | 0.40 | 0.13 | – | 0.25 |
| NPCU | – | – | – | – | – | –0.25 | 0.12 | – | – |
| POL | – | – | – | –0.16 | –0.19 | 0.29 | – | – | – |
| PBU | – | – | – | –0.21 | – | 0.13 | – | – | – |
| SBCA | – | – | – | –0.18 | –0.32 | 0.22 | 0.14 | – | – |
| SBL | – | – | – | – | –0.36 | 0.25 | 0.14 | – | – |
5 Discussion
To our knowledge, this is the first study investigating hydrographic and habitat factors affecting the location of grey heron colonies in Central Europe. Our results are important to comprehend factors determining the distribution of colonies of this species considered as a bioindicator of aquatic ecosystems [44]. They are also important as previous studies on this species [6,19] were performed in other parts of Europe with different landscape, land use, and biodiversity. Knowledge of waterbird habitat preferences is essential to understand their ecological roles, which is crucial for wildlife and fishery management.
Our analyses revealed some groups of colonies characterized by predominant habitat types in surrounding areas. At all spatial scales, cluster with coastal colonies were distinguished. Coastal areas are very important foraging grounds of the grey heron [19,21,45]. Saltwater fish may constitute a considerable component of its diet [18], e.g., the Round Goby Neogobius melanostomus represents up to 95% of the regurgitated prey items in a coastal colony in Mosty, in northern Poland [37]. Moreover, breeding in moderate coastal climate facilitates earlier breeding onset in the spring, when most inland water bodies are still covered with ice [46]. Only herons breeding in the coastal subprovince SBCA did not exhibit significant preference for water bodies. They may have preferred coastal marine habitats instead of inland water bodies as saltwater fish have higher energy and nutritional values [47,48]. Moreover, water bodies in this subprovince are characterized by low their number and large area (> 20 km2) [30,49]. Grey herons are able to exploit only shallow littoral zones of lakes because their anatomical structure restricts foraging mainly to this zone [18,21,26]. Therefore, the area exploited by herons in large and deep lakes is considerably limited.
In all studied subprovinces, excluding SBCA, grey herons preferred water bodies in close proximity to colonies. Additionally, water bodies were indicator habitats for groups of six subprovinces, both in the 0–1 and 0–10 km scales (Table 5). Despite the fact that the majority (90%) of lakes in Poland are located in the North (Fig. 1B), grey herons in all studied regions preferred to locate their colonies in close proximity to water bodies, even in subprovinces with low contribution of this habitat (e.g., < 1% in LLU and NPCU). Hydrographical features, such as water bodies or other wetlands, have been reported as optimal foraging areas for grey herons affecting colony distribution, their size, re-occupation, and breeding success [5,6,21,29]. Other species of herons (e.g., little egrets Egretta garzetta and great blue herons A. herodias) prefer large areas covered by wetlands or linear banks [2,50,51]. In contrast to our expectations, rivers were preferred only in one province, LLU, in close proximity to the colony. This preference likely indicates compensation of small areas of lakes and inland marshes in this region (< 1%). Rivers were not classified as an indicator habitat for any province. In contrast, in eastern France, two grey heron colony locations were attributed to the presence of rivers within a 25-km buffer around the colonies [21,35]. Data on temporal changes in colony size from northern Poland indicate that the number of nests increased in heronries located closer to the rivers/canals [29].
Inland marshes serve as another important foraging habitat for grey herons, determining location, re-occupation and size of their colonies [5,6,29,35]. This habitat in HACA clustered separately in close foraging grounds, or together with seacoast in close colony proximity, or with rivers in distant foraging grounds. Inland marshes were preferred in subprovinces with a low number of lakes (CPL and LLU) and with several large lakes (SBCA) serving there as an equivalent of water bodies. Marshes offer various prey types including fish, amphibians, small mammals, and aquatic invertebrates [52]. Additionally, marshes are usually less accessible to humans, decreasing the risk of disturbance. This habitat was indicative for groups of subprovinces 4 and 7 in 0–10 km and 0–20 km scales, respectively (Table 5).
In our HACA analyses, agriculture areas (non-irrigated arable lands, lands principally occupied by agriculture and pastures) often clustered together. Pastures were preferred in most of the studied regions in close proximity to the colony site. This habitat type was indicative for groups of six subprovinces. Grey herons may forage in such non-aquatic habitats to supplement their basic diet (fish) with invertebrates and mammals [18,53–55] serving as a source of micronutrients [54]. As an opportunistic predator, grey herons may focus locally on prey typical for such habitats (e.g., susliks Citellus sp. and mice were the main components of the diet in Bessarabia [55]). On the other hand, pastures were avoided in three subprovinces within a 0–10-km buffer. On close foraging grounds, herons they may try to avoid competition with others wading birds for which pastures serve as important foraging grounds, e.g., White Stork Ciconia ciconia (L. 1758) [34,56]. Non-irrigated arable lands were avoided on close foraging grounds. These highly cultivated areas were not attractive as foraging areas for herons. In our study, lands principally occupied by agriculture were not preferred by grey herons. However, in Greece, the colony size was related positively with the area covered by arable land [6]. Importance of particular habitats may vary spatially depending on local habitat structure and composition.
In contrast to our expectations, urbanized zone were recognized as an indicator habitat in close proximity to colonies for a group of subprovinces, despite the fact that the most of the colonies have no urbanized zone within a 1-km radius. Moreover, this habitat was preferred in close foraging grounds as 98% of the colonies contained urbanized zones within a 10-km radius. This result was unexpected as human proximity often negatively affects reproductive success and colony size in grey heron [5,6,27]. On the other hand, the grey heron is known for breeding in close proximity to human residences (43% of 69 colonies in northern Poland were located < 500 m from buildings [57]), even in ornamental city parks in city centres (e.g., in Amsterdam, London, Nilrjik, Oléron [4,18]) or zoological gardens (e.g., in Wrocław and Gdańsk in Poland). Nesting in close proximity to human activities might provide suitable foraging opportunities in human-altered portions of the landscape, e.g., at fish farms and even at small garden ponds [58–60]. Human disturbance may then be detrimental or not, depending on the local attitude towards waterbird colonies.
Forests were avoided in all studied subprovinces in close proximity to the colony site, while there were preferred in close foraging grounds. These contradictory results may be explained by the different needs of herons at different spatial scales. The majority of the studied heronries were situated in small woodlots, parks and not in large forest patches. Similar results have been reported for some species of herons in Southern Europe [6,61]. Considering that water bodies were indicator habitats for many subprovinces, their large area in close proximity to colonies limited the area covered by other habitats, such as forests. However, forests were preferred at larger, 0–10-km scales. Large areas of this habitat often limit the area of habitats managed by humans (agriculture, urbanized zones) that may be exposed to habitat destruction (e.g., drainage) and regular disturbance. In contrast to our study, great blue herons in the USA locate their colonies at sites with highly forested areas within a 1-km buffer around heronries [2]. Also, the location of colonies of the purple heron A. purpurea in Greece was positively associated with an area of forests in a 5-km buffer around colonies [6]. For six species of herons and egrets in Japan, forests were an attractive land type and the most important variable in the 4-km scale for breeding site selection [12]. Those differences may have resulted from various areas of waterbodies and forests in close proximity to the colony. Additionally, as our study is based on a land cover model with moderate resolution (including habitat patches > 25 ha), some small patches of forests were not included in our analyses.
In conclusion, inter-subprovince dissimilarities in areas of the most important habitats for grey heron foraging as water bodies, inland marshes or rivers were low (mostly 10–20%). Even in regions with smaller area covered by lakes or inland marshes, birds preferred to locate their colonies at sites with high representation of those habitats. Inter-subprovinces dissimilarities in habitats increased with buffer size. Moreover, breeding site preferences were more uniform compared to those attributed to foraging areas. We are aware of some limitations of our study. Satellite-derived data on land cover data is only a proxy of real factors determining colony location. They likely reside in prey availability, impact of disturbance and predation, social factors and tradition of site occupancy, all of which are almost impossible to assess quantitatively in nature. Nevertheless, our study has filled an evident gap in knowledge about landscape factors affecting the distribution of grey heron colonies in Central Europe. Further studies investigating the influence of landscape and hydrological features on colony size and breeding success are needed. Knowledge of mechanisms of habitat selection including different needs of birds at different scales (e.g., breeding site and foraging ground) is fundamental to the construction of proper conservation and management plans for many avian species [12].
Acknowledgements
We appreciate the improvements in English usage made by English Native Speaker George Day. We would like to thank Andrzej Andrzejczyk, Marek Andrzejewski, Marcin Antczak, Wiesław Bagiński, Andrzej Batycki, Krzysztof Belik, Szymon Beuch, Tomasz Biwo, Marta Borowiec, Szymon Bzoma, Kamil Cetnarowski, Przemysław Chylarecki, Damian Czechowski, Tadeusz Drazny, Artur Goławski, Sylwia Grocholska, Grzegorz Grygoruk, Krzysztof Henel, Andrzej Kąkol, Paweł Kołodziejczyk, Krzysztof Konieczny, Jerzy Kowalski, Wiesław Lenkiewicz, Piotr Lewandowski, Henryk Linert, Piotr Minias, Maciej Nagler, Beata Orłowska, Sławomir Pawlak, Zuzanna Pestka, Eugeniusz Pugacewicz, Alfred Rösler, Mirosław Sapko, Paweł Sieracki, Kamil Struś, Maciej Szajda, Hanna Sztwiertnia, Jakub Szymczak, Piotr Tryjanowski, Tomasz Tumiel, Piotr Wasiak, Józef Witkowski, Zbigniew Wnuk, Krzysztof Wołk, Andrzej Zalisz, Krzysztof Żarkowski, members of Śląskie Towarzystwo Ornitologiczne, for providing data about the location of colonies of grey heron in Śląsk, and to P. Wylegała, A. Batycki for data from Wielkopolska.