

1 Introduction
Canarium album (C. album), or C. album (Lour.) Raeusch, Qingguo in Chinese, is a native cultivar in the Southeast of China, particularly in Sichuan, Guangdong, Guangxi, Hainan, and Fujian provinces. C. album has been introduced to other Asian tropical and semi-tropical regions, including Vietnam, Malaysia, Japan, etc. It is a very good fruit cultivar because of its tolerance to poor soils, including saline or alkaline soils and rocky hillsides. C. album in China is different from the European olive, which is basically for oil. Therefore, we also call it as Chinese olive (O. chinese). The fruit, nut, seed, and root of O. chinese have been used as Chinese medicines for a long time for swollen and sore throat [1], excessive thirst, hematemesis due to cough, lacillary dysentery, epilepsy, puffer poisoning, alcoholism. The dried fruits are also traditional medical materials that have some pharmacological functions, such as antioxidation, anti-virus, anti-bacterium, anti-inflammation and detoxification activities [2,3]. Therefore C. album is extensively cultivated in China, producing an edible drupe fruit that is sold fresh on markets.
However, it is difficult to distinguish the different cultivars for C. album only through their morphology. To understand the genetic variation between the different cultivars, the most effective tool for genetic analysis is DNA fingerprinting or genetic maker technique [4,5]. However, despite some advantages, the polymorphic sites detected by single DNA fingerprinting methods are restricted and genetic relationship among experimental materials cannot be fully elucidated. The number of polymorphic sites could be increased and the coverage of genome could be improved, if the data achieved based on several DNA fingerprinting technologies was integrated and analyzed, thus contributing to abundant genetic information. Random amplification polymorphic DNA (RAPD) and inter-simple sequence repeat (ISSR) are dominant markers for DNA fingerprinting detection in various cultivars, while the combination of RAPD and ISSR can provide a better understanding of genetic variation. In this study, we distinguish the different cultivars of C. album from different regions of China by improved RAPD and ISSR, and study their genetic relationships. Importantly, Terminalia chebula (T. chebula), easily misclassified into C. album, was introduced to explore their genetic relationship as well. Thus, in this study, improved RAPD-PCR and ISSR analyses were performed to analyze polymorphism and genetic relationships for classifying C. album, and differentiating C. album from T. chebula in different areas of China.
2 Materials and methods
2.1 Sample collection and reagents
The geographic distributions of the samples collected in this study were as shown in Fig. 1 and Table 1, including one sample from Luzhou city, Hejiang county in Sichuan province, which was described previously [6]. The fresh leaves and fruits were carefully identified and named according to the fruit size and weight, leaf size and colour (Table 1 and data not shown), and the specimens have been deposited at the source bank of Southwest Medical University. The DNAs of fresh leaf samples for each accession were collected from plants and was extracted with the modified CTAB method [7]. DNA quality was determined after electrophoresis on 1% agarose gels. DNA concentration was measured by spectrophotometry at 260 and 280 nm [8,9]. The final concentration of all DNA samples was adjusted to 10 ng/μL for PCR analysis and stored at –20 °C till use [9].
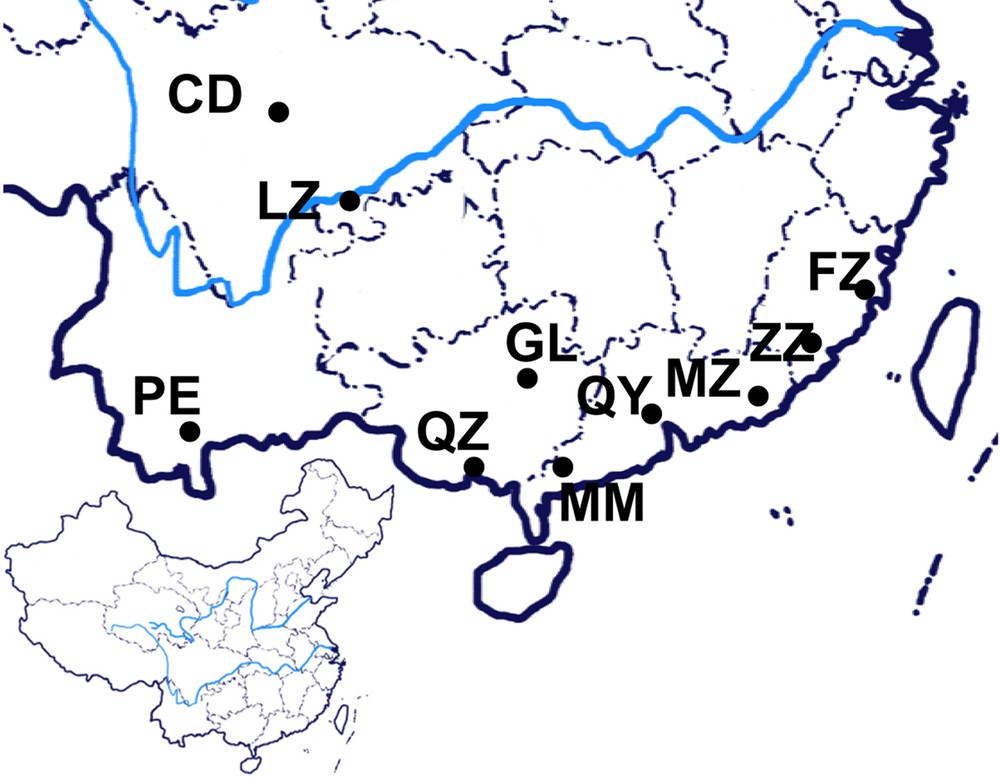
The locality of C. album samples from China. The blue line in the enlarged map indicates the Yangtze River.
Sources of the samples used in this study.
| Sample | Cultivars | Source | No. |
| MZ | Canarium album (Lour.) Raeusch | Meizhou, GuangDong | 001 |
| MM | Canarium album (Lour.) Raeusch | Maoming, Guangdong | 002 |
| QY | Canarium album (Lour.) Raeusch | QingYuan, GuangDong | 003 |
| FZ | Canarium album (Lour.) Raeusch | Fuzhou, Fujian | 004 |
| ZZ | Canarium album (Lour.) Raeusch | ZhangZhou, Fujian | 005 |
| GL | Canarium album (Lour.) Raeusch | Guilin, Guangxi | 006 |
| QZ | Canarium album (Lour.) Raeusch | Qinzhou, GuangXi | 007 |
| LZ | Canarium album (Lour.) Raeusch | Luzhou, Sichuan | 008 |
| CD | Canarium album (Lour.) Raeusch | ChengDu, Sichuan | 009 |
| PE | Fructus Terminaliae chebulae Immaturi | PuEr, Yunnan | 010 |
2 × PCR Taq Master Mix was purchased from Tian Gen Biotech Co. Ltd (Beijing, China). The random RAPD primers were purchased from SBS Genetech Corporation (Beijing, China). DNA Marker (DL2000) was purchased from SinoBio (Beijing, China). Other reagents were analytical grade reagents used previously [10].
2.2 PCR amplification
The PCR amplification system with a total volume of 10 μL, including 1 μL of 2.5 μmol/L primers for RAPD (Table 2) or ISSR (Table 3), 1.5 μL of DNA template (about 15 ng), 5 μL of 2 × PCR TaqMastermix, and 3.5 μL of sterile water. PCR reactions of each accession were executed by means of the Applied Biosystems Veriti® 96-Well Thermal Cycler (Life Technology, NY, USA) [11,12]. All the PCR reactions were repeated at least three times for ten samples.
Information of improved RAPD primers.
| Primer | Sequence 5′–3′ |
| SBS-A1 | CAGGCCCTTC |
| SBS-A9 | GGGTAACGCC |
| SBS-A15 | TTCCGAACCC |
| SBS-A20 | GTTGCGATCC |
| SBS-I10 | ACAACGCGAG |
| SBS-I19 | AATGCGGGAG |
| SBS-M15 | GACCTACCAC |
| SBS-N5 | ACTGAACGCC |
| SBS-Q4 | AGTGCGCTGA |
| SBS-Q7 | CCCCGATGGT |
| SBS-A8 | GTGACGTAGG |
| SBS-A12 | TCGGCGATAG |
| SBS-A19 | CAAACGTCGG |
| SBS-I2 | GGAGGAGAGG |
| SBS-I18 | TGCCCAGCCT |
| SBS-M5 | GGGAACGTGT |
| SBS-N3 | GGTACTCCCC |
| SBS-N10 | ACAACTGGGG |
| SBS-Q5 | CCGCGTCTTG |
| SBS-Q11 | TCTCCGCAAC |
Information of ISSR primers.
| Primer | Sequence 5′–3′ |
| 807 | AGA GAG AGA GAG AGA GT |
| 810 | GAG AGA GAG AGA GAG AT |
| 814 | CTC TCT CTC TCT CTC TA |
| 818 | CAC ACA CAC ACA CAC AG |
| 825 | ACA CAC ACA CAC ACA CT |
| 834 | AGA GAG AGA GAG AGA GYT |
| 840 | GAG AGA GAG AGA GAG AYT |
| 842 | GAG AGA GAG AGA GAG AYG |
| 876 | GAT AGA TAG ACA GAC A |
| 889 | DBD ACA CAC ACA CAC AC |
| 808 | AGA GAG AGA GAG AGA GC |
| 811 | GAG AGA GAG AGA GAG AC |
| 815 | CTC TCT CTC TCT CTC TG |
| 823 | TCT CTC TCT CTC TCT CC |
| 828 | TGT GTG TGT GTG TGT GA |
| 836 | AGA GAG AGA GAG AGA GYA |
| 841 | GAG AGA GAG AGA GAG AYC |
| 855 | ACA CAC ACA CAC ACA CYT |
| 886 | VDV CTC TCT CTC TCT CT |
| 898 | CCC TCC CTC CCT CCC T |
PCR amplification for ramp-PCR was performed as follows: initial denaturation at 95 °C for 90 s, followed by 40 cycles of 94 °C for 40 s, 36 °C for 90 s, 72 °C for 90 s, and final extension of 5 min at 72 °C. The ramp time from annealing to extension was adjusted from 2.5 °C/s (100%) (default time) to 0.125 °C/s (5%) to compare the resolution and production of the two methods by ramp-PCR. The ramp rate from annealing to extension was adjusted to 0.125 °C/s (5% ramp rate). This was carried out in triplicate for all 10 samples [13].
The PCR condition for ISSR was as follows: initial denaturation at 95 °C for 90 s, followed by 35 cycles of 40 s at 94 °C, 30 s at 50 °C, 90 s at 72 °C, and final extension during 5 min at 72 °C. DNA was amplified by a total of 20 ISSR primers (Table 3) with valuable polymorphic bands.
2.3 Agarose electrophoresis
The amplified PCR products by ramp-PCR or ISSR were resolved by electrophoresis on a 1.5% agarose gel in 0.5 × TAE buffer. Gels were visualized by staining with 0.5 μg/mL ethidium bromide (EtBr), and the images were documented using the ChemiDoc XRS system (Bio-Rad, USA). Bands that were unambiguous and reproducible in successive amplifications were selected for scoring [11,12].
2.4 Statistical analysis
All the bands with signals clearly in the gel profiles were recorded as present (1) or absent (0). The similarity matrix (SM) and the similarity index (SI) were calculated using the SM coefficient, and the dendrogram based on UPGMA (unweighted pair group method with arithmetic mean algorithm) was generated using the SAHN module in NTSYS-pc 2.1 packages, which was described previously [13,14].
3 Results
3.1 Improved RAPD technique in analysis of C. album
To establish the condition of improved RAPD in C. album, SBS-A8 and SBS-I19 primers were used and the ramp time was adjusted from annealing to extension with 2.5 °C/s to 0.125 °C/s in 10 samples collected (Fig. 1, Table 1). As seen in Fig. 2, all samples demonstrated similar repeatable fingerprints; each sample amplified less bands in average with the ramp time 2.5 °C/s (Fig. 2, left); the amount of PCR products (mainly large pieces of DNA) and DNA bands was obviously increased when the ramp time was adjusted from 2.5 °C/s to 0.125 °C/s (Fig. 2, right). For example, the sample No. 3 only had 2 bands with regular PCR (Fig. 2A, left), while the number of bands increased to 5 with the improved RAPD technique (Fig. 2A, right), indicating that the production, resolution, and reproducibility of RAPD were significantly improved. Therefore, the improved RAPD technique, prolonging the ramp time from annealing to extension 0.125 °C/s, was applied to complete other RAPD primers.
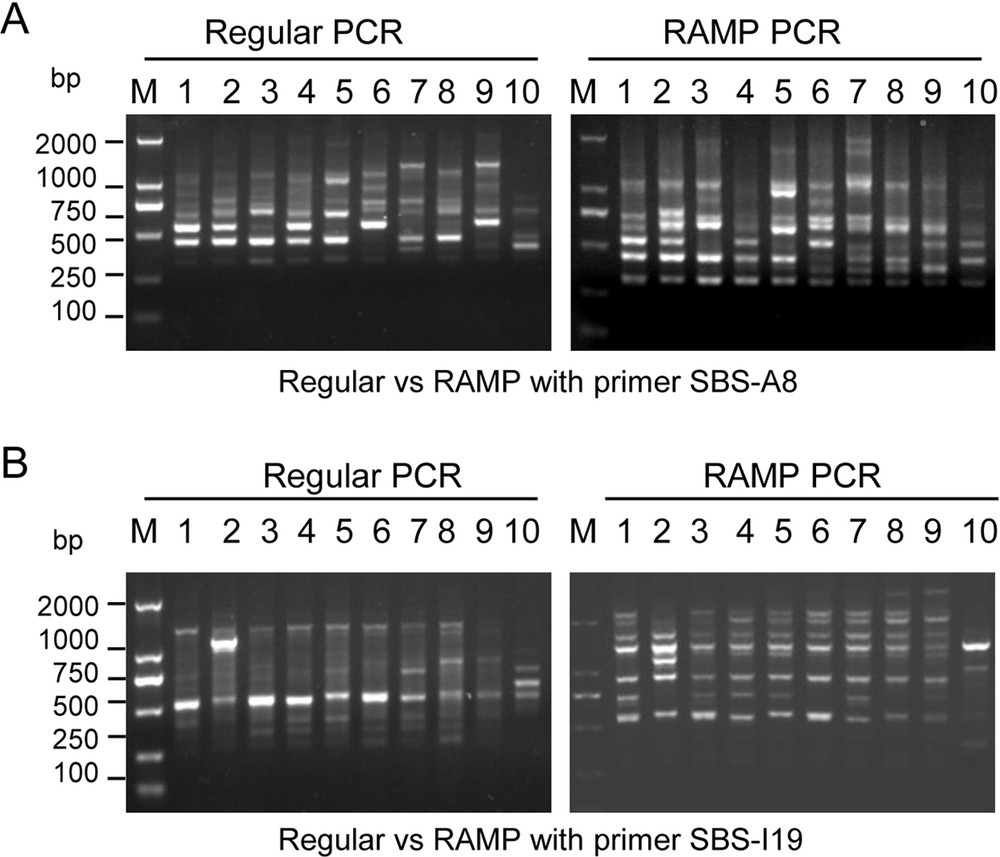
The results of improved RAPD. A. Primer SBS-A8. B. Primer SBS-I19. Regular PCR represents regular RAPD amplification, while ramp-PCR represents improved RAPD amplification. The number represents different samples shown in Table 1. “M” means DL2000 DNA marker with the indicated molecular weight size (bp).
3.2 Amplification results of improved RAPD analysis
Twenty primers (Table 2) were used to conduct improved RAPD analysis, and RAPD results were improved. PCR reaction for each sample was repeated three times, and generated reproducible polymorphic amplification bands. The representative fingerprints are shown in Fig. 3. The band sizes of the PCR products ranged from 200 bp to 2500 bp (Fig. 3). A total of 221 bands were obtained, among which polymorphic fragments accounted for 82.3%, indicating high genetic diversity among the10 experimental materials with average amplification bands of 10.05 per primer. A maximum of bands (14) appeared when primer SBS-Q7 was used (data not shown). The results indicated that these primers are useful to identify DNA polymorphisms and perform the analysis of the genetic relationships in C. album samples.
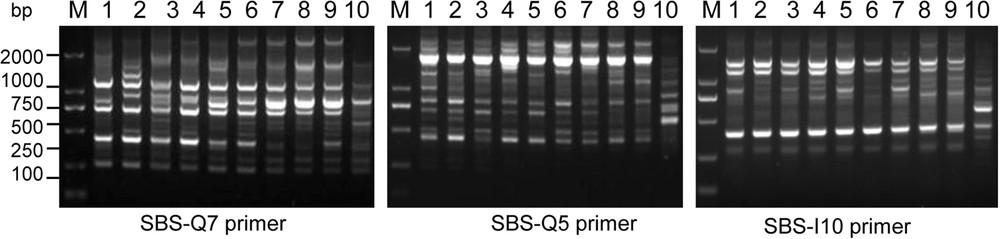
The different banding patterns of C. album samples using the improved RAPD method. The number represents the different samples shown in Table 1. “M” means DL2000 DNA marker with the indicated molecular weight size (bp). Only partial results are shown.
3.3 Genetic distance and cluster analysis by improved RAPD
The genetic relationship dendrogram was obtained by conducting cluster analysis to the similarity coefficient of the above-mentioned ten cultivars by improved RAPD (Fig. 4). Their similarity coefficient ranged from 0.46 to 0.86 (Fig. 4B). Among the similarity coefficients of the cultivars, the similarity coefficients of samples QZ and GL were the highest at 0.86, and clustered together, whereas the similarity coefficients of samples PE and FZ were the lowest at 0.46, which showed the biggest genetic distances (Fig. 4A and B). The similarity coefficient of sample PE was lower than those of the other nine samples (Fig. 4A).
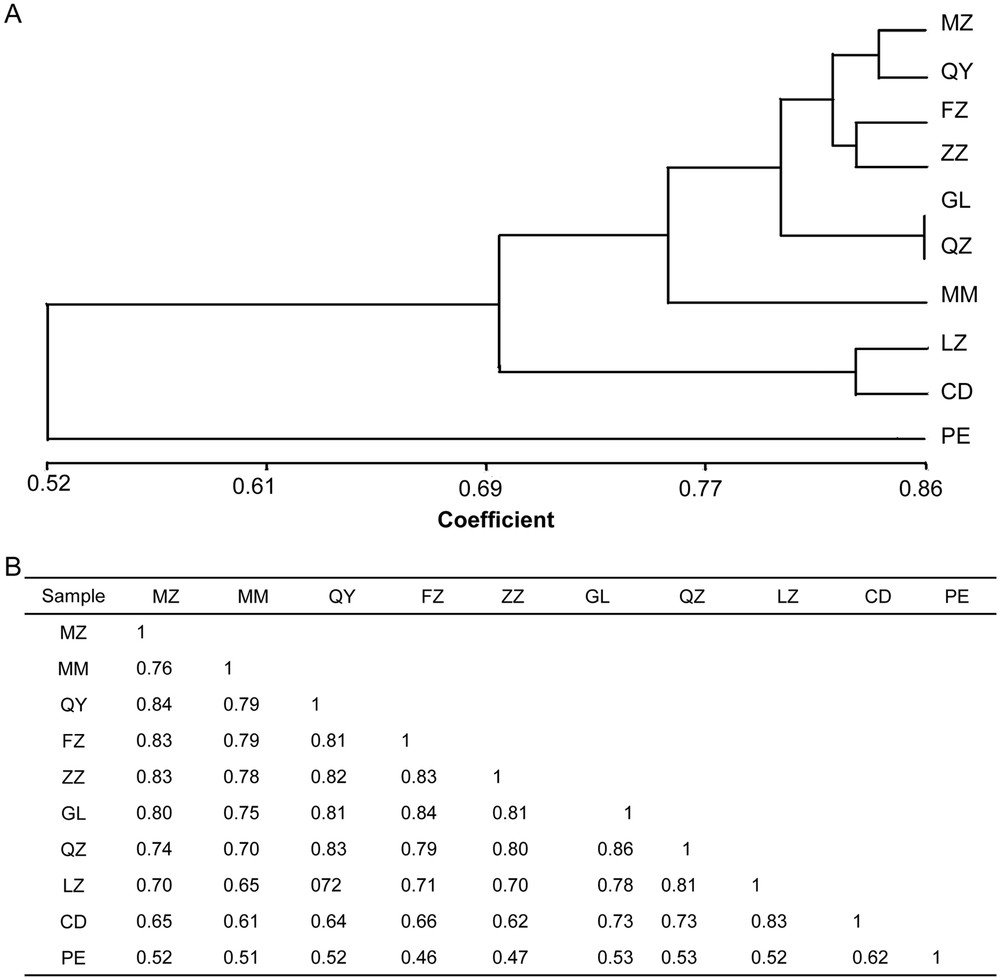
Dendrogram of C. album samples based on improved RAPD. A. Dendrogram of C. album samples based on 221 PCR bands amplified by the 20 primers. The bar on the bottom indicates the similarity index based on the SM coefficient. B. Genetic distance for C. album samples using improved RAPD. The number represents the different samples shown in Table 1.
3.4 Amplification results of the ISSR analysis
Twenty primers (Table 3) were used to conduct the ISSR analysis, and improved RAPD results were obtained. The PCR reaction for each sample was repeated three times, and generated reproducible polymorphic amplification bands. The representative fingerprints are shown in Fig. 5. The band sizes of PCR products ranged from 150 bp to 2000 bp (Fig. 5). A total of 147 bands were obtained, among which polymorphic fragments accounted for 83.5%, indicating high genetic diversity among the 10 experimental materials, with an average amplification band of 7.35 per primer. A maximum of bands (12) appeared when primer 841 was used. The results indicated that these primers are useful in identifying DNA polymorphisms and performing genetic relationship analysis in C. album samples.
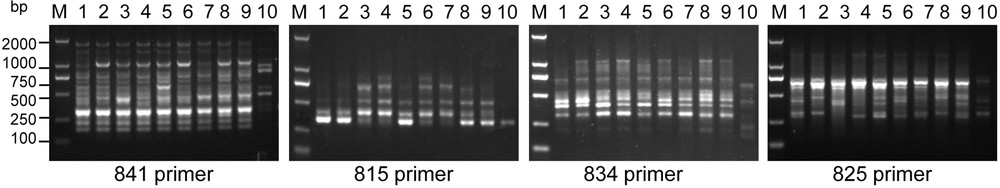
The different ISSR banding patterns in C. album samples. The numbers 1 to 10 indicate the different samples showed in Table 1. “M” means DL2000 DNA marker with the indicated molecular weight size (bp). Only partial results are shown.
3.5 Genetic distance and cluster analysis by ISSR
The genetic relationship dendrogram was obtained by conducting cluster analysis to the similarity coefficient of the above-mentioned ten cultivars by ISSR (Fig. 6). Their similarity coefficient ranged from 0.36 to 0.89 (Fig. 4B). Among the similarity coefficients of the cultivars, the similarity coefficient of samples QZ and GL was highest at 0.89, and clustered together. Whereas the similarity coefficient of samples PE and LZ was lowest at 0.36, which showed the biggest genetic distances (Fig. 4A and B). The similarity coefficient of sample PE was lower than those of the other nine samples (Fig. 4A).
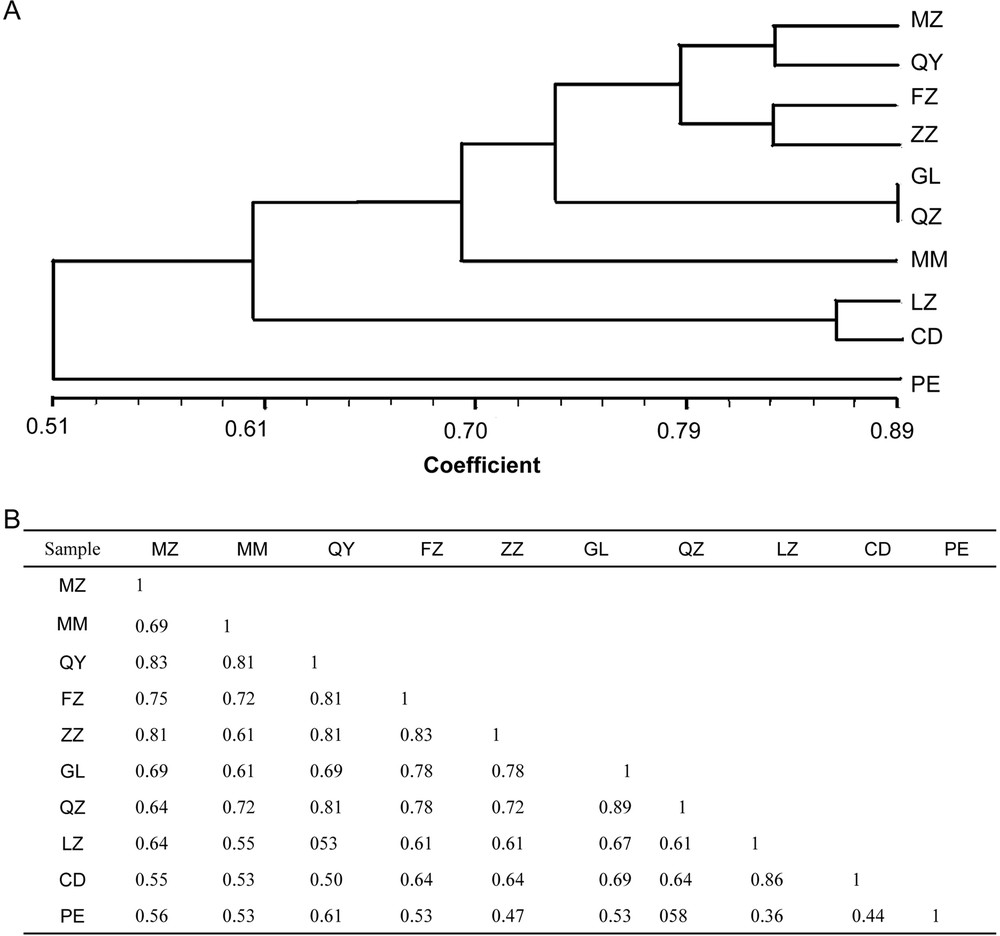
Dendrogram of C. album samples based on ISSR. A. Dendrogram of C. album samples based on 147 PCR bands amplified by the 20 primers. The bar on the bottom indicates the similarity index based on the SM coefficient. B. Genetic distance dendrogram for C. album samples. The number represents the different samples shown in Table 1.
4 Discussion
Since the 1990s, a number of molecular marker techniques have been developed, including random RAPD [9,15–17], ISSR [18,19], and amplified fragment length polymorphism (AFLP) [20], etc., which has been widely used in the genetic identification of various plants and animals [21,22]. ISSR frequently occurs in most eukaryotic genomes and can be very informative, reliable (reproducible), co-dominant, multi-allelic, and highly polymorphic, making them well suited for detecting variations among closely related varieties [23]. However, the application of the ISSR technique to plants is only possible when the microsatellite markers suitable for that plant were available [24]. It has been proved that ISSR is available for studying C. album [25,26]. RAPD is characterized by fewer requirements on template DNA, no pollution, and inexpensive, but also by disadvantages as poor reproducibility and low production. Fu et al. [10] reported that the resolution and production of RAPD are greatly increased by prolonging the ramp time from annealing to extension. To examine the effectiveness of RAPD method in C. album, an improved RAPD technique has been developed and applied by prolonging the ramp time from 2.5 °C/s to 0.125 °C/s. Here, 2.5 °C/s was the default ramp time, we called it regular RAPD-PCR or regular PCR; 0.125 °C/s ramp time was the reduced rate of ramp time, we called it improved RAPD-PCR or ramp-PCR. In our analysis, we obtain 221 bands in randomly selected 20 primers by ramp-PCR.
The production of RAPD was improved, and the number of DNA amplified bands was increased by prolonging the ramp time. Specifically, in SBS-A8 amplification patterns, the numbers of band and productions are enhanced obviously in sample No. 1 by ramp-PCR from 3 to 6 (Fig. 2A); in SBS-I19 amplification patterns, the band numbers and productions are enhanced obviously in sample No. 1 by ramp-PCR from 3 to 7, respectively (Fig. 2A, B). Therefore, the C. album accessions are distinguishable using our improved RAPD technique according to the abundant DNA polymorphisms. The method described here can amplify more specific DNA bands from the primers (Fig. 2). The reason may be that prolonging the ramp time is beneficial to DNA template binding with primers. Furthermore, the low heating speed was beneficial to increasing the bond stability of the primer with template DNA, preventing the primer from detaching from the template [22], thus increasing the number of bands and the PCR product yields. Therefore, RAPD with ramps of slower speed can be used to increase the yields, resolutions, and numbers of polymorphic bands, thereby increasing the stability and accuracy of the experimental results.
T. chebula, commonly known as yellow or chebulic myrobalan, is often confused with C. album from the point of view of the phenotype, whereas they are different from each other at the gene level based on our current study. The medical value can be highlighted when T. chebula is distinguished from C. album. Our cluster analysis reveals that all 10 samples were clustered into two groups by both RAPD and ISSR methods. Sample PE (T. chebula) form an own group itself, showing lowest genetic similarity and highest genetic distance compared with the other nine samples (C. album). Our study confirmed that C. album is a different cultivar than T. chebula, and revealed a low genetic relationship between sample PE and the other ones.
This study may provide a useful source of genetic diversity in C. album, because it included genotypes from different parts of China. The genetic level of differentiation may connect with the geographical distribution. Samples CD and LZ, sampled from two places in the Sichuan Basin, are clustered together, showing close genetic relationship. The other 7 samples, whose locations are close to each other, were clustered together, exhibiting the existence of high genetic similarity and low genetic distance. These genotypes can be applied in future breeding selection to maximize the genetic diversity in C. album.
Despite the discrimination of PCR amplified profiles in the two marker assays [25], some differences could be detected between RAPD and ISSR [27]. In our study, similar results were obtained by both methods, indicating that ISSR is obviously a useful tool to study C. album. Actually, the polymorphic fragments detected by ISSR (83.5%) were higher than that (82.3%) detected by RAPD, although less bands were achieved, revealing that the ISSR makers selected in this study are suitable to study the genetic diversity of C. album. Due to the traits that ISSR markers link to SSR loci, ISSR markers are likely to mark gene-rich regions [28,29], which might be useful in breeding selection. To our best knowledge, this is the first report of a genetic diversity study of C. album combining both improved RAPD and ISSR technique.
5 Conclusion
In this study, we show that improved RAPD and ISSR methods are useful for studying the genetic diversity of C. album. Our study provides a theoretical basis for the breeding and classification of C. album in China. The improved RAPD and ISSR could be effective techniques to analyze the polymorphism and genetic relationships in a variety of applications, including C. album.
Disclosure of interest
The authors declare that they have no competing interest.
Acknowledgments
The work was supported in part by the Science and Technology Innovation Team of Colleges and Universities of Sichuan Province (13TD0032), and the Research Foundation of the Science and Technology Department of Sichuan Province (14JC0797, 2015JY0038).