

1 Introduction
Cleome is the largest genus in the family Cleomaceae, containing over 200 species [1,2]. Cleome species are widely distributed in tropical and subtropical regions [2–4]. Traditionally Cleome is known for its different medicinal properties such as leaf paste on headache, leaf juice of Cleome gynandra on earache and skin disease [5]. Nevirapine, a non-nucleoside inhibitor of HIV-1 reverse transcriptase was isolated from the seeds of Cleome viscosa [6]. Many African countries cultivated the Cleome species for their foliage, which has some medicinal properties [7]. Genetic circumscription of genus Cleome was universally accepted for the past 70 years, but recently the Cleome genus was split into a number of segregate genera [8]. Some of the Cleome species now placed in Corynandra and Cleoserrata genus. The Corynandra genus includes 5 species [9]. The Cleoserrata genus contains two species [10].
Cleome, Corynandra and Cloeserrata are the taxa of the Cleomaceae family; however, problems were encountered when trying to identify phylogenetic relationships among the genera of the Cleomaceae family. Previous studies indicated that some of the species from other genera of Cleomaceae were grouped with Cleome species and could not get clearly resolved from the Cleome genus [11,12]. DNA barcoding and molecular markers have importance for identifying the species at the molecular level and determining the phylogenetic relationship among the species. DNA barcoding is a promising genetic variation detection technology [13] that uses a standardized DNA region for the discrimination of plant species [14–16]. DNA barcoding is useful not only for species identification, but also to determine the relatedness among genotype crop varieties and germplasm resources [17].
Previously, the Cladistic study of Cleome was done by Sánchez-Acebo [18]. She reconstructed the molecular phylogeny of Cleome and analysed the relationship of several New World Cleome taxa, including some representatives from the Old World and of the close genus Podandrogyne, using the plastid trnH-psbA region. The Nuclear Internal transcribed spacer (ITS) region was also used previously to study the molecular phylogeny of various Cleome species and of its close relatives Podandrogyne Ducke and Polanisia Raf. [11].
There is a need for DNA fingerprinting for all the genetic resources of the medicinal plants for the creation of molecular databases. Molecular markers help the researchers to authenticate the genotypes as well as assessing and exploiting genetic variability [19]. Randomly amplified polymorphic DNA (RAPD) is useful for assessing the genetic diversity among species [20]. Previous reports on genetic diversity analysis of Cleome species using molecular markers were limited to only one of the species of Cleome, like the genetic diversity of Cleome gynandra morphotypes using RAPD markers [21]. RAPD, ISSR and AFLP markers were used to assess genetic variability between Cleome droserifolia and some other medicinal plants [22].
Recently some species from the Cleome genus (Cleome viscosa, Cleome chelidonii, Cleome felina and Cleome speciosa) were split into genera Corynandra (Corynandra viscosa, Corynandra chelidonii, Corynandra felina) and Cleoserrata (Cleoserrata speciosa). Our main aim was to establish the relationship among the Cleome lineages and with respect to Corynandra and Cleoserrata. In the present study, we have used DNA barcoding for the phylogenetic analysis of these species. Various DNA barcoding regions were tested for their PCR amplification efficiency and sequencing success. In addition, we have examined the RAPD and ISSR markers to estimate the genetic diversity among the Cleome, Corynandra and Cleoserrata species. We have also determined the efficiency of RAPD and ISSR marker systems for discriminating species.
2 Materials and methods
2.1 Collection of plant materials
Cleome, Corynandra and Cleoserrata plant species were collected from different geographical locations in the Maharashtra, Karnataka and Tamilnadu States of India. Reference voucher specimens were deposited at the Department of Botany, Shivaji University, Kolhapur. Information about the collected plant species is displayed in Table 1.
Plant samples used in this study.
| Species | Origin | Location | Voucher ID |
| Corynandra viscosa (C1) | Dandewadi (Ratnagiri) | N 16°33.839 E 73°21.396 | ARG-302 |
| Corynandra viscosa (C2) | Ujalaiwadi (Kolhapur) | N 16°40.535 E 74°16.185 | ARG-307 |
| Cleome monophylla (C3) | Badami (Karnataka) | N 15°56.177 E 75°39.402 | ARG-305 |
| Cleome monophylla (C4) | Madurai (Tamilnadu) | N 09°54.200 E 78°09.264 | ARG-314 |
| Corynandra chelidonii (C5) | Rajapur (Ratnagiri) | N 16°39.114 E 73°31.299 | ARG-301 |
| Corynandra chelidonii (C6) | Shivaji university, Kolhapur | N 16°40.548 E 74°15.032 | ARG-303 |
| Cleome simplicifolia (C7) | Shivaji university, Kolhapur | N 16°40.305 E 74°15.169 | ARG-308 |
| Cleome gynandra (C8) | Jaisingpur (Kolhapur) | N 16°46.191 E 74°32.149 | ARG-309 |
| Cleome gynandra (C9) | Shirol (Kolhapur) | N 16°44.580 E 74°35.504 | ARG-310 |
| Cleome rutidosperma (C10) | Shivaji university, Kolhapur | N 16°40.283 E 74°15.249 | ARG-306 |
| Cleome rutidosperma (C11) | Madurai (Tamilnadu) | N 09°55.587 E 78°05.148 | ARG-313 |
| Cleome aspera (C12) | Salem (Tamilnadu) | N 11°39.491 E 78°08.432 | ARG-311 |
| Corynandra felina (C13) | Salem (Tamilnadu) | N 11°39.262 E 78°08.211 | ARG-312 |
| Cleoserrata speciosa (C14) | Shivaji University, Kolhapur | N 16°40.545 E 74°15.323 | ARG-304 |
2.2 DNA extraction
Total genomic DNA was isolated from fresh and young leaves of plant species by using the modified CTAB method with some modifications [23]. The quality of isolated DNA samples was determined by running the DNA samples on 1% Agarose gel. Quantification of DNA samples was done using Biospectrometer (Eppendorf, USA); the final DNA concentration was diluted to 20 ng/μL for RAPD and ISSR analysis.
2.3 PCR amplification and sequencing
Initially, various barcoding regions, like four coding regions (matK, rbcL, rpoB, and rpoC), three non-coding regions (atpF-atpH, trnH-psbA and psbK-psbI), and three nuclear ITS regions (ITS14, ITS1, ITS2) from collected species were tested for their PCR amplification efficiency. The barcoding regions having PCR amplification success greater than 50% were selected for further study. Selected DNA barcoding regions, primers pair used for barcode region amplification and PCR conditions were listed in Table 2. PCR amplification reactions were performed in volume of 45 μl containing 10X Taq buffer A (Tris with 15 mM MgCl2) (GeNei, INDIA), 10 mM dNTP mix (GeNei, INDIA), 15 pM forward and reverse primer, 1U Taq DNA polymerase (GeNei, INDIA) and 50–100 ng of template DNA. The amplification reaction was carried out in the thermal cycler (BIO-RAD, USA). The PCR products were purified using a PCR purification kit (SIGMA-ALDRICH, USA). Purified PCR products were then sequenced in both directions using the same primers as those that were used for barcoding region amplification (Table 2). Sequencing of the barcoding region was done using an ABI 3500 Genetic analyzer (Applied Biosystems, USA). The sequences of matK, rbcL and ITS1 regions were submitted to the GenBank NCBI database. Accession numbers of submitted sequences are shown in Table 3.
Sequences of primers and reaction conditions.
| Barcoding region | Primer name | Primer sequence (5’–3’) | PCR condition |
| matK | KIM 3F | CGTACAGTACTTTTGTGTTTACGAG | 94 °C 5 min, 35 cycles (94 °C 30 s, 52 °C 20 s, 72 °C 50 s) 72 °C 10 min |
| KIM 1R | ACCCAGTCCATCTGGAAATCTTGGTTC | ||
| rbcL | rbcLa-F | ATGTCACCACAAACAGAGACTAAAGC | 94 °C 4 min, 35 cycles (94 °C 30 s, 55 °C 1 min, 72 °C 1 min) 72 °C 10 min |
| rbcLa-R | GAAACGGTCTCTCCAACGCAT | ||
| ITS1 | ITS1 | TCCGTAGGTGAACCTGAGG | 94 °C 5 min, 40 cycles (94 °C 1 min, 55 °C 1 min, 72 °C 1 min 30 s) 72 °C 10 min |
| ITS2 | GCTGCGTTCTTCATCGATGC |
GenBank accession numbers of three DNA barcoding regions.
| Plant species | Area of collection | Accession numbers | ||
| rbcL | matK | ITS1 | ||
| Corynandra viscosa (C1) | Rajapur (Ratnagiri) | KT588791 | KT588805 | KT588819 |
| Corynandra viscosa (C2) | Ujalaiwadi (Kolhapur) | KT588790 | KT588804 | KT588818 |
| Cleome monophylla (C3) | Badami (Karnataka) | KT588792 | KT588806 | KT588820 |
| Cleome monophylla (C4) | Madurai (Tamilnadu) | KT588793 | KT588807 | KT588821 |
| Corynandra chelidonii (C5) | Rajapur (Ratnagiri) | KT588794 | KT588808 | KT588822 |
| Corynandra chelidonii (C6) | Shivaji university, Kolhapur | KT588795 |
KT588809 |
KT588823 |
| Cleome simplicifolia (C7) | Shivaji university, Kolhapur | KT588796 | KT588810 |
KT588824 |
| Cleome gynandra (C8) | Jaisingpur (Kolhapur) | KT588797 | KT588811 | KT588825 |
| Cleome gynandra (C9) | Shirol (Kolhapur) | KT588798 | KT588812 | KT588826 |
| Cleome rutidosperma (C10) | Shivaji university, Kolhapur | KT588799 |
KT588813 | KT588827 |
| Cleome rutidosperma (C11) | Madurai (Tamilnadu) | KT588800 | KT588814 | KT588828 |
| Cleome aspera (C12) | Salem (Tamilnadu) | KT588801 | KT588815 | KT588829 |
| Corynandra felina (C13) | Salem (Tamilnadu) | KT588802 | KT588816 | KT588830 |
| Cleoserrata speciosa (C14) | Shivaji University, Kolhapur | KT588803 | KT588817 | KT588831 |
2.4 Sequence alignment and phylogenetic analysis
The open reading frame (ORF) of coding regions rbcL and matK were initially defined and sequences of rbcL and matK were aligned by using Muscle (Codons) option in MEGA 5 software [24]. ITS is the non-coding region and its sequences were aligned using the Muscle option in MEGA 5 software. The non-alignable part of sequences was excluded prior to efficient analysis. Available rbcL, matK and ITS sequences of other Cleome, Corynandra and Cleoserrata species from the NCBI database were extracted. Sequences of these species were used for the elucidation of phylogenetic relationship with species studied in this paper. Those rbcL and matK sequences not in ORF and of poor quality ITS sequences were excluded prior to phylogenetic analysis. Outgroup selection is a very important step during the construction of phylogeny. A more appropriate outgroup would be a species from a closely related family. Representatives of Brassicaceae were used as outgroups because they are a closely related family of Cleomaceae [1]. A Maximum Parsimony (MP) bootstrap (1000 replicates) tree was constructed for each DNA barcoding region in MEGA 5 software. Conserved sites, variable sites and parsimony-informative sites for each region were calculated using MEGA 5 software. Genetic diversity parameters including the number of nucleotide diversity (Pi), haplotype diversity (Hd), average number of nucleotide difference (k) and neutrality tests like Tajima's D, Fu & Li's D and Fu & Li's F tests were calculated by using DnaSP software [25].
2.5 RAPD and ISSR amplification
RAPD and ISSR PCR amplification reactions were performed in a 17-μl volume containing 10X Taq buffer A (Tris with 15 mM MgCl2) (GeNei, INDIA), 10 mM dNTP mix (GeNei, INDIA), 15 pM primer, 5 U Taq DNA polymerase (GeNei, INDIA), and 40 ng of template DNA. The amplification reactions were carried out in a thermal cycler (BIO-RAD, USA) programmed for initial denaturation at 94 °C for 5 min, 35 cycles of denaturation at 94 °C for 1 min, annealing at 37 °C for 1 min for RAPD and at 40 °C for 2 min for the ISSR, and extension at 72 °C for 1 min. A final extension was carried out at 72 °C for 10 min. After completion of RAPD and ISSR PCR reaction products of amplification were checked on 3% agarose gel and stained with ethidium bromide.
2.6 RAPD and ISSR data analysis
The RAPD and ISSR PCR amplified DNA fragments were scored as either ‘present’ (1) or ‘absent’ (0). A binary qualitative data matrix was constructed. Then, the resulting binary data matrix was imported in POPGENE Version 1.32 [26] for the calculation of Nei's gene diversity (H) and Shannon's information index (I) among the studied species. The polymorphic information content (PIC) of each primer was calculated by using Power Marker software [27]. In addition, Nei's genetic distance (GD) matrix was constructed using AFLP-SURV version 1.0 [28]. Mantel's test was performed using XLSTAT software (Addinosoft, France) in order to estimate the correlation between Nei's GD matrix based on RAPD and ISSR data. A dendrogram was constructed based on Nei's GD by using the unweighted pair-group method (UPGMA) [29] of the NTSYS-PC program version 2.1 [30] to estimate the genetic relationship among species of Cleome, Corynandra and Cleoserrata. The Nei's GD matrix was also used for principal coordinate analysis (PCA) [31]. PCA was performed to estimate the GDs among species using the DCENTER and EIGEN modules of the NTSYS-PC program 2.1.
3 Results
3.1 Screening of barcoding regions
A total of 10 barcoding regions were initially screened for their PCR efficiency, out of which rbcL (100%), matK (71.42%) and ITS1 (85.71%) regions showed PCR amplification success greater than 50% and were selected for further study (Table 4). The percent of sequencing success was greater for rbcL (92.85%) and lower for matK (64.28%). The approximate length of amplified PCR products of rbcL, matK and ITS1 were 700, 800 and 400 bp, respectively. The length of good-quality sequences of these three regions were in the ranges of 316–577 bp, 392–625 bp, and 252–325 bp for rbcL, matK and ITS1, respectively (Table 4).
Evaluation of the three DNA barcoding regions.
| Variable | rbcL | matK | ITS1 |
| No. of samples | 14 | 14 | 14 |
| % of PCR success | 100 | 71.42 | 85.71 |
| % sequencing success | 92.85 | 64.28 | 78.57 |
| Amplified product length (bp) | ∼ 700 | ∼ 800 | ∼ 400 |
| Sequenced fragment length (bp) | 316–577 | 392–625 | 252–325 |
3.2 Genetic diversity and phylogenetic analysis
In the rbcL, 274 nucleotides were conserved out of 297 aligned nucleotides. Twenty-three variable and 14 parsimony-informative sites were observed (Table 5). In matK, 181 nucleotides were conserved out of 215 aligned nucleotides with 20 parsimony-informative and 34 variable sites. Forty-two parsimony-informative and 52 variable sites were recorded in the ITS1 region. Forty-four nucleotides were conserved in 101 aligned nucleotides in ITS1. The neutrality test like Tajima's D, Fu & Li's D and Fu & Li's F were not significant and showed a negative estimation for rbcL, matK, and ITS1 regions (Table 5).
Estimation of genetic diversity and test statistic for rbcL, matK and ITS1 regions.
| Barcoding region | n | vs | pis | cs | Pi | Hd | k | Tajima's D | Fu & Li's D | Fu & Li's F |
| rbcL | 297 | 23 | 14 | 274 | 0.02395 | 0.945 | 7.06593 | −0.09719 NS | −0.82437 NS | −0.67820 NS |
| matK | 215 | 34 | 20 | 181 | 0.04471 | 0.956 | 9.16484 | −0.24495 NS | −0.37494 NS | −0.09249 NS |
| ITS1 | 101 | 52 | 42 | 44 | 0.21029 | 0.945 | 19.97802 | −0.23489 NS | −0.57136 NS | −0.13701 NS |
The MP tree of Cleome, Corynandra and Cleoserrata species based on barcoding regions revealed that Cleome gynandra (Gynandropsis) and Corynandra viscosa were clustered separately and not combined with the Cleome and Cleoserrata species. Corynandra chelidonii and Corynandra felina were grouped with the Cleome simplicifolia and Cleome aspera species. Cleoserrata speciosa was combined with the Cleome species (Figs. 1, 2, 3).
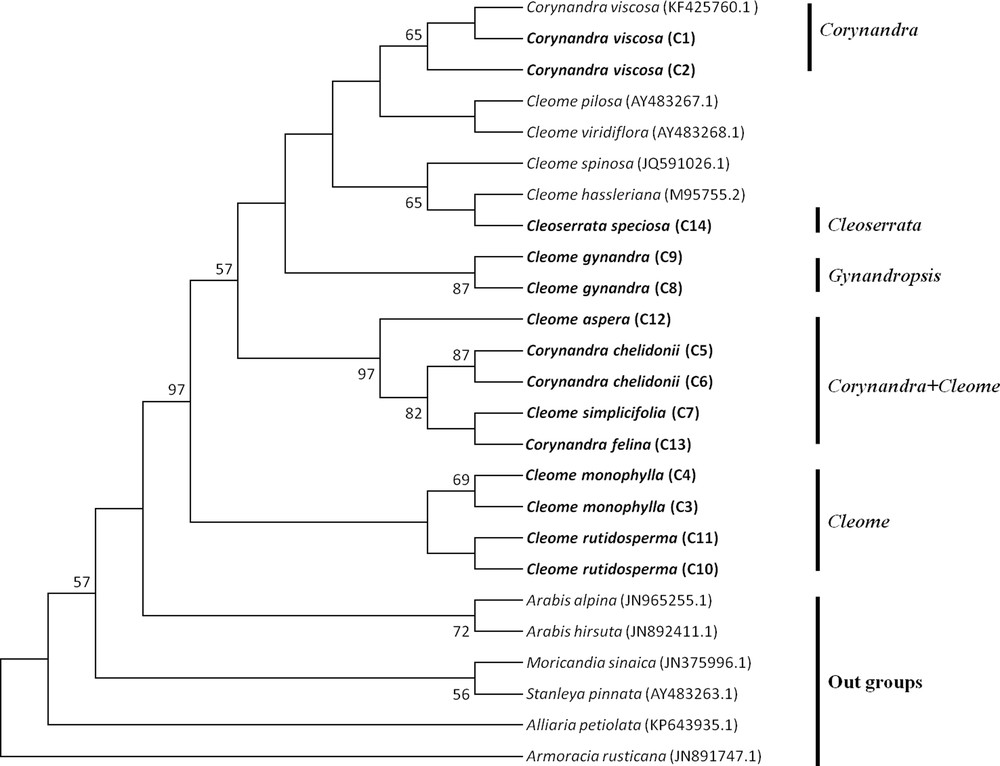
Maximum Parsimony tree of Cleome, Corynandra and Cleoserrata species based on the rbcL region. Bootstrap values are indicated on branches. The species written in bold were studied in this paper. GenBank accession numbers for sequences, which were retrieved from NCBI are given in brackets.
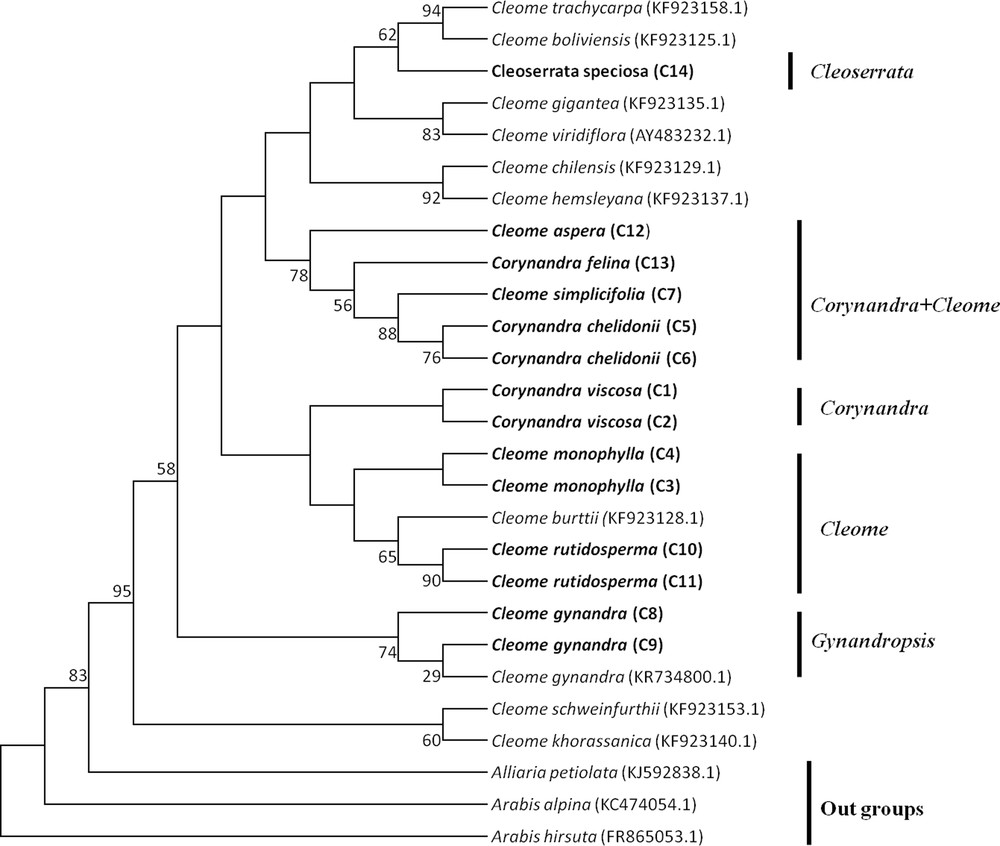
Maximum Parsimony tree of Cleome, Corynandra and Cleoserrata species based on the matK region. Bootstrap values are indicated on branches. Species written in bold were studied in this paper. GenBank accession numbers for sequences, which were retrieved from NCBI are given in brackets.
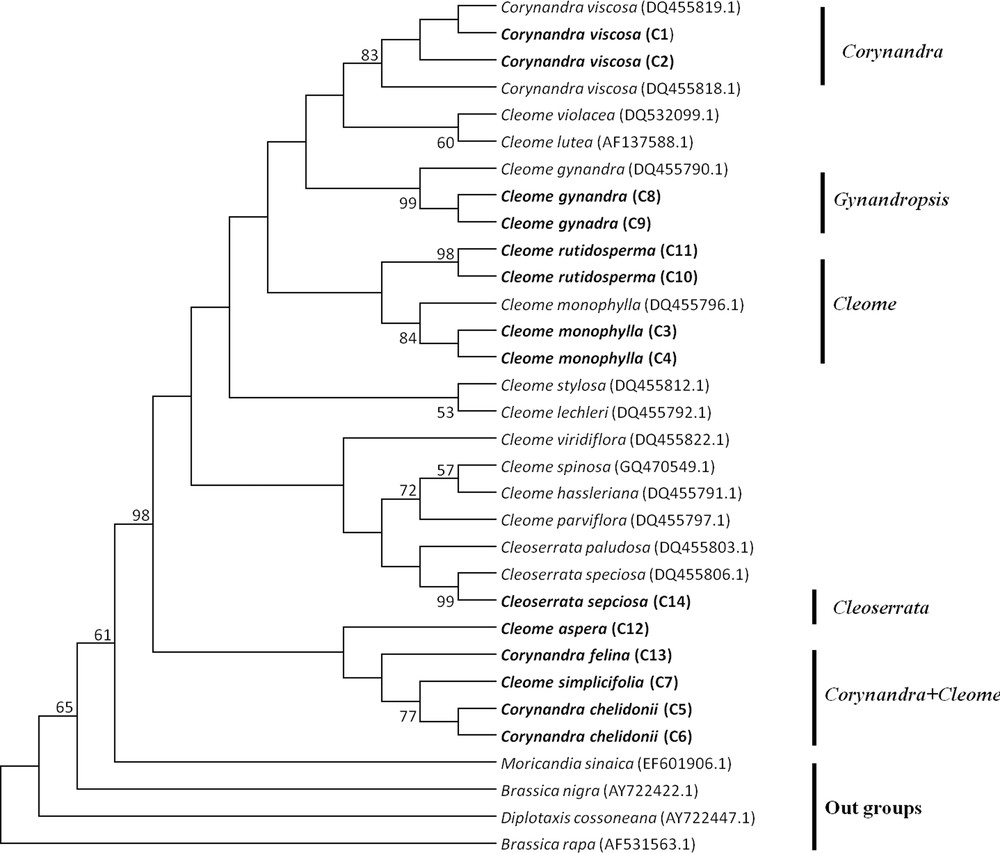
Maximum Parsimony tree of Cleome, Corynandra and Cleoserrata species based on the ITS region. Bootstrap values are indicated on branches. Species written in bold were studied in this paper. GenBank accession numbers for sequences, which were retrieved from NCBI are given in brackets.
3.3 Molecular marker analysis
A total of 45 RAPD and 30 ISSR primers were initially screened, among which 14 RAPD and 9 ISSR primers were selected based on their consistency in results. The 14 RAPD primers produced 428 bands and all those were polymorphic. Selected RAPD primers gave 100% polymorphism, producing 30.57 bands per primer. In the case of ISSR, nine primers produced 258 bands, out of which 257 bands were polymorphic. Selected ISSR primers gave 100% of polymorphism (except HB 13 which gave 92.85% of polymorphism), producing 28.66 bands per primer (Table 6). Spearman's correlation analysis showed a low degree of positive correlation between data generated by RAPD and ISSR markers (r = 0.369, p = 0.028) (Fig. 4). Each selected RAPD and ISSR primer was further screened for the discrimination of the Cleome, Corynandra, and Cleoserrata species. UPGMA dendrogram based on Nei's GD was constructed to determine the discriminating power of each primer. None of the RAPD and ISSR primers discriminates species from these three genera clearly. Two RAPD primers (OPA-4 and RAPD-17) and 2 ISSR primers (ISSR-1 and ISSR-2) discriminate only Cleoserrata speciosa from the Cleome and Corynandra species.
Genetic diversity among the plants used in this study.
| Primer | Sequence (5′–3′) | PB | % PB | He | I | PIC |
| RAPD | ||||||
| OPA-1 | GTGACGTAGG | 28 | 100 | 0.1148 | 0.2278 | 0.6627 |
| OPA-3 | GGGTAACGCC | 29 | 100 | 0.1246 | 0.2402 | 0.6072 |
| OPA-4 | AGGTGACCGT | 37 | 100 | 0.1265 | 0.2437 | 0.7279 |
| OPA-5 | GTTGGCGGCT | 35 | 100 | 0.1313 | 0.2544 | 0.5567 |
| OPA-7 | GGCGGTTGTC | 26 | 100 | 0.1115 | 0.2223 | 0.6119 |
| OPD-18 | GAGAGCCAAC | 25 | 100 | 0.1192 | 0.2314 | 0.7279 |
| OPW-04 | CAGAAGCGGA | 40 | 100 | 0.1254 | 0.2431 | 0.7615 |
| AB4-13 | GTCAGAGTCC | 32 | 100 | 0.1165 | 0.2272 | 0.7615 |
| OPW-18 | TTCAGGGCAC | 37 | 100 | 0.1187 | 0.2342 | 0.6773 |
| RAPD-16 | GGTGGCGGGA | 24 | 100 | 0.1247 | 0.2436 | 0.5267 |
| RAPD-17 | CCTGGGCCTC | 21 | 100 | 0.1222 | 0.2390 | 0.5688 |
| RAPD-34 | CCGGCCCCAA | 21 | 100 | 0.1167 | 0.2268 | 0.6627 |
| RAPD-70 | CGGCACGGGA | 38 | 100 | 0.1229 | 0.2384 | 0.7938 |
| RAPD-81 | GAGCACGGGG | 35 | 100 | 0.1323 | 0.2508 | 0.7615 |
| Mean | 30.57 | 100 | 0.1219 | 0.2373 | 0.6720 | |
| ISSR | ||||||
| ISSR-1 | GGACGGACGGACA | 34 | 100 | 0.1374 | 0.2609 | 0.7615 |
| ISSR-2 | GGACGGACGGACC | 34 | 100 | 0.1433 | 0.2700 | 0.6987 |
| 17898B | CACACACACACAGT | 40 | 100 | 0.1410 | 0.2682 | 0.7279 |
| 17899A | CACACACACACAAG | 25 | 100 | 0.1403 | 0.2666 | 0.5652 |
| HB8 | GAGAGAGAGAGAGG | 31 | 100 | 0.1208 | 0.2369 | 0.7279 |
| HB10 | GAGAGAGAGAGACC | 28 | 100 | 0.1252 | 0.2404 | 0.7883 |
| UBC-827 | ACACACACACACACACG | 23 | 100 | 0.1164 | 0.2302 | 0.4889 |
| HB12 | CACCACCACGC | 29 | 100 | 0.1287 | 0.2485 | 0.7279 |
| HB 13 | GAGGAGGAGGC | 13 | 92.85 | 0.1714 | 0.3072 | 0.7341 |
| Mean | 28.66 | 99.61 | 0.1360 | 0.2587 | 0.6911 |
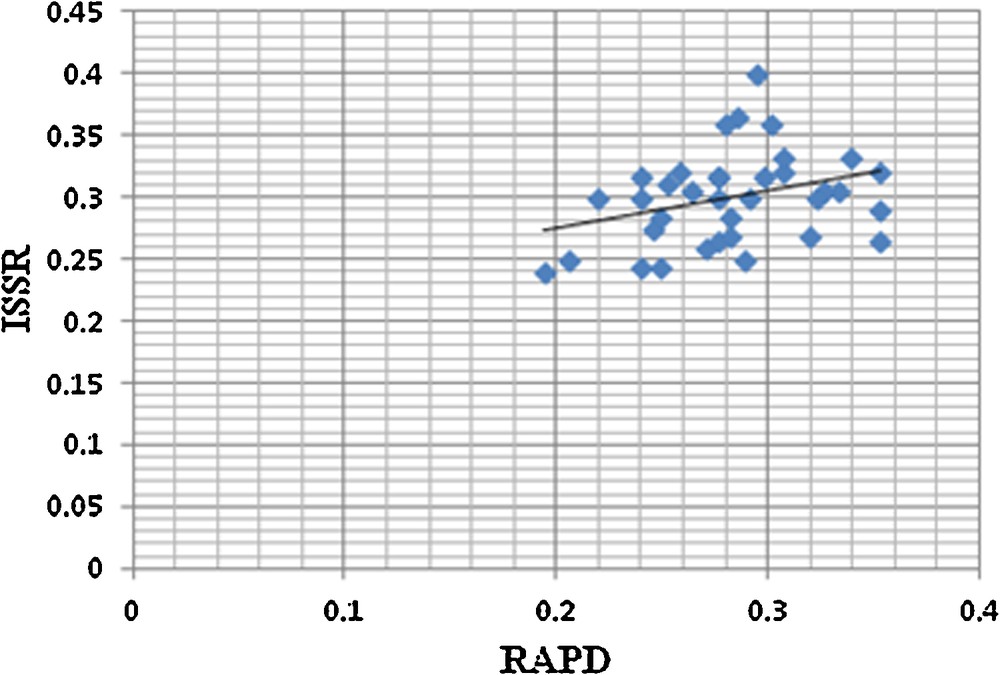
Correlation between Nei's genetic distance matrices generated by RAPD and ISSR data.
4 Discussions
Medicinal plant identification seems to be difficult by using only morphological characters. DNA barcoding overcomes the problem of plant identification and generates a universal standard. Region with sufficient variation and adequate conserved loci can be used as DNA barcode [32,33]. The success of DNA barcoding depends mainly on the PCR amplification efficiency and on the rate of DNA sequencing. PCR amplification and bidirectional sequencing of rbcL, matK and ITS1 markers were successfully carried out in all collected accessions.
The ITS region includes two internal spacers ITS1 and ITS2. ITS region has been widely used in the identification of medicinal plants and of their closely related species [14]. The short ITS sequences can serve as a more efficient tag to identify plants in comparison with full-length ITS [34]. ITS sequences obtained in this study had a length of 252–325 bp and identifies four species (Corynandra viscosa, Cleome gynandra, Cleome monophylla, Cleoserrata speciosa) more precisely since they have had their ITS region previously sequenced. The highest genetic variation was found in the non-coding ITS region of studied species by considering parameters of genetic diversity, viz. the number of polymorphic sites, nucleotide diversity and an average number of nucleotide difference (Table 5). The negative estimation of neutrality tests for three barcoding regions indicates an excess of singletons. The significance of negative Tajima's D is that there is an excess of low-frequency polymorphisms relatively to the expectations, indicating an expansion of the population's size.
The MP phylogenetic hypothesis based on the rbcL, matK and ITS regions (Figs. 1–3) correspond well with each other and with previous phylogenetic estimates in Cleomaceae [11,12], especially with the Corynandra, Gynandropsis (Cleome gynandra), and Cleoserrata clades. In previous studies, Inda et al. [11] and Feodorova et al. [12] also could not get the clear resolution of the Cleome species from species of other genera in Cleomaceae. They found that some species of the Polanisia, Corynandra, Cleomella, Dactylaena and Podandrogyne genera were grouped with the Cleome species. In this study, it was found that Corynandra chelidonii and Corynandra felina was not grouped with Corynandra viscosa. These two Corynandra species were grouped with Cleome aspera and Cleome simplicifolia in the clade Corynandra + Cleome (Figs. 1–3). The reason behind this might be that many of the genera belonging to the Cleomaceae family are nested within Cleome and previously recognized subfamilies do not show monophyletic groups [1,11,35]. Traditionally, it was considered that Cleomaceae was comprised of three subfamilies of Capparaceae [35,36]. The Cleoserrata genus belongs to Capparaceae and does not show any monophyletic group as Cleoserrata speciosa and Cleoserrata paludosa clustered with the Cleome species (Fig. 3).
To assess the genetic variability, the choice of molecular markers is the key point. In this study, we have used the RAPD and ISSR markers to find out the genetic diversity among collected species. RAPD markers have simplicity, speed and relatively low cost compared to other molecular markers; this is why RAPD markers have been extensively used for analysing genetic diversity [37,38]. ISSR markers assess variability in the microsatellite region dispersed throughout the genome [39]. ISSR markers do not require prior gene sequence information and produce more reliable, reproducible bands, and the method is cheaper than AFLP [40].
Genetic polymorphism is an indication of evolutionary adaptation, which has a main role in the survival of species in a changing environment [41]. Results of RAPD and ISSR markers analysis showed 100% polymorphism among the studied species. He and I are the important indices for the evaluation of genetic diversity among species [42]. The range of all diversity indices for RAPD primers was He = 0.1115–0.1323 and I = 0.2268–0.2544. ISSR primers showed He = 0.1164–0.1714 and I = 0.2302–0.2700 (Table 6). This result indicates a significant amount of genetic diversity among the studied species. The significance of PIC values is such that they are used to evaluate the amount of genetic diversity as high (PIC > 0.5), medium (PIC < 0.5) and low (PIC < 0.25) [43]. PIC values for RAPD (PIC = 0.5267–0.7938) and ISSR (PIC = 0.5662–0.7615) markers were greater than 0.5, which indicates that RAPD and ISSR markers could develop high-locus polymorphism, which is useful to access the genetic variability of the species. GD values give some idea of the level of genetic variability among the selected species (Table 7). Nei's GD matrix based on selected RAPD and ISSR primers revealed a GD among studied species in the range from 0.1535 to 0.4035 (Table 7). Combined data from different marker systems proved to be reliable and effective for the estimation of the level of genetic diversity and relationship among species [44,45]. Combined analysis of selected RAPD and ISSR marker showed that the studied species clustered into three different groups as group I (Corynandra + Cleome) contains Corynandra viscosa, Cleome monophylla, Cleome simplicifolia, Cleome aspera, Corynandra felina, Cleome rutidosperma and Cleome gynandra. Group II (Corynandra) contains Corynandra chelidonii. Group III (Cleoserrata) contains Cleoserrata speciosa (Fig. 5A). The PCA result was similar to the clusters of all accessions derived from UPGMA analysis (Fig. 5B).
Nei's genetic distance matrix.
| Plant code | C1 | C2 | C3 | C4 | C5 | C6 | C7 | C8 | C9 |
| C1 | – | ||||||||
| C2 | 0.4035 | – | |||||||
| C3 | 0.2604 | 0.2811 | – | ||||||
| C4 | 0.3023 | 0.3023 | 0.1535 | – | |||||
| C5 | 0.4035 | 0.3801 | 0.2401 | 0.2811 | – | ||||
| C6 | 0.3917 | 0.3686 | 0.2104 | 0.2707 | 0.3023 | – | |||
| C7 | 0.3349 | 0.3801 | 0.2007 | 0.2604 | 0.3349 | 0.2811 | – | ||
| C8 | 0.3572 | 0.3801 | 0.2202 | 0.2007 | 0.3349 | 0.3023 | 0.3130 | – | |
| C9 | 0.3801 | 0.2916 | 0.2007 | 0.2811 | 0.3572 | 0.3239 | 0.3349 | 0.3572 | – |
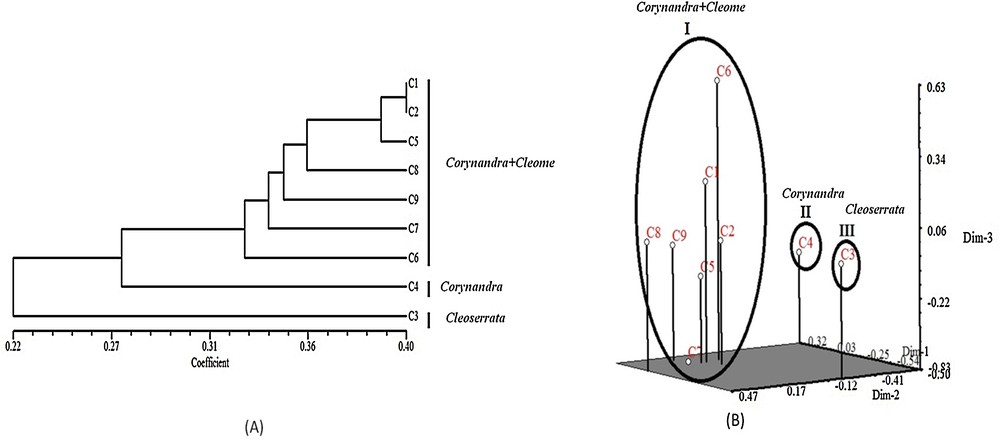
(A) UPGMA dendrogram of 9 species based on selected RAPD + ISSR markers. (B) PCA analysis of 9 species based on selected RAPD + ISSR marker data. C1: Corynandra viscosa, C2: Cleome monophylla, C3: Cleoserrata speciosa, C4: Corynandra chelidonii, C5: Cleome simplicifolia, C6: Cleome gynandra, C7: Cleome rutidosperma, C8: Cleome aspera, C9: Corynandra felina.
5 Conclusions
This study added molecular characterization like DNA barcodes for the identification of Cleome simplicifolia, Cleome aspera, Corynandra chelidonii and Corynandra felina in existing barcodes that are available for other Cleome and Corynandra species. Corynandra chelidonii and Corynandra felina species belong to the Corynandra genus, but phylogenetic analysis based on DNA barcoding showed that they do not group with the Corynandra viscosa species, but are however clustered with the Cleome species. Since Corynandra and Cleoserrata are the New World's taxa of Cleomaceae, this study will be helpful to recognize the classification of New World's Cleomaceae. Selected RAPD (OPA-4 and RAPD-17) and ISSR (ISSR-1and ISSR-2) markers can be used to discriminate the species of the Cleome and Corynandra genera from Cleoserrata speciosa.
Disclosure of interest
The authors declare that they have no competing interest.
Acknowledgment
Authors are thankful to the Department of Biotechnology, New Delhi, India, for funding under Interdisciplinary Programs on Life Sciences for advanced Research and Education (IPLS) (Grant number–BT/PR4572/INF/22/147/2012), to Shivaji University, Kolhapur, India, and to the Ministry of Environment, Forest and Climate Change (MoEF) (F. No. 10/04/2012-CS/BG).