

1 Introduction
Faba bean (Vicia faba L.) is one of the earliest and most produced legumes worldwide [1]. It is rich in proteins and is widely used for animal and human nutrition [1,2]. It also has a crucial role in nitrogen fixation and fertility of soil, and can grow in different climatic areas [1]. Faba bean is a diploid crop, with outcrossing rates ranging from 1 to 55% [1]. Based on the seed size, four varieties of faba bean have been defined, including the equine, paucijuga, minor and major types [1,2]. North Africa represents one of the best faba bean-producing regions worldwide [2]. Egypt and Sudan produce higher yields than Tunisia [2]. However, the improvement of faba bean yield is still required to meet the needs of the increasing population. Developing new faba bean varieties able to tolerate the challenging abiotic and biotic stresses has therefore become the top priority. Selecting and introducing new germplasms into the future breeding programmes could further enhance the desired agronomic traits and crop genetic diversity, resulting in developing new high-yield varieties [2]. As a result, assessment of genetic variability of the genetic resources maintained at gene banks is essential to further enhance crop tolerance to abiotic and biotic stresses, leading to high production yields.
Agronomic and morphological traits were utilized for evaluating the diversity of different crop species such as faba bean [3]. However, these traits might be affected by environmental factors, which makes them inadequate for assessing diversity levels [4–6]. Several molecular genetic markers have been therefore developed and utilized as efficient methods for characterizing plant genetic resources as well as evaluating their genetic diversity levels [1,2,7–16]. Simple sequence repeats (SSRs), commonly known as microsatellites, would also be used as powerful markers in evaluating diversity levels, phylogenetic relationships, and genetic structure of faba bean [1,2,17]. Microsatellites showed higher efficiency in genetic diversity analysis because they are co-dominant and abundant in the plant's genome, revealing high allelic diversity [2,18]. Furthermore, microsatellites have higher transferability to the closely related crops [2,19]. Microsatellites have been successfully isolated and assessed in several crops, including faba beans [20,21]. Therefore, the main objective of this study was to utilize efficient microsatellite markers to evaluate the diversity levels and genetic structure of the selected faba bean germplasm originated from different African and Eastern Asian countries. This will help in developing new faba bean varieties of highly agronomic traits.
2 Material and methods
2.1 Plant material
Thirty-five accessions of Vicia faba L. were received from the Centre for Genetic Resources (CGN) in the Netherlands (Table 1). These accessions originated from six counties, representing three geographical regions like Northern Africa (Egypt and Morocco), Eastern Africa (Sudan and Ethiopia), and Near East (Iraq and Yemen).
List of Vicia faba L. accessions analyzed.
| No. | Accession number | Origin |
| 1 | CGN07739 | Egypt |
| 2 | CGN07738 | Egypt |
| 3 | CGN13460 | Egypt |
| 4 | CGN15626 | Egypt |
| 5 | CGN13497 | Egypt |
| 6 | CGN07737 | Egypt |
| 7 | CGN15619 | Egypt |
| 8 | CGN13515 | Egypt |
| 9 | CGN07740 | Egypt |
| 10 | CGN13510 | Egypt |
| 11 | CGN13456 | Egypt |
| 12 | CGN07806 | Egypt |
| 13 | CGN07775 | Ethiopia |
| 14 | CGN07717 | Ethiopia |
| 15 | CGN07774 | Ethiopia |
| 16 | CGN07752 | Ethiopia |
| 17 | CGN07827 | Ethiopia |
| 18 | CGN15600 | Ethiopia |
| 19 | CGN15556 | Ethiopia |
| 20 | CGN07913 | Morocco |
| 21 | CGN12326 | Morocco |
| 22 | CGN18926 | Morocco |
| 23 | CGN15570 | Sudan |
| 24 | CGN07800 | Sudan |
| 25 | CGN07801 | Sudan |
| 26 | CGN07802 | Sudan |
| 27 | CGN15575 | Sudan |
| 28 | CGN15614 | Iraq |
| 29 | CGN07732 | Iraq |
| 30 | CGN15565 | Iraq |
| 31 | CGN15568 | Iraq |
| 32 | CGN07708 | Iraq |
| 33 | CGN15617 | Iraq |
| 34 | CGN07805 | Yemen |
| 35 | CGN12311 | Yemen |
2.2 DNA extraction
DNA was extracted from 3-week-old leaves of three individuals of each of the 35 accessions using DNeasy Plant Mini Kit following manufacturers’ protocol. DNAs of the total set of individuals were used for microsatellites analysis.
2.3 Microsatellites analysis
Fifteen faba bean SSR primer sets were selected [22], and used to screen the 35 faba bean accessions in this study. The sequences of these primer sets are shown in Table 2. PCR reactions were conducted as previously reported by Suresh et al. (2013) [22]. PCR conditions were adjusted as 95 °C for 10 min; 10 cycles at 94 °C for 30 s, 60–50 °C for 30 s, and 72 °C for 30 s; followed by 25 cycles at 94 °C for 30 s, 50 °C for 30 s, and 72 °C for 30 s, and 72 °C for 10 min. The amplified products were analysed on an automatic ABI3130xl sequencer. Alleles were scored and analysed against the ROX-500 standard using GeneMapper 4.1.
SSR primers sets, number of alleles (N), observed heterozygosity (Ho), polymorphic information content (PIC) and expected heterozygosity (He) in the 35 accessions of Vicia faba L.
| SSR primers (loci) | Sequences (5’-3’) | Sample size | N | H o | H e | PIC |
| GBSSR-VF-8 | F: TAAAGCAGCTCCGGATGA R: TCGGTGGAGGAGTTGTTG |
105 | 11 | 0.30 | 0.81 | 0.78 |
| GBSSR-VF-20 | F: TCCACCAAGTCCACCTGA R: AATAAGGGCGCAGGAGAG |
105 | 7 | 0.25 | 0.63 | 0.60 |
| GBSSR-VF-22 | F: CGAAGCCTCCTCCTCTTC R: CAAGTGGCCGTTTTTCAA |
105 | 6 | 0.17 | 0.61 | 0.55 |
| GBSSR-VF-32 | F: CGAAGCCTCCTCCTCTTC R: GGTGTTGATTCGGGGAGT |
105 | 4 | 0.14 | 0.56 | 0.52 |
| GBSSR-VF-52 | F: GGTTTCTTGTCCAAATAAGACG R: TGCGATTCTGGAAATTGG |
105 | 6 | 0.31 | 0.62 | 0.59 |
| GBSSR-VF-115 | F: TGCTGCTTTTCCAACCAT R: GTGCATGCCATAACAAAA |
105 | 8 | 0.28 | 0.66 | 0.61 |
| GBSSR-VF-131 | F: CCGTACTAAATGAAGCCTTT R: GGCAATCAAGTCCGGTAA |
105 | 6 | 0.16 | 0.51 | 0.44 |
| GBSSR-VF-168 | F: TCTCCAAACCCTCCTCGT R: TCAGCCACAAAATCAGCA |
105 | 7 | 0.29 | 0.69 | 0.63 |
| GBSSR-VF-172 | F: CGGTTTCTAAATCTGGCG R: CTCCATTGAAACCAATTCT |
105 | 9 | 0.33 | 0.71 | 0.66 |
| GBSSR-VF-175 | F: TGCCATTCCATCTGAACC R: CCAGGCAATGGAATCTGA |
105 | 8 | 0.32 | 0.67 | 0.63 |
| GBSSR-VF-190 | F: TTTTATGAAAGCGAAACCG R: TGGACAAAGGCAACAATCA |
105 | 6 | 0.26 | 0.68 | 0.64 |
| GBSSR-VF-262 | F: TCTGGCGAGTGGCATACT R: GCCTTCTACACAACGGCTT |
105 | 8 | 0.31 | 0.67 | 0.62 |
| GBSSR-VF-263 | F: ATGCCACCCTCACTTTCC R: TCCTTCCAAATTCAGAATCC |
105 | 5 | 0.24 | 0.55 | 0.49 |
| GBSSR-VF-266 | F: CAAATGCAATGCTGCAAA R: AACAGGTGGTGGCTGATG |
105 | 4 | 0.21 | 0.52 | 0.46 |
| GBSSR-VF-285 | F: AAGAAGGTGTCGCGGAAG R: CCGCACCTTCTCCTCTCT |
105 | 5 | 0.28 | 0.51 | 0.48 |
| Mean | 6.67 | 0.26 | 0.63 | 0.58 |
2.4 Data analysis
GenAlEx 6.5 [23] and PowerMarker 3.25 [24] were used to measure the diversity indices like the number of alleles (N), the observed heterozygosity (Ho), the polymorphic information content (PIC), the expected heterozygosity (He), the number of private alleles (Ap), and the fixation index or inbreeding coefficient (F). GenAlEx 6.5 was used to estimate the analysis of molecular variance (AMOVA). Cluster analysis was conducted using Nei's genetic distance [25].
STRUCTURE 2.3 software [26] was used to assess the structure of the analysed accessions. Structure analysis was run with hypothetical populations numbers (K) varying from 1 to 11, with 100,000 burn-in run iteration and 100,000 Markov chain Monte Carlo, with 10 runs for each value of K. Structure Harvester [27] was utilized to indicate the best likely values of K [28].
3 Results
3.1 Diversity indices of SSR loci
Fifteen faba bean SSR primer sets were used to screen the 35 faba bean accessions analysed in the present study. Different diversity indices were calculated for the 15 SSR loci. All the SSR loci generated a total of 100 alleles in a total of 105 individuals analysed (Table 2). The allele number scored per locus ranged from 4 (GBSSR-VF-32, GBSSR-VF-266) to 11 (GBSSR-VF-8), with a mean of 6.67. The observed heterozygosity (Ho) of SSR loci varied from 0.14 (GBSSR-VF-32) to 0.33 (GBSSR-VF-172), with a mean of 0.26. Moreover, the expected heterozygosity (He) of SSR loci varied between 0.51 (GBSSR-VF-131, GBSSR-VF-285) and 0.81 (GBSSR-VF-8), with an average of 0.63. Polymorphic information content (PIC) also varied from 0.44 (GBSSR-VF-131) to 0.78 (GBSSR-VF-8), with a mean of 0.58 (Table 2). The most polymorphic loci exhibited the highest diversity, were GBSSR-VF-8 and GBSSR-VF-172. The results showed high variability levels within faba bean accessions.
3.2 Genetic diversity indices of faba bean genotypes
The diversity indices estimated for the analysed genotypes are shown in Table 3. The mean number of alleles per locus (A) varied from 1.62 (accessions CGN15568 and 15617 from Iraq) to 1.96 (accession CGN07738 from Egypt), with a mean of 1.81 (Table 3). The allelic richness (AR) also ranged from 1.55 (accession CGN15617 from Iraq) to 1.95 (accession CGN07738 from Egypt), with a mean of 1.751. The observed heterozygosity (Ho) varied from 0.133 (accession CGN15617 from Iraq) to 0.411 (accession CGN07738 from Egypt), with a mean of 0.25. The expected heterozygosity (He) varied from 0.161 (accession CGN15617 from Iraq) to 0.374 (accession CGN07739 from Egypt), with a mean of 0.271. PIC values varied from 0.122 (accession CGN15617 from Iraq) to 0.338 (accession CGN07737 from Egypt), with an average of 0.229. Thirteen accessions showed negative values of the fixation indices (F), indicating a high heterozygosity level (Table 3).
Genetic diversity indices for the 35 accessions of Vicia faba L. studied.
| Accession number | A | AR | H o | H e | PIC | F |
| CGN07739 | 1.91 | 1.89 | 0.312 | 0.374 | 0.327 | 0.182 |
| CGN07738 | 1.96 | 1.95 | 0.411 | 0.341 | 0.298 | −0.217 |
| CGN13460 | 1.87 | 1.84 | 0.271 | 0.326 | 0.281 | 0.158 |
| CGN15626 | 1.89 | 1.72 | 0.392 | 0.362 | 0.328 | −0.106 |
| CGN13497 | 1.76 | 1.74 | 0.226 | 0.299 | 0.262 | 0.218 |
| CGN07737 | 1.91 | 1.89 | 0.241 | 0.361 | 0.338 | 0.362 |
| CGN15619 | 1.88 | 1.82 | 0.364 | 0.311 | 0.263 | −0.156 |
| CGN13515 | 1.87 | 1.71 | 0.211 | 0.292 | 0.246 | 0.249 |
| CGN07740 | 1.79 | 1.75 | 0.251 | 0.267 | 0.231 | 0.042 |
| CGN13510 | 1.87 | 1.81 | 0.376 | 0.324 | 0.282 | −0.154 |
| CGN13456 | 1.96 | 1.83 | 0.277 | 0.304 | 0.258 | 0.102 |
| CGN07806 | 1.94 | 1.89 | 0.244 | 0.296 | 0.251 | 0.157 |
| CGN07775 | 1.82 | 1.78 | 0.223 | 0.278 | 0.229 | 0.152 |
| CGN07717 | 1.71 | 1.66 | 0.210 | 0.246 | 0.201 | 0.104 |
| CGN07774 | 1.88 | 1.71 | 0.294 | 0.281 | 0.233 | −0.037 |
| CGN07752 | 1.69 | 1.66 | 0.226 | 0.262 | 0.221 | 0.057 |
| CGN07827 | 1.78 | 1.72 | 0.244 | 0.298 | 0.256 | 0.159 |
| CGN15600 | 1.83 | 1.76 | 0.311 | 0.285 | 0.251 | −0.098 |
| CGN15556 | 1.89 | 1.79 | 0.284 | 0.274 | 0.232 | −0.035 |
| CGN07913 | 1.91 | 1.89 | 0.233 | 0.296 | 0.246 | 0.181 |
| CGN12326 | 1.83 | 1.81 | 0.331 | 0.317 | 0.272 | −0.069 |
| CGN18926 | 1.93 | 1.87 | 0.252 | 0.299 | 0.253 | 0.125 |
| CGN15570 | 1.84 | 1.76 | 0.214 | 0.279 | 0.236 | 0.182 |
| CGN07800 | 1.87 | 1.79 | 0.225 | 0.212 | 0.181 | −0.031 |
| CGN07801 | 1.75 | 1.71 | 0.203 | 0.249 | 0.211 | 0.147 |
| CGN07802 | 1.81 | 1.75 | 0.185 | 0.226 | 0.184 | 0.121 |
| CGN15575 | 1.79 | 1.74 | 0.293 | 0.271 | 0.232 | −0.068 |
| CGN15614 | 1.74 | 1.71 | 0.177 | 0.221 | 0.182 | 0.154 |
| CGN07732 | 1.66 | 1.63 | 0.221 | 0.191 | 0.143 | −0.104 |
| CGN15565 | 1.72 | 1.66 | 0.157 | 0.179 | 0.132 | 0.062 |
| CGN15568 | 1.62 | 1.58 | 0.201 | 0.242 | 0.197 | 0.128 |
| CGN07708 | 1.66 | 1.62 | 0.224 | 0.211 | 0.163 | −0.037 |
| CGN15617 | 1.62 | 1.55 | 0.133 | 0.161 | 0.122 | 0.110 |
| CGN07805 | 1.68 | 1.61 | 0.183 | 0.174 | 0.131 | −0.034 |
| CGN12311 | 1.71 | 1.64 | 0.142 | 0.169 | 0.128 | 0.072 |
| Mean | 1.81 | 1.751 | 0.250 | 0.271 | 0.229 |
Furthermore, the faba bean genotypes were divided into three groups (Northern Africa, Eastern Africa, and Near East) based on the geographical factor. The genetic diversity estimates for faba bean groups at the regional level were calculated and are shown in Table 4. The number of private alleles (Ap) ranged from 6 (Near East region) to 9 (Northern Africa region). The mean number of alleles (A) ranged from 1.68 (Near East region) to 1.88 (Northern Africa region). The observed heterozygosity ranged from 0.180 (Near East region) to 0.285 (Northern Africa region). The expected heterozygosity varied from 0.194 (Near East region) to 0.313 (Northern Africa region). The fixation index also ranged from 0.044 (Near East region) to 0.082 (Northern Africa region).
Genetic diversity estimates of Vicia faba genotypes in the three geographical regions using SSR data.
| Vicia faba group | A | A p | H o | H e | F |
| Northern Africa | 1.88 | 9 | 0.285 | 0.313 | 0.082 |
| Eastern Africa | 1.81 | 7 | 0.240 | 0.261 | 0.057 |
| Near East | 1.68 | 6 | 0.180 | 0.194 | 0.044 |
Analysis of molecular variance (AMOVA) has been performed to partition the genetic variance levels among regions (Northern Africa, Eastern Africa and Near East), among accessions, and within accessions (Table 5). AMOVA results showed that much of variability resided within accessions (79.2%, Table 5). A highly significant difference among regions (P < 0.001) was evidenced and represented 5.3% of the total variation, whereas the variability among accessions accounted for 15.5%.
AMOVA of diversity in Vicia faba L.
| Variation source | Variance components | Total variance (%) | P(f) |
| Among regions | 0.286 | 5.3 | < 0.001 |
| Among accessions | 0.847 | 15.5 | < 0.001 |
| Within accessions | 4.318 | 79.2 | < 0.001 |
| Total | 5.451 | 100 |
3.3 Cluster analysis and population structure
Nei's genetic distance-based dendrogram was conducted using SSR data, and revealed the phylogenetic relationships among the 35 faba bean genotypes analysed in the current study (Fig. 1). The cluster tree was divided into two main clusters. The first main cluster comprised all faba bean genotypes originating from Near East regions (six accessions originating from Iraq and two accessions originating from Yemen). The second main cluster split into two subclusters. The first subcluster included 10 among the 12 genotypes originating from Egypt, three accessions originating from Morocco, and two accessions originating from Sudan, whereas the second subcluster contained all accessions originating from Ethiopia, two accessions originating from Egypt, and three accessions originating from Sudan (Fig. 1). The cluster analysis showed that the Northern and Eastern Africa faba bean genotypes were more closely related to each other than to the Near East genotypes.
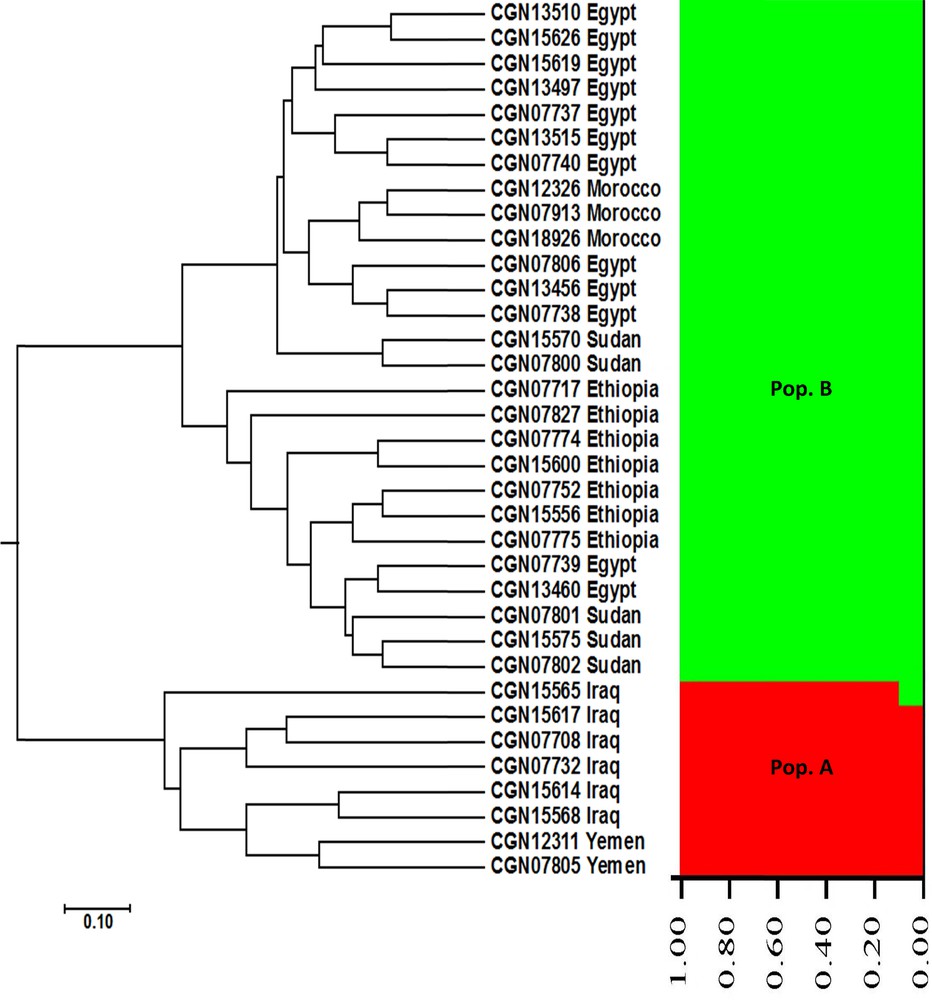
UPGMA cluster tree and structure analysis of Vicia faba accessions using SSR markers.
The population structure of the 35 faba bean genotypes was assessed based on SSR data by using STRUCTURE 2.3 software. This analysis could determine the hypothetical number of populations to which faba bean genotypes might be assigned. The structure analysis of faba bean accessions indicated that K = 2 corresponds to the highest ΔK value (161.66) (Fig. 2). Therefore, K = 2 was selected to represent the genetic structure of the genotypes, indicating that the 35 faba bean genotypes might be assigned to two populations. At K = 2, all the accessions originating from the Near East region (six accessions from Iraq and two accessions from Yemen) were assigned to the first population (Pop. A) (Fig. 1), whereas all the accessions originating from the Northern and Eastern Africa regions (12 accessions from Egypt, three accessions from Morocco, five accessions from Sudan, and seven accessions from Ethiopia) were assigned to the second population (Pop. B). These results also show that the Northern and Eastern Africa faba bean genotypes were more closely related to each other than to the Near East genotypes, in complete agreement with our UPGMA cluster analysis data.
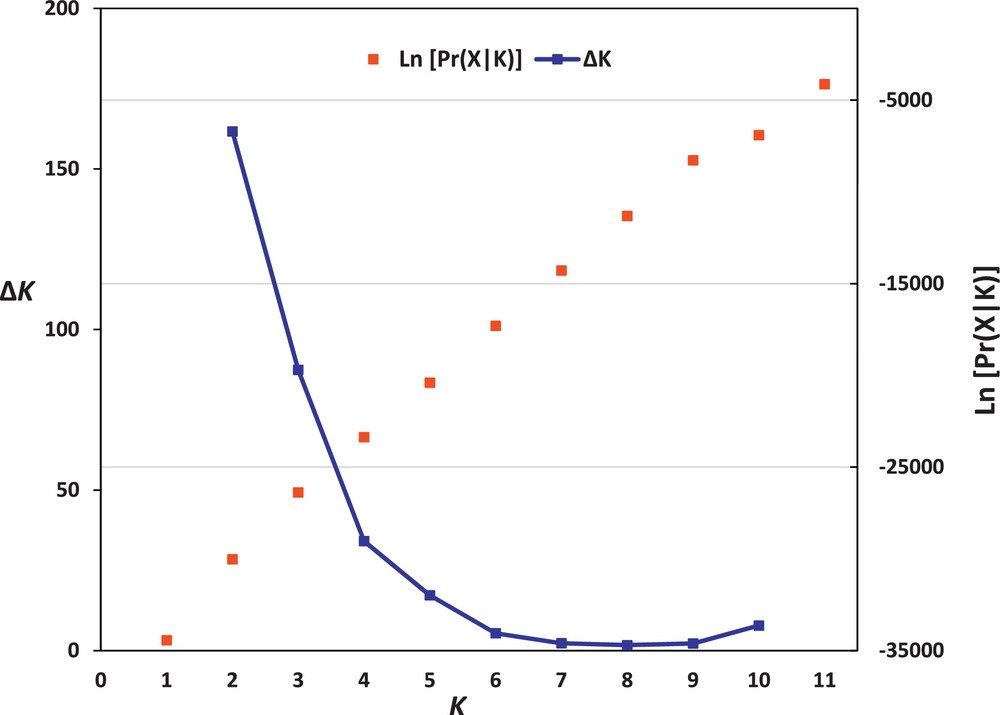
The log-likelihood and ΔK values of population structure of Vicia faba.
4 Discussion
Assessing diversity levels and population structure of Vicia faba L. germplasm is important for improving the yield of this economic crop. As the phenotyping traits are generally affected by the environment, several molecular markers have been utilized to reveal the diversity levels, relationships, and genetic structure of faba bean resources. Microsatellites (SSR) also showed a high proficiency in assessing diversity levels, relationships, and genetic structure of the faba bean [1,2,17] due to their co-dominance and rich allelic diversity. In the current study, 15 microsatellite loci were utilized to assess the diversity and genetic structure of 35 faba bean genotypes originating from three regions like Northern Africa, Eastern Africa, and the Near East. This will help selecting promising candidates for breeding programmes. All the tested SSR loci were polymorphic, and could differentiate among accessions. The loci generated 100 alleles in total, with a mean of 6.67 alleles per locus. Such mean value (6.67) was higher compared to SSAP (1.68) and SSR (5.94; 4; 1.6) [1,2,16,17], indicating that SSRs are potential markers for evaluating the variability of the Vicia faba L. germplasm. The most polymorphic loci exhibiting the highest diversity were GBSSR-VF-8 and GBSSR-VF-172, which were evidenced by the high allele number (11 and 9, respectively). Ovesna et al. [29] and Tufan and Erdoğan [17] also stated that the high genetic diversity level of loci corresponded to their high allele number. The observed heterozygosity (Ho) of SSR loci varied from 0.14 (GBSSR-VF-32) to 0.33 (GBSSR-VF-172). These range values were slightly lower than the values recorded by Oliveira et al. [1] and Gong et al. [30] (Ho = 0–0.47 and 0–0.5, respectively). Moreover, the expected heterozygosity (He) of SSR loci ranged from 0.51 to 0.81, with a mean of 0.63, indicating a high diversity revealed by SSR loci analysed in this study. The polymorphic information content (PIC) represents an important measure of a locus differentiation ability. In this study, PIC varied between 0.44 (GBSSR-VF-131) and 0.78 (GBSSR-VF-8), with an average of 0.58, indicating the potential ability of SSR loci to differentiate among faba bean genotypes. Such PIC was higher than that recorded by Oliveira et al. [1], who stated that PIC varied from 0.662 to 0.071, with a mean of 0.333. This PIC average value was also higher than that recorded by Tufan and Erdoğan [17] and Gong et al. [30] (0.37 and 0.292, respectively).
The current study revealed that 22 faba bean accessions originating from the three different geographical regions contained an expected heterozygosity level higher than the observed one, indicating that these 22 genotypes were influenced by the inbreeding rate recorded in this crop. However, the observed heterozygosity was greater than the expected one for the other 13 faba bean genotypes analysed, indicating a high heterozygosity level. These data agreed with that recorded by Oliveira et al. [1]. Moreover, the mean PIC of the analysed accessions was 0.229, indicating that the accessions comprised a high diversity due to the outcrossing rates. Furthermore, the genetic diversity estimates for faba bean groups at the regional level showed that faba bean genotypes originating from Northern Africa contained a private allele number and genetic diversity level higher than that of the other two groups. AMOVA analysis also revealed that the highest variation resided within accessions (79.2%). This result agreed with that recorded by Oliveira et al. [1]. A highly significant difference among regions was revealed and represented 5.3% of the total variation, indicating that the faba bean genotypes originating from the Near East region contained genetic variability, which is not represented in the genotypes originating from the other two regions. These genetically diverse genotypes could also be used as parental resources in future breeding programs to develop new cultivars of highly agronomic traits.
The cluster analysis divided the 35 faba bean genotypes into two main clusters. The first main cluster comprised all faba bean genotypes originating from the Near East region, whereas the second main cluster comprised all the genotypes originating from the Northern and Eastern Africa regions, indicating that the Northern and Eastern African faba bean genotypes were more closely related to each other than to the Near East genotypes. These results agreed with that recorded by Abid et al. [2]. Moreover, the structure analysis revealed that the 35 faba bean genotypes might be assigned to two populations. The genotypes originating from the Near East region were assigned to the first population, whereas all the accessions originating from the Northern and Eastern Africa regions were assigned to the second population. These results agreed with the cluster analysis data of this study. The results also agreed with that reported by Oliveira et al. [1], who also found that the faba bean genotypes analysed were assigned to two populations.
In conclusion, the results of the present study revealed high diversity levels in Vicia faba genotypes, and could be exploited in future breeding programmes to develop new cultivars of high yield. SSR markers confirmed their high efficiency in assessing the diversity and genetic structure of Vicia faba genotypes.
Disclosure of interest
The author declares that he has no competing interest.
Acknowledgement
The author thanks Dr. Margaret Ahmad and the French lab members for facilitating this work during his postdoctoral fellowship at the University of Paris-6, France. The author would also like to thank his home University (Tanta University) in Egypt for their appreciated support.