

1 Introduction
The Sebkha of Imlili is, like all sebkhas, a dried depression in the desert. These depressions are erratically flooded by rainfall events, during which they become a short-lived endorheic salted lake, as the water table is composed of salt water. The Sebkha of Imlili is located in the extreme South of Morocco (23°17′30″–23°11′45″N; 15°56′41″–15°53′37″W) (Figs. 1 and 2), 40 km south of El Argoub, and 15 km east of the Atlantic Ocean. This shallow depression, less than 10 m in depth, is about 12 km long and 2.5 km wide, lying in a NNE–SSW general direction. It is surrounded by sand dunes and, mainly on the western and northern borders, plants form a narrow band, 20 to 30 m wide. In the northern part of the sebkha, the sandy soil is red, and is covered in the drier areas by a fine white powder corresponding to salt crystallisation. The most significant feature of this sebkha is the presence, especially on the western and northern borders, of 161 permanent water holes (Figs. 1 and 2). Their diameter varies between 0.5 m and 37 m, with depths ranging from 40 cm to 4.6 m. Their bottom is sandy, and the borders have sand and salt concretions. The water supply to these holes is largely through small outbreaks that appear at the bottom where the water table intersects with, and moistens the soil of the sebkha. In some of these salty water holes (from 39 to 45 g/L), there are fish populations (Fig. 2). Initially identified as Coptodon zillii (Gervais, 1848), they were then reported to be Coptodon guineensis (Günther, 1862) [1] (Fig. 2).

Location of the sebkha of Imlili and of the water holes studied. A. Morocco. B and C. Area where the sebkha is located. D. Water holes area within the sebkha. E. The waters holes studied and swamp. Google Earth V7.1.8.3036 (16 January 2015).
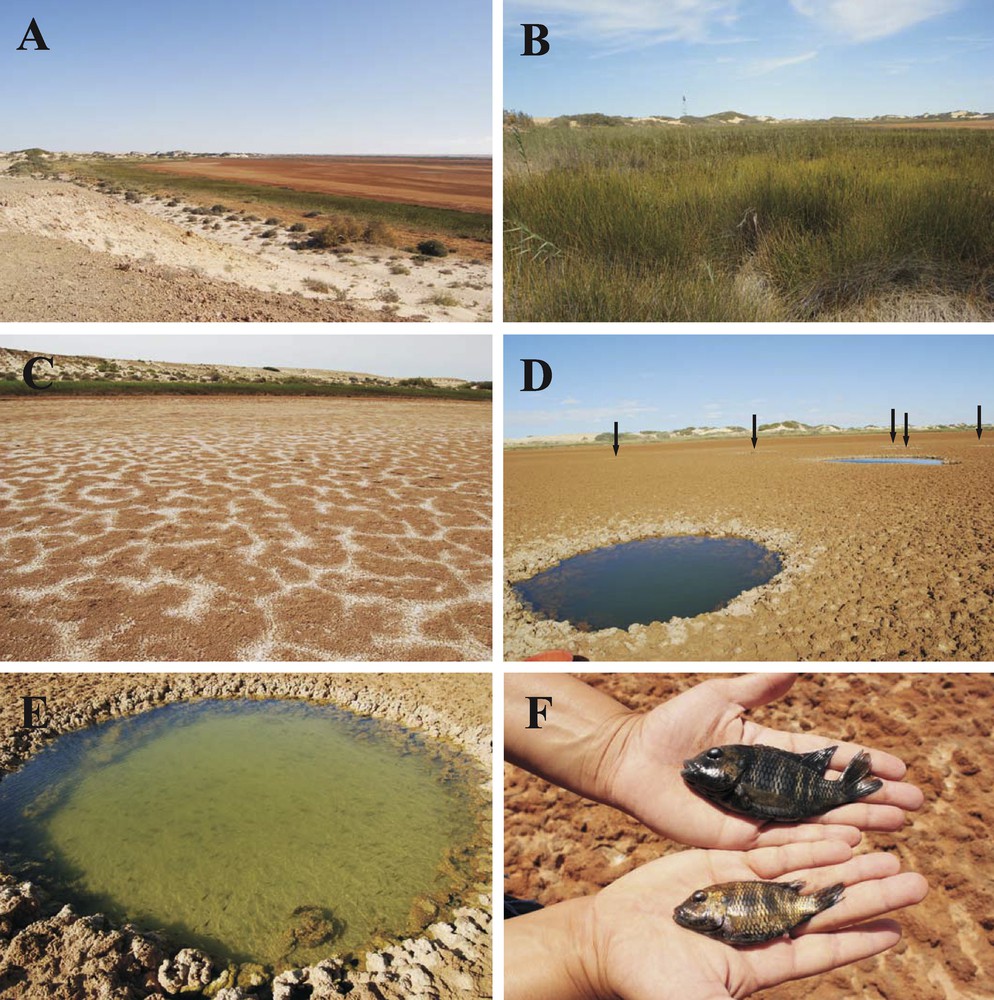
Views of the sebkha and the fish present in the water holes. A. View from the top of the sand dunes. B. Band of plants surrounding the sebkha. C. Sandy soil with salt crystallization. D. Permanent water holes (two are clearly visible, five are indicated with arrows). E. Fish in a permanent hole. F. Close up of two specimens of C. guineensis from the sebkha (male above, female below).
The presence of fish in the desert has long been well known and has been reported by many authors [2–5]. In all cases, however, it was freshwater fish such as Cyprinids, Siluriformes, and Cichlids. Coptodon guineensis is a euryhaline fish, usually living in brackish waters in the river mouths and lagoons along the West African coast, from Angola to Morocco. In Morocco, the species has recently been found in the wadi Aabar [6], thus extending its range 1400 km northward from the River Senegal. The species is also present in the sea, near Dakar in Senegal, and has recently been identified in the Banc d’Arguin, in Mauritania [7].
The aim of the present study was to confirm the taxonomic status of the fish from the sebkha, by studying their mitochondrial DNA sequences. We also intended to obtain insights into the genetic structure of these populations living in different water holes. When the water holes are very close together (just a few meters apart) and belong to the same water lens, fish can easily switch from one to another. When water holes are several hundred meters apart, and the area between them does not have another water hole, it is unlikely that fish can pass from one hole to another. However, during rainy periods, when water floods the sebkha for a few hours or even days, fish could on this occasion pass from one hole to another, more distant, one. We used the study of microsatellites study to assess the genetic structure of this unique fish population assemblage and infer the level of individual movements between water holes.
2 Materials and methods
2.1 Sampling method and statement of ethics
The fish used in the phylogenetic study (Table 1, Fig. 1) were collected from different locations in the sebkha: holes 71 (23.273778N, 15.917255W), 121 (23.272678N, 15.921623W), 129 (23.273244, 15.920921W), 130 (23.273296N, 15.920892W), and 148 (23.273961N, 15.920653W); the fish used in the microsatellite study were collected from four localities: water holes 35 (23.276394N, 15.915238W), 37 (23.276436N, 15.915553W), and 121, and the swamp (23.282684N, 15,909980W). The authorization to collect was provided by the “Haut Commissariat aux eaux et forêts et à la lutte contre la désertification” (HCEFLCD-Maroc). All fishing and tissue processing was carried out under existing collaborative arrangements between the Scientific Institute (Mohammed V University) in Rabat and the NGO Nature Initiative in Dakhla for the purposes of biodiversity research. As there is no Institutional Animal Care and Use Committee or equivalent animal ethics committee in Morocco, no formal approval was obtained for this work. Hundreds of fish live in colonized water holes (84 of the 161 existing water holes host either fish, crustaceans or molluscs), meaning that this species is not sensitive to light sampling of a few individuals. Nevertheless, to minimize the impact on these populations, we only took specimen fin clips and preserved them in a solution of 90% ethanol. To minimize the suffering of the individuals studied, live specimens were captured using seine nets and immediately anaesthetized with MS-222 (Tricaine-S, Western Chemicals Inc) before fin clip extraction. After sampling, the fish were kept for one hour in a bucket protected from light to allow them to recover, before re-introducing them into their natural habitat. The fish sampled in Senegal (Hann Bay off the coast of Dakar) or in Côte d’Ivoire (Layo in the Ebrié Lagoon; Grand Lahou; San Pedro and Fresco on the Sassandra River; the Marahoué River) were collected from the catches of local fishermen.
Cichlid species and samples used in the phylogenetic analyses and in the microsatellite study, species, locality of collection, and GenBank accession number.
| Species | Locality | GenBank accession number |
| Coptodon guineensis | Hann Bay off Dakar, Senegal | MG755417-MG755448 |
| Marahoué River, Côte d’Ivoire | MG755449 | |
| Bandama River at Kossou, Côte d’Ivoire | MG755450-MG755452 | |
| Sassandra River at Soubré, Côte d’Ivoire | MG755453 | |
| Lac de Fae, Sans Pedro, Côte d’Ivoire | MG755454-MG755456 | |
| Lake Fresco, Côte d’Ivoire | MG755457-MG755458 | |
| Grand Lahou, Côte d’Ivoire | MG755459-MG755461 | |
| Layo, Côte d’Ivoire | MG755462-MG755465 | |
| Imili swamp, Morocco | ||
| Imlili water hole 35, Morocco |
||
| Imlili water hole 37, Morocco |
||
| Imlili, water hole 71, Morocco | MG755466-MG755473 | |
| Imlili, water hole 121, Morocco | MG755474-MG755478 | |
| Imlili, water hole 129, Morocco | MG755479-MG755486 | |
| Imlili, water hole 130, Morocco | MG755487-MG755488 | |
| Imlili, water hole 148, Morocco | MG755489-MG755500 | |
| Kouilou, Congo | AF317256 | |
| unknown origin | GQ167837 | |
| Coptodon zillii | Cairo, Egypt | AB195555 |
| Unknown origin | GQ167836 | |
| Sarotherodon melanotheron | Kouilou, Congo | AF317245 |
| Sarotherodon galileaus | Lake Kinneret, Israel | DQ465031 |
| Chromidotilapia guentheri | Unknown origin | AF317270 |
| Tylochromis leonensis | Lake Tanganyika | AF317274 |
2.2 DNA extraction
Approximately 50 mg of the sample tissue (fin clip) were sheared into fine pieces before being digested at 55 °C overnight using 10 mL proteinase K (10 mM/mL) in 190 mL of an extraction buffer solution (1 M Tris, 0.5 M NaCl2, 1% SDS). DNA was then extracted from each sample following the protocol described for genomic DNA extraction for PCR-based techniques [8]. The DNA extracted was suspended in sterile double distilled water and stored at –20 °C until PCR amplification.
2.3 MtDNA sequencing
A 1147-bp fragment containing the complete ND2 gene was amplified in each sample using two primers: ND2F 5′-CATACCCCAAACATGTTGGT-3′ (forward) and ND2R 5′-GGAGATTTTCACTCCCGCTTA-3′ (reverse). Amplifications were performed in a final volume of 50 mL containing 0.25 mM of MgCl2, 0.2 mM of each dNTP, 1 mM of each primer, 5 mL of 10 × buffer and 10 units of Taq polymerase (Promega). The PCR reaction conditions were: 3 min of pre-heating at 94 °C followed by 35 cycles of 30 s at 94 °C, 30 s at 48 °C and 1 min at 72 °C, with a final elongation phase at 72 °C for 5 min.
Additional sequences obtained from GenBank were also included in the analysis (Table 1). Sequences from Coptodon zillii, a closely related species [9], sequences from Sarotherodon melanotheron and S. galilaeus, two other “tilapia” species, and sequences from Chromidotilapa guentheri and Tylochromis leonensis Cichlid species were added as an outgroup to root the trees according to [10]. The sequences were aligned manually using BioEdit 5.09 [11]. The aligned sequences were analyzed using the Maximum Likelihood (ML) Minimum Evolution (ME) and Distance Method (DM, the Kimura two-parameter model [12], followed by the Neighbor Joining methods [13]) using MEGA (Molecular Evolutionary Genetics Analysis) software version 5.1 [14]. Before starting the analysis, an evolutionary model for ML and ME was selected by MEGA 5.1 [15], using the Bayesian information criterion (BIC) [16]. The model with the lowest BIC scores was considered as best describing the substitution pattern. Supports for inferred clades were obtained through the non-parametric bootstrap [17] with 2000 replicates.
2.4 Microsatellite study
One microgram of total genomic DNA was isolated from the individuals and sent to GenoScreen, France (www.genoscreen.com) to develop microsatellite libraries through 454 GS-FLX Titanium pyrosequencing of enriched DNA libraries, as described in [18]. Briefly, total DNA was enriched for AG, AC, AAC, AAG, AGG, ACG, ACAT, and ATCT repeat motifs and subsequently amplified. The PCR products were purified and quantified, and GsFLX libraries were then constructed in accordance with the manufacturer's protocols (Roche Diagnostics) and sequenced on a GsFLX-PTP. The bioinformatics programme QDD [19] was used to filter for redundancy, resulting in a final set of sequences from which it was possible to design primers. Finally, of the 5347 sequences including a microsatellite motif, 128 primer sets were designed and a sub-group of 47 primer pairs was tested for amplification on 8 DNA samples. Primer sets were discarded if they failed to amplify or led to multiple fragments. Then, 24 microsatellite loci from validated primer sets were selected for a polymorphism study on 15 DNA samples. PCR amplifications were performed in 25 μL reactions containing 20 ng of template DNA, 1 × reaction buffer, 37.5 pmol of MgCl2, 6 pmol of dNTP, 10 pmol of fluorescent primer, 10 pmol of primer, and 1 U Taq of polymerase (FastStart–Roche Diagnostics). The PCR cycling consisted of an initial denaturation at 95 °C for 10 min, followed by 40 cycles: denaturation at 95 °C for 30 s, annealing at 55 °C for 30 s, and extension at 72 °C for 1 min and final extension at 72 °C for 10 min. Each microsatellite amplification was diluted with H2O (1:50), mixed with Hi-Di Formamide and GeneScan 500 LIZ Size Standard (Applied Biosystems). The fragments were separated using an Applied Biosystems 3730XL DNA Analyser. The alleles were scored using GeneMapper v5.0 software (Applied Biosystems). Finally, 16 markers were selected for population genotyping (Table 2).
Primer used (forward and reverse) to observe the variability at the 16 microsatellite loci studied and nature of their respective repeated sequence.
| Locus | Forward primer | Reverse primer | Repetition |
| M-02 | AGCTGCCTAATGCTCTCAGC | CTGACCCACTACTCCGGAAC | ctt |
| M-07 | AAATTGCGTACCCAGAGACA | TGTGAGATAGCAGCATTCTGAG | ca |
| M-11 | CTGATGATGTGCACTTTGAAGTTA | TGAATAGGGGCACTTTCTGA | ag |
| M-14 | TGAATCTGTGTCCACCACTAAG | TGCCATGTATGGTTTGCTTT | agg |
| M-17 | CGCAACCGTCTCTGAACTG | AATGGACGTTTCTAGCCGTG | ag |
| M-20 | AATGAGTTTGAAAATTGGCCC | AAGACATGTTAAAAGCCTAAAGGG | gt |
| M-23 | TGATAGAGAACCAAAACATTGCAG | AGTGAGAGCTCTTTGGGGAA | ac |
| M-27 | CAAATAGCGTTTAGGAGCCG | TAGGCAGACTGCTGTTGTCG | ac |
| M-30 | TAGCTGTAACAAAACAAATTTCCC | TCTAGTCTTGAGGATTTGTTAGGG | ttatc |
| M-33 | CAGGTGTGCATTCCTTCTCA | TCCCTCTCCTTCCCTCTGTT | ca |
| M-36 | TCAGGAATGAAAAGATTTAAAATAGAA | CAATGACTTTTACCTTTAACTCAACA | atct |
| M-38 | TTCAGAAGACACGCATGAACA | CCAATCCTAACCTTGTGGTCC | ac |
| M-41 | ACCCTACTTAGCTTGCTGCG | TCTACTGATGTCATTAAGGGTGGA | tgga |
| M-45 | GAAGTCCCAGCTGAAGCAGA | ACTGAGGATCGACATGGAGG | atc |
| M-46 | TCAAGTCGCTTAGATCTTTGTTATG | ATGCCAAGCCTCCATTCTAA | tcaa |
| M-47 | AGGCAGAAATAGGGCATTGA | AAGTCTCGAGCCACCTTCTTT | atct |
2.5 Genotype analyses
Microsatellite data were checked for scoring errors due to stuttering or large allele dropout and the presence of null alleles, using MICRO-CHECKER software [20]. The intra-population genetic variability was measured by estimating the observed heterozygosity (HO), the expected heterozygosity (HE), and the inbreeding coefficient (FIS) using GENEPOP software version 3.4 [21]. FST and associated probabilities were estimated using a Markov chain method in accordance with [22]. The length of the Markov chain involved a burn-in period of 1000 iterations and 100 batches of 1000 iterations thereafter. A Factorial Correspondence Analysis (FCA) was carried out with GENETIX software version 4.05 [23] in order to investigate the relationships between individuals. This type of analysis can explain a maximum amount of genetic variation using a minimum number of factors and can also provide the means for visualizing the genetic relationships between populations. The GENETIX software version 4.05 [23] was also used to determine whether or not there was a correlation between geographical distances and genetic distances between in the different samples.
2.6 Population structure
The clustering approach implemented in STRUCTURE v2.3.3 [24] was used to infer the number of potential population units within the sebkha. We chose the admixture model with correlated allele frequencies and, because our sampling scheme involved collecting many individuals from a few discrete distant locations [25], we used the sampling location as prior information [26]. We used default values for all the other parameters in the software. Each run consisted of a burn-in period of 105 Markov chain Monte Carlo (MCMC) iterations, followed by 106 MCMC iterations. We carried out 10 replicate runs for each value of the number (K) of clusters, set between 2 and 4 (i.e. the number of samples).
3 Results
3.1 mtDNA differentiation
Eighty-nine new ND2 sequences (1025 bp) were obtained during this study (Table 1), representing only 13 different haplotypes, A to M (Fig. 3). Two were present in the Imlili population (A and B), two in the Hann population (C and D) and eleven in the Côte d’Ivoire populations (E to M). All these sequences were aligned with GenBank sequences from C. zillii, Sarotherodon melanotheron, S. galilaeus, Chromidotilapa guentheri, and Tylochromis leonensis, and formed a matrix composed of 96 different sequences. This sequence matrix contained 372 variable sites, from which 206 were parsimony informative.
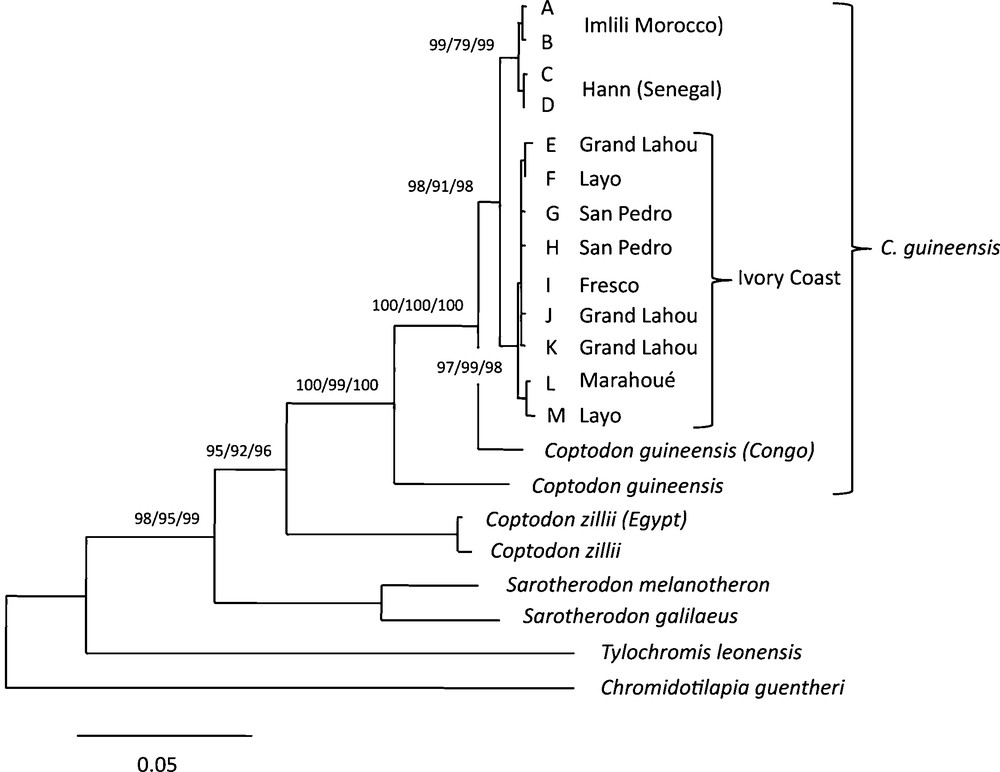
Consensus tree based on Distance method (Kimura 2P distance and Neighbour Joining methods), Minimum Evolution and Maximum Likelihood, using MEGA version 5.1 (Kumar et al., 2004). The numbers above the branches are percentages of bootstrap values based on 2000 replicates for each method. The letters A to M refer to the 13 different haplotypes observed in the present study. Other sequences were obtained from GenBank (see Table 1). The scale refers to Kimura 2 distance.
According to the different values of the corrected Akaike Information Criterion (AIC) obtained with MEGA 5.1, the optimum model for sequence evolution was the HKY + G model [27]. This model was used in the ML and ME analyses. Phylogenetic relationships among all the haplotypes observed based on the ML, ME or DM methods were congruent.
Fig. 3 shows the ME consensus tree obtained, on which the bootstrap values observed with the three methods are indicated. When rooted using Chromidotilapia guentheri and Tylochromis leonensis the two Sarotherodon species (S. melanotheron and S. galilaeus) appeared to be the sister group to the Coptodon species. Within the Coptodon clade, Coptodon zillii from Cairo and C. zillii of unknown origin were grouped together, forming the sister group to all the C. guineensis haplotypes. Within the C. guineensis clade, haplotypes from Kouilou (Congo) and another of unknown origin appeared basal, while the different haplotypes from Côte d’Ivoire, on the one hand, and the Imlili and Hann haplotypes, on the other one, appeared more derived (forming a monophyletic group that presented more recent genetic divergence). All these groups were supported by high bootstrap values varying from 79% to 100%.
3.2 Microsatellite study
The numbers of alleles observed in the 16 loci studied in the different samples are summarized in Table 3. Three loci were monomorphic M11, M14, and M17. A total of 54 different alleles was detected at the 13 polymorphic loci. The largest number of alleles was detected for locus M-41 (eight alleles) and the lowest for the loci M-07, M-20, M-23 and M-38 (two alleles). The mean number of alleles per locus varied between 2.9 in the swamp sample and 3.5 in the water hole 37 sample.
Observed allelic frequencies at 13 microsatellite loci in 4 samples: SW, swamp, water holes 121, 35 and 37.
| Locus | Allele | Population | |||
| SW | 121 | 35 | 37 | ||
| N | 10 | 31 | 52 | 27 | |
| M02 | 158 | 0.25 | 0.42 | 0.33 | 0.41 |
| 161 | 0.05 | 0.00 | 0.00 | 0.00 | |
| 164 | 0.70 | 0.58 | 0.67 | 0.59 | |
| M07 | 177 | 0.55 | 0.16 | 0.01 | 0.04 |
| 179 | 0.45 | 0.84 | 0.99 | 0.96 | |
| M20 | 256 | 0.00 | 0.60 | 0.45 | 0.22 |
| 258 | 1.00 | 0.40 | 0.55 | 0.78 | |
| M23 | 145 | 0.00 | 0.26 | 0.26 | 0.37 |
| 153 | 1.00 | 0.74 | 0.74 | 0.63 | |
| M27 | 166 | 0.00 | 0.06 | 0.00 | 0.04 |
| 170 | 0.65 | 0.77 | 0.89 | 0.93 | |
| 174 | 0.35 | 0.16 | 0.11 | 0.04 | |
| M36 | 152 | 0.40 | 0.50 | 0.42 | 0.35 |
| 204 | 0.00 | 0.16 | 0.24 | 0.17 | |
| 212 | 0.50 | 0.23 | 0.11 | 0.41 | |
| 216 | 0.00 | 0.02 | 0.00 | 0.00 | |
| 220 | 0.10 | 0.05 | 0.23 | 0.07 | |
| 224 | 0.00 | 0.05 | 0.00 | 0.00 | |
| M30 | 195 | 0.10 | 0.19 | 0.14 | 0.19 |
| 210 | 0.35 | 0.00 | 0.08 | 0.09 | |
| 215 | 0.00 | 0.00 | 0.04 | 0.04 | |
| 220 | 0.55 | 0.81 | 0.74 | 0.63 | |
| 225 | 0.00 | 0.00 | 0.00 | 0.06 | |
| M33 | 223 | 1.00 | 1.00 | 0.75 | 0.76 |
| 229 | 0.00 | 0.00 | 0.25 | 0.24 | |
| M38 | 100 | 0.35 | 0.00 | 0.06 | 0.07 |
| 104 | 0.65 | 1.00 | 0.94 | 0.93 | |
| M41 | 97 | 0.25 | 0.00 | 0.01 | 0.02 |
| 113 | 0.00 | 0.00 | 0.13 | 0.04 | |
| 117 | 0.00 | 0.03 | 0.00 | 0.04 | |
| 121 | 0.00 | 0.00 | 0.12 | 0.19 | |
| 129 | 0.70 | 0.76 | 0.68 | 0.57 | |
| 133 | 0.00 | 0.21 | 0.06 | 0.13 | |
| 137 | 0.00 | 0.00 | 0.00 | 0.02 | |
| 141 | 0.05 | 0.00 | 0.00 | 0.00 | |
| M45 | 152 | 0.45 | 0.27 | 0.13 | 0.20 |
| 179 | 0.00 | 0.03 | 0.01 | 0.06 | |
| 182 | 0.00 | 0.24 | 0.24 | 0.31 | |
| 185 | 0.25 | 0.05 | 0.15 | 0.07 | |
| 188 | 0.00 | 0.23 | 0.10 | 0.00 | |
| 194 | 0.30 | 0.18 | 0.37 | 0.35 | |
| M46 | 200 | 0.00 | 0.03 | 0.07 | 0.19 |
| 208 | 0.00 | 0.06 | 0.01 | 0.00 | |
| 212 | 0.10 | 0.06 | 0.01 | 0.00 | |
| 216 | 0.85 | 0.74 | 0.90 | 0.74 | |
| 220 | 0.05 | 0.10 | 0.00 | 0.07 | |
| 224 | 0.00 | 0.00 | 0.01 | 0.00 | |
| M47 | 176 | 0.00 | 0.02 | 0.01 | 0.07 |
| 180 | 0.00 | 0.05 | 0.00 | 0.00 | |
| 184 | 0.00 | 0.21 | 0.17 | 0.28 | |
| 188 | 0.00 | 0.03 | 0.00 | 0.04 | |
| 200 | 1.00 | 0.66 | 0.82 | 0.61 | |
| 204 | 0.00 | 0.03 | 0.00 | 0.00 |
Using MICRO-CHECKER software, no scoring error caused by stuttering, no large allele dropout and no null alleles were detected, except at locus M27 in the population from the swamp. In this population, an excess of homozygotes was observed, suggesting that one null allele may have been present in this locus. No other genotype frequencies departure from Hardy Weinberg expectations was observed.
Inter-population differentiation as measured by FST [23], and the geographical distances between them are presented in Table 4. All pairwise FST values were between 0.031 and 0.167 and statistically significant (p < 1%), indicating significant differentiation among populations. Moreover, and even if the small number of samples did not make it possible to achieve a statistical test, it was worth noting (Fig. 4) that there was a differentiation by distance pattern. The more distant the populations were, the more genetically differentiated they were, while on the contrary, the closest populations were the least genetically differentiated. A mantel test carried out using GENETIX [23] produced Z = 1495.69. The 23 possible permutations in the matrix (4! − 1) produced only one value ≥ to the observed Z value, indicating the existence of a differentiation signal for distance relationships. In terms of the mean number of migrants exchanged per population at each generation, using the formula of Wright (1969) formula (Nm = (1 – FST)/4·FST), these numbers vary between 0.122 and 7.89.
FST values (upper matrix) and geographical distances (lower matrix) between each pair of samples.
| F ST | ||||
| Swamp | 35 | 37 | 121 | |
| Swamp | 0.16998 | 0.14125 | 0.16698 | |
| 35 | 1150 | 0.03073 | 0.04190 | |
| 37 | 1130 | 20 | 0.05682 | |
| 121 | 1900 | 770 | 750 | |
| Geographical distance (m) |
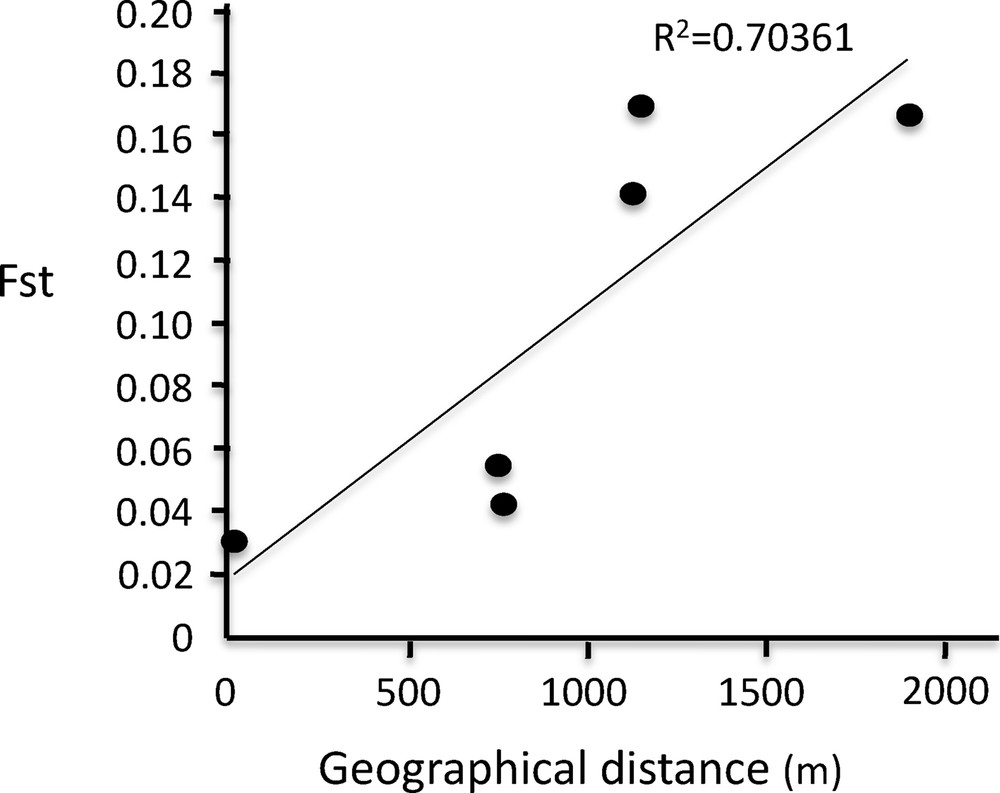
Distribution of FST values observed between each pair of populations versus geographical distances (in meters) between the corresponding water holes. The regression line emphasizes a possible isolation by distance effect.
With the programme GENETIX [23], we carried out a three-dimensional FCA (Fig. 5) that helped visualize these differentiations. Individuals from the swamp sample appeared differentiated from those one of the three other samples on the first axis. Individuals from the water hole 121 were mainly differentiated from individuals from the two other water holes, 35 and 37, on the second axis, while individuals from these two water holes were partially separated on the third axis.
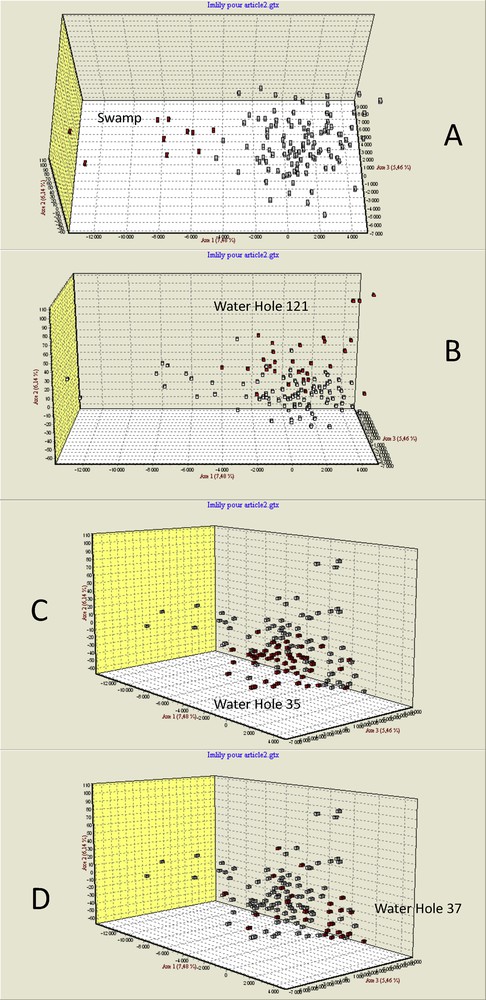
Factorial Correspondence Analysis (GENETIX 4.05) based on individual microsatellite genotypes at the 13 polymorphic microsatellite loci showing the differentiation of the four populations. Individuals from the swamp sample (A, in red) appeared differentiated from those of the three other samples on the first axis. Individuals from the water hole 121 (B, in red) were mainly differentiated from individuals from the two other water holes, 35 and 37, on the second axis, while individuals of these two water holes were partially separated on the third axis (C and D).
STRUCTURE analyses [24] of all the individuals sampled within the sebkha provided consistent results over the 10 runs tested for each K value (Fig. 6). The natural logarithm for the likelihood of the data ln(P(X|K)) increased from K = 2 (–2350.7) to K = 4 (–2248.0), which was the maximal. For K = 2, all the individuals from the swamp and water hole 121 were clearly distributed in two different populations (Fig. 6), while the individuals from water holes 35 and 37 were not assigned to either of them. For K = 3, the individuals from the swamp and water hole 121 were still assigned to two different populations as well as the individuals from water hole 35, which constituted a third population. The individuals from water hole 37 were still not assigned to any of these three populations. When K was set to 4, all the individuals from the swamp and water holes 121, 35 and 37 were respectively assigned to different populations.
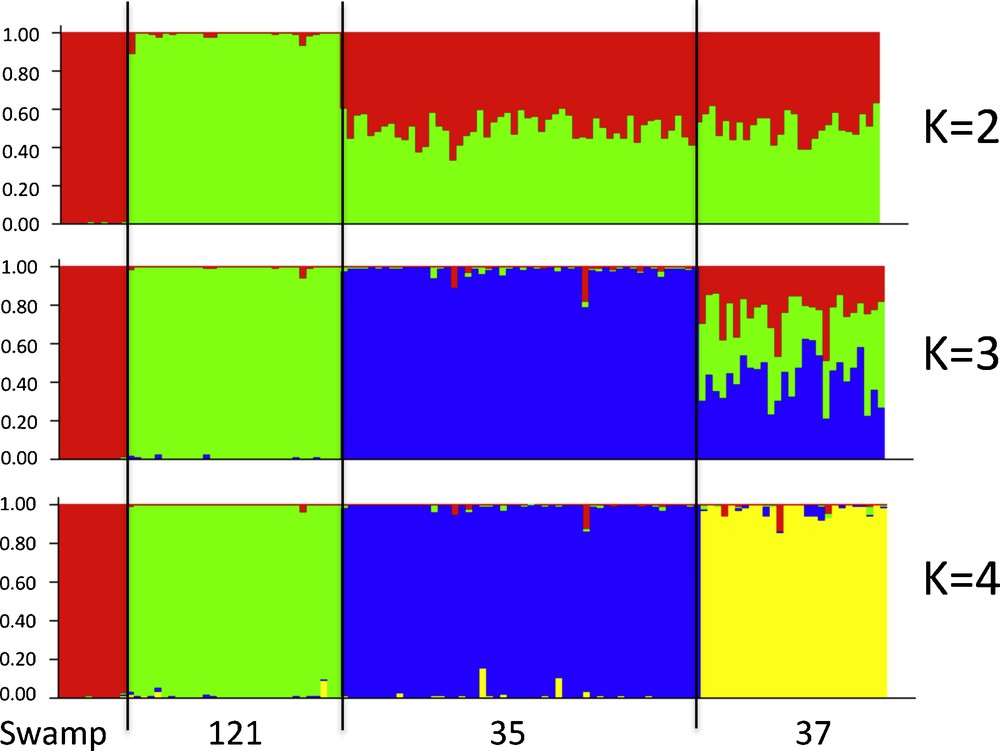
Bayesian clustering analysis with STRUCTURE software based on individual microsatellite genotypes at the 13 polymorphic microsatellite loci for specimens of the four populations from K = 2 to K = 4. Each vertical bar denotes one individual.
4 Discussion
Numerous fish species are present in the Sahara desert [2]. They bear witnesses to a period when today's desert was a tropical area with much greater rainfall. These species have always been freshwater species, even though the waters in the gueltas in which the fish are found can be quite salty [2]. The first originality of the fish present in the Sebkha of Imlili is that they belong to a euryhaline species. The results from the mtDNA study clearly show that they can be assigned to Coptodon guineensis. This euryhaline species is present along the West African coast from Angola to Morocco in the Wadi Aabar [6]. Coptodon guineensis is found mainly in lagoons where the salinity of the water varies from brackish to salt water [28]. The species can also swim upstream and can adapt to fresh water, such as in the Mono River for example [29]. Some populations are established in marine waters in Senegal (Hann) or in Mauritania (Banc d’Arguin) [7].
The presence of this species in such an environment indicates that in the past, this sebkha was likely a lagoon, and its location, only 15 km east from the Atlantic Ocean, makes this hypothesis probable. The presence in some of the water holes of other marine species, such as the plant Ruppia maritima Linnaeus 1753, the shrimp Paleamonectes varians (Leach, 1814), and the snail Hydrobia ventrosa (Montagu, 1803), is also in favor of the sebkha's lagoon origin.
The second originality lies in the genetic structure observed. Usually, when fish are found in the desert, they occupy a guelta, a pocket of water fed by a source generally corresponding to an oasis or a wadi. In these conditions, all the fish from the guelta can be considered as forming a unique population. Here, obviously, the fish from the water holes studied were genetically differentiated. Even though all these water holes (including the swamp) are periodically brought into contact in the case of extreme rain events, generally occurring about once a year, each population in the different water holes retains a certain level of genetic integrity. Thus, all the fish in the sebkha do not form one population, but rather a metapopulation [30]. A metapopulation is a set of populations of individuals from the same species that are separated spatially or temporally, yet interconnected by dispersion. In classical metapopulation theory, each population cycles in relative independence to the others and eventually becomes extinct as a result of demographic stochasticity i.e. fluctuations in population size due to random demographic events. This metapopulational structure can be regarded as good news from the point of view of the conservation of the sebkha's fish. Although small, individual populations may have short, finite life spans, the metapopulation as a whole is more stable because immigrants from one population (which may, for example, be experiencing a population boom) are likely to re-colonize a habitat that has been left open by the extinction of another population.
However, this metapopulation would not be protected from any modification to the ecosystem, such as the lowering of the water table, which could bring about the disappearance of all the water holes very quickly, and thus all the life they contain. Good knowledge of the hydrological function of the sebkha is needed to anticipate any perturbations caused by changes in precipitation regimes brought about by global warming. A comprehensive assessment of all C. guineensis populations forming the metapopulation of the sebkha would also be useful for better understanding their relationships and in particular for highlighting the possible existence of source populations that could become the priority for conservation efforts.
Finally, the relative reproductive isolation between the different water holes populations may seem similar to what has been observed in Lake Ejagham tilapias [30]. This very young lake was formed approximately 9 ka ago [31] in Cameroon. Nevertheless, this short time was enough to create a species flock of five species, some of which appeared in sympatry. In particular, two incipient sister species, Coptodon fusiforme “little black” and C. fusiforme “large black”, differentiated as a response to a differential utilisation of food resources [30,32]. The analysis of the gene flow between these two forms, using microsatellites, revealed a high yet incomplete reproductive isolation between them. Both the coloration and morphology of these forms are similar, but to some extent, there is detectable morphometric divergence. Interestingly, the “little black” form is always smaller when breeding than the “large black” form [30]. This certainly helps establishing a reproductive isolation, as fish prefer to mate with partners of a similar size. The comparison between the two forms in Lake Ejagham and the populations from the Sebkha of Imlili may suggest that these desert populations might in fact also represent incipient species. Even though there are no apparent difference in trophic specialization and no phenotypic differences among the fish from the different water holes, this hypothesis needs to be tested. For this reason, phenotypic and behavioral studies are required.
Disclosure of interest
The authors declare that they have no competing interest.
Acknowledgments
Mt DNA sequences were produced using the molecular genetic analysis technical facilities of the “Centre méditerranéen de l’environnement et de la biodiversité” (CeMEB). We are grateful to the members of the association “Nature initiative” for their technical support during field collections and their financial support for the microsatellite study.